
Introduction
Adequate perception of the physical aspects of sounds is essential for human oral communication; when a listener cannot perceive the auditory input because of either a hearing loss or another auditory dysfunction, communication breakdowns occur and the auditory message is misunderstood. Auditory processing is particularly important in children who are learning language and academic skills. Children with atypical auditory skills development may experience difficulty following directions, which leads to poor performance in school. Until recently, the study of auditory processing skills in children has been dominated by the assessment of temporal processing after the work of Paula Tallal and colleagues. Tallal, Miller & Fitch (1993) concluded that poor encoding of rapid acoustic signals was the cause of language and reading impairments. However, spectral processing is also reported as being difficult for these children (Bishop, Hardiman, Uwer, & von Suchodoletz, 2007). Additionally, frequency discrimination is of particular interest as it seems to be significantly affected in children with atypical auditory skills, pediatric Auditory Processing Disorder (APD) in particular (Moore, 2006).
Recently, David Moore and his colleagues (Moore, Ferguson, Halliday & Riley, 2008) conducted a behavioral study of frequency discrimination in 6-to-11 year-old children for a 1000 Hz base frequency pure tone. The smallest frequency change recorded was 1% of the base frequency in children labeled "good performers" and approximately 10% of the base frequency in children labeled "genuine poor performers". However, another group of children labeled "non compliant" had worse scores than the "genuine poor performers". These "non compliant" participants showed great fluctuation in their scores resulting in overall poor performances. The authors observed that when these children did poorly on frequency discrimination tasks, the possible role of attention factors on their performances could not be ruled out. One way to minimize attention factors in frequency discrimination tasks is by the use of electrophysiology which is more objective than behavioral testing. Since it does not require the subjects' participation and can be obtained even when subjects do not attend to the stimuli being presented, the recording of auditory evoked potentials might provide a better tool in the assessment of frequency discrimination in children than behavioral testing. Previous electrophysiological measures of spectral processing in children used large frequency differences and found differences in terms of the amplitude and latency of the responses between typically developing and atypically developing children (i.e. Bishop, 2007; Kraus et al. 1996). These studies used the Auditory Brainstem Response (ABR), the Mismatch Negativity (MMN) or the P1-N1-P2-N2 response. The cortical auditory potentials, which include the sensory potentials P1-N1-P2-N2 and the processing contingent potentials such as the MMN (Stapells, 2002), seem to be promising tools in the assessment of the auditory system since they give results at a higher level in the central nervous system than the ABR and can index small acoustic changes processed by the brain. In adults, the morphology of the sensory cortical auditory potentials shows a positive peak P1 around 50 ms, a negative peak N1 around 80 ms, another positive peak P2 around 180 ms and another negative peak N2 around 240 ms. In children, the morphology is different. In young children, a large positivity dominates;in five-year-olds the morphology consists of a positive peak around 80 ms and a negative peak around 200 ms. The first peak then evolves with age (increased amplitude and decreased latency) into the mature response seen in adults, with the emergence of N1 around nine years of age (Ponton, Eggermont, Khosla, Kwong & Don, 2002, Sussman, Steinschneider, Gumenyuk, Grushko, & Lawson, 2008). Typically, elicited by the onset of an auditory stimulus such as a click or a tone, this cortical response can also be elicited by an acoustic change. In this case the response is called the Acoustic Change Complex (ACC) (Martin & Boothroyd, 1999). The ACC can be recorded without the subjects' participation. Even though the ACC may be somewhat influenced by arousal level and attention, it is mainly influenced by an acoustic change and is therefore extremely useful in the objective assessment of discrimination abilities. There is no ACC study to date of the frequency discrimination capacity in children.
Recent studies have used the ACC to determine the smallest frequency change (Δf) that elicits a response in adults. Young adults with typical auditory functions had a Δf of 1.4 % of the base frequency for 500 Hz and 3000 Hz tones (Harris, Mills, He & Dubno, 2008) or 2% of the base frequency for 250 Hz and 4000 Hz tones (Dimitrijevic, Michalewski, Zeng, Pratt & Starr, 2008). Previous studies had shown very small Δf of .2% of the base stimulus for tones between 500 Hz and 2000 Hz for trained listeners (Wier et al. 1977). To date, there is no electrophysiological study that directly compares behavioral and electrophysiological thresholds for frequency changes.
The purpose of the present study is to determine the smallest frequency change that elicits a response in children, electrophysiologically and behaviorally, for two carrier frequencies: 500 Hz and 3000 Hz. Other goals include comparing the Δf electrophysiologically and behaviorally, and determining if Δf is the same for a low frequency carrier, 500 Hz and a high frequency carrier, 3000 Hz.
Method
Subjects
Participants were between the ages of 8 and 11 years, n=9 (mean age, 10 years 4 months; standard deviation, 10 months). All subjects had normal hearing as measured by a hearing screening. They also had normal cognitive and attention skills as measured by the Test of Nonverbal Intelligence - 3 (Brown, Sherbenou & Johnsen, 1997) and the Conners Rating Scales-Revised (Conners, 2002), and had test results within normal limits on the Test for Auditory Processing Disorders in Children-Revised (SCAN-C) (Keith, 2000) and the Clinical Evaluation of Language Fundamentals - 4 (CELF-4) screening test (Semel, Wiig & Secord, 2004). Participants came for a minimum of two sessions of three to four hours each. At the beginning of each session, the study was discussed with the child and his/her parent(s) or guardian(s), and they signed consent and assent forms. A hearing screening was also performed at the beginning of each session.
Stimuli
Tonal stimuli containing frequency increments and decrements from the base frequency were generated using Matlab 7.01. The base frequency of the tones was either 500 Hz or 3000 Hz and changes were introduced as a percentage of the base frequency. There were six changes introduced in the stimuli (and a no change condition): .125%, .25%, .5%, 1%, 2% and 4%. Stimulus conditions are listed in Table 1.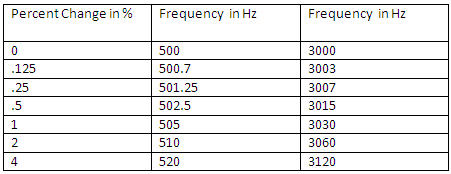
Table 1. Stimulus conditions.
The stimuli were regularly calibrated. They were presented via insert earphones for the electrophysiology portion of the study and via TDH 9 earphones for the behavioral part of the study. The presentation level was 70 dB SPL.
Procedure
Electrophysiological portion. For the electrophysiology part of the study, changes were introduced in a continuous tone. The base frequency pure tone lasted 990 ms, the up and down ramps were 10 ms each and the plateau of the change frequency was 990 ms. A trigger was placed at the onset of each up and down ramps. Each change (either up or down) was presented 200 times. There were four runs recorded for each condition (two runs done during one session and the other two runs done during the following session). The conditions were randomized. The ACC was measured with standard EEG recording techniques by placing a 32-electrode cap on the participant's scalp. Impedance of each electrode was checked and did not exceed 10000 Ohms for any electrode. Responses from the electrodes were digitized (A/D = 1000Hz), amplified (1000 times) and filtered (0.15 -100 Hz). Data was collected and stored for analysis using the Neuroscan SCAN 4.3 system. The procedure was conducted in a sound treated room;participants were seated in a comfortable chair and watched a silent video (close captioned) of their choice. After recording, data was processed by artifact rejecting (±100 µV), epoching (-100 to 922 ms), filtering (1 to 30 Hz, 12 dB/octave), and averaging by subject and condition.
Behavioral portion. For the behavioral part of the study, two one-second sounds were used: one was a continuous tone with no change;the other was a tone with a change. The sound with a change had a starting frequency that lasted 495 ms, a 10 ms ramp and a 495 ms plateau. There were two sets of changes: changes going up from the base frequency and changes coming down to the base frequency. There were twenty randomized presentations of the same change condition. This behavioral portion of the study involved a frequency discrimination task using a two-alternative, forced-choice procedure on a laptop. Children were told that they were going to hear two different sounds: one with a change in it (called a "wobble") and one with no change. At the beginning of the experiment, an example of a "wobble" or "uneven" tone and an example of a continuous or "even" tone were given; the child could click on each one to hear the difference. Once the child understood the "wobble", the two-alternative forced-choice procedure began. Participants were told to use the mouse to click on either box 1 or box 2 (representing the first tone presented and the second tone presented) depending on which they thought was the "wobble", and to take a guess when they were not sure. The task began with two practice trials with feedback and then the game called "Find the wobble" started. Children completed the 500 Hz carrier frequency task and the 3000 Hz frequency task, with a break in between. Once the game was over, the screen displayed a score of 100%, indicating that the participant had completed all the tasks. Responses were recorded and stored using Matlab and percentages of correct responses were calculated.
Results
Electrophysiological results
Using Neuroscan SCAN 4.3, the four runs for each condition were averaged for each participant and for the group (results were collapsed for the two directions of the change). When the amplitudes at each electrode were compared, the greatest response was observed at the midline electrodes (the greatest at FCz) and the expected inversion in polarity was observed between responses on the top of the head and responses at the mastoids. Since the largest response was obtained at FCz, responses at this site are presented. The grand mean waveforms recorded at FCz for each condition are shown in Figure 1 in order of greatest frequency change at the top of the figure to the no change condition at the bottom. The greatest frequency changes elicit an ACC with clear positive and negative peaks, the expected ACC morphology in this age group. Note that the ACC is very different between adults and children, with four clearly defined peaks in adults, and a broad positivity dominating the response in young children. The N1 negativity emerges in children at approximately age 9 years (Ponton, 2002). As described above, the maturation of the sensory cortical auditory potentials is ongoing throughout childhood and adolescence (Ponton, 2002; Sussman et al., 2008), and since the children in this study range in age from 8 to 11 years, the group waveform morphology still shows a large positive peak and a large negative peak.
Figure 1 also shows that the ACC amplitude decreases as the frequency changes get smaller and no response is observed for the no change condition. The latency of the ACC is not analyzed in this paper since the purpose of this study is to determine the smallest frequency change which elicits an ACC;therefore only the amplitude is analyzed.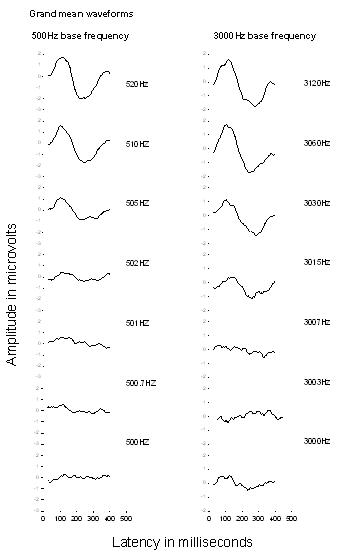
Figure 1. Grand mean waveforms recorded at FCz for each condition. The ACC is clearly visible for the largest frequency changes at the top for both the 500 Hz and 3000 Hz carrier frequency. The ACC amplitude presented as a function of latency decreases as the frequency changes get smaller and no response is recorded in the no change condition at the bottom.
Click Here to View a Larger Version of Figure 1 (PDF)
The root mean square (rms) amplitude of the response was calculated in the appropriate response window (25-400 ms) for each subject at FCz, where the greatest change was observed. The calculations were done for each condition for the two base frequencies 500 Hz and 3000 Hz. Table 2 shows individual root mean square amplitude (in microvolts) of the response at FCz for the 500 Hz base frequency and for the 3000 Hz base frequency. Results are presented for the 14 conditions for the nine participants.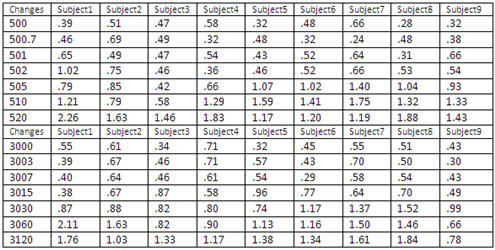
Table 2. Individual root mean square amplitude (in microvolts) of the response at FCz for the 500 Hz base frequency and the 3000 Hz base frequency.
Click Here to View a Larger Version of Table 2 (PDF)
For all subjects the amplitude of the ACC increased as the frequency change increased, and the no-change condition response was always smaller than the greatest frequency change response. The no change condition could have been used as the noise floor for this portion of the study. However, this method would have considered noise in only one condition. For that reason, the noise floor was first calculated by using the square root of the mean variance of each point in the waveform within the window divided by the number of accepted sweeps. Then, for each subject the noise amplitude for all the conditions was averaged and the point two standard deviations above the noise mean was used as the noise floor.
Behavioral results
Results for this experiment were obtained in percentages of correct responses for each participant. Since this portion of the study was a two-alternative forced-choice procedure, threshold was determined, as is typical with this procedure, as the point at which subjects obtained at least 75% of correct responses (Yost, 2007).
Thresholds (Δf)
For the electrophysiological portion of the study, the noise floor was defined as the point located two standard deviations above the mean variance of the rms amplitude;for the behavioral portion of the study, the chance level was defined as the 75% correct responses point. Thresholds were calculated by performing a linear regression on the rms amplitude and on the percentages of correct responses plotted as a function of frequency changes (one point below and two points above the noise floor/chance level). Threshold was defined as the point at which the regression line and the noise floor/chance level intersected.
Electrophysiological thresholds for the 500 Hz base frequency as shown in Figure 2 ranged between 501 Hz and 511.5 Hz. The mean threshold was 503.5 Hz (standard deviation 3.5).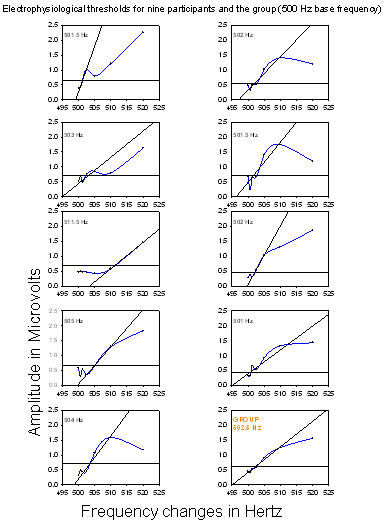
Figure 2. Electrophysiological thresholds for the nine participants and the group (500 Hz base frequency). Root mean square amplitudes of the responses are plotted as a function of frequency changes; each point is connected by a blue line. The thick horizontal line represents the noise floor, dots below this line are in the noise and dots above the line represent the amplitude of the ACC response. A linear regression was performed on the rms amplitudes and regression lines were inserted (oblique lines). Threshold for each participant and for the group is at the intersection of the noise floor and the regression line.
Click Here to View a Larger Version of Figure 2 (PDF)
Similarly, electrophysiological thresholds for the 3000 Hz base frequency as shown in Figure 3 ranged from 3004 Hz to 3027.5 Hz and the mean was 3016 Hz (standard deviation is 8.5).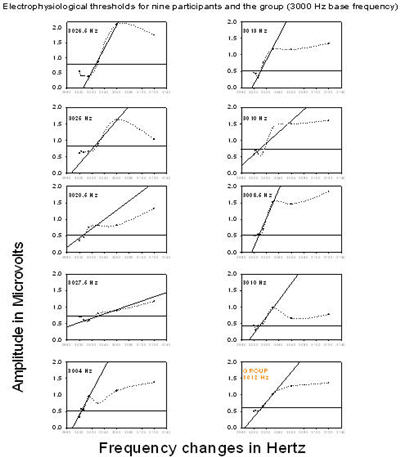
Figure 3. Electrophysiological thresholds for nine participants and the group (3000 Hz base frequency). Root mean square amplitudes of the responses are plotted as a function of frequency changes, each point is connected by a dotted line. The thick horizontal line represents the noise floor, dots below this line are in the noise and dots above the line represent the amplitude of the ACC response. A linear regression was performed on the rms amplitudes and regression lines were inserted (oblique lines). Threshold for each participant and for the group is at the intersection of the noise floor and the regression line.
Click Here to View a Larger Version of Figure 3 (PDF)
Behavioral thresholds for the 500 Hz base frequency as shown in Figure 4 ranged between 502 Hz and 507 Hz;the mean was 503.5 Hz (standard deviation, 2).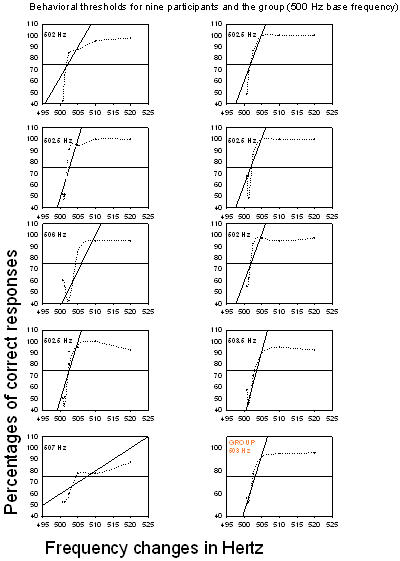
Figure 4. Behavioral thresholds for the nine participants and the group (500 Hz base frequency). Percentages of correct responses are plotted as a function of frequency changes; each point is connected by a dotted line. The thick horizontal line represents the 75% chance level, dots below this line are below the chance level and dots above the line represent a percentage of correct responses above chance level. As was done with the electrophysiological results, a linear regression was performed on the percentages of correct responses and regression lines were inserted (oblique lines). Threshold for each participant and for the group is at the intersection of the chance level and the regression line.
Click Here to View a Larger Version of Figure 4 (PDF)
Behavioral thresholds for the 3000 Hz base frequency as shown in Figure 5 ranged from 3009 Hz to 3027.5 Hz;the mean was 3014 Hz (standard deviation, 7).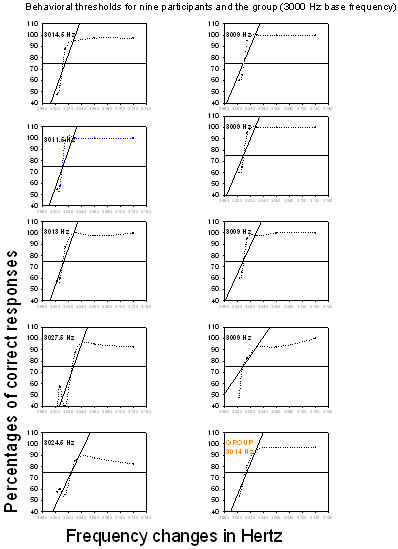
Figure 5. Behavioral thresholds for the nine participants and the group (3000 Hz base frequency). Percentages of correct responses are plotted as a function of frequency changes; each point is connected by a dotted line. The thick horizontal line represents the 75% chance level, dots below this line are below the chance level and dots above the line represent a percentage of correct responses above chance level. A linear regression was performed on the percentages of correct responses and regression lines were inserted (oblique lines). Threshold for each participant and for the group is at the intersection of the chance level and the regression line.
Click Here to View a Larger Version of Figure 5 (PDF)
Thresholds in Hertz were converted into thresholds in percentages of frequency change; results are shown in Table 3.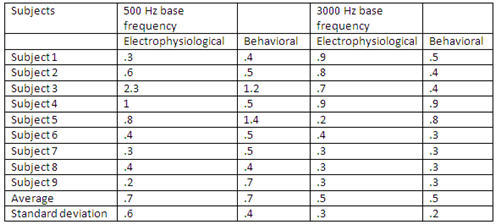
Table 3. Thresholds in percentages of frequency change.
Click Here to View a Larger Version of Table 3 (PDF)
Statistical analysis
A repeated measure ANOVA as a function of measure and base frequency was used to determine if the thresholds obtained in percentages of frequency change were similar for the electrophysiological and the behavioral portions of the experiment and if the thresholds for the two base frequencies, 500 Hz and 3000 Hz, were similar. Statistical results showed no main effect of measure between electrophysiological and behavioral results, F(1, 8) = 1.53, p = 0.25;no main effect of base frequency, F(1, 8) = 0.135, p = 0.72; and no significant interaction between measure and base frequency, F(1, 8) = .09, p = 0.77.
Discussion
This study shows that electrophysiological recordings of the ACC in response to small frequency changes can be obtained in children in response to very small frequency changes: .7% of the base frequency at 500 Hz, and .5% of the base frequency at 3000 Hz, on average. These results show lower Δf than the 1.4% previously recorded in adults by Harris et al. (2008) and the 2% previously recorded in adults by Dimitrijevic et al. (2008). One reason for this difference is that the present study involved very small frequency changes: the smallest change was .125% of the base frequency. In Dimitrijevic et al., the smallest frequency change tested was 2% of the base stimuli, so even if subjects had smaller Δf than 2% it was not measured. One possible explanation for the smaller Δf in the present study as compared to Harris et al. is that threshold in the present study was defined statistically rather than by visual observation of the waveforms.
This study also shows that in typically developing children behavioral Δf can be very small: .7% of the base frequency at 500 Hz, and .5% of the base frequency at 3000 Hz, on average. These results are lower than those obtained by Moore et al. (2008). There are two probable explanations for this: in the present study children were screened for attention deficits and threshold search involved a two-alternative forced-choice procedure whereas Moore et al. used a staircase procedure.
The results of the present study confirm the Harris et al. (2008) findings that a low frequency tone (500 Hz) or a high frequency tone (3000 Hz) yield similar Δf electrophysiologically.
Thresholds obtained electrophysiologically or behaviorally are similar. So far, no other study has directly compared electrophysiological and behavioral Δf in children.
Conclusion
The smallest frequency change needed to elicit an ACC is .7% of the base frequency at 500 Hz and .5% of the base frequency at 3000 Hz, on average. Behaviorally Δf is also .7% at 500 Hz, .5% at 3000 Hz, on average. The frequency discrimination thresholds obtained electrophysiologically and behaviorally are similar, indicating that the ACC is a reliable tool in indexing Δf in children. In addition, Δf in children is similar for a low frequency carrier, 500 Hz and a high frequency carrier, 3000 Hz. Since measurements of the ACC can be obtained without subject participation and without subjects attending to the auditory stimuli, it should be possible to use the ACC to determine frequency discrimination thresholds in children with atypical auditory skills. More studies are needed to determine if this is clinically feasible. Future research should investigate the ACC in response to small frequency changes in atypically developing children, particularly those with APD.
Acknowledgements
This research was conducted at the City University of New York (CUNY) Graduate Center in Dr. Brett Martin's Auditory Evoked Potentials Laboratory, and the author gratefully acknowledges her instruction and assistance, as well as the help of Dr. Glenis Long and Simon Henin. This project received financial support from two CUNY grants and the Long Island Speech Language Hearing Association doctoral award.
1First a sine wave was created: y= sin (wt+Φ), then the phase at the time of change is calculated and a linear ramp is introduced: y = sin (a.k2 + b.k + Φ) (k= index time, a = Π(f1-f0)/ ramp time and b= 2Π. f0).
References
American Speech-Language-Hearing Association. (2005, April). (Central) auditory processing disorders (Technical report). Available from www.asha.org/policy. Washington, D.C.: Author.
Bishop, D. V. & McArthur, G. M. (2005). Individual differences in auditory processing in specific language impairment: A follow-up study using event-related potentials and behavioural thresholds. Cortex;a journal devoted to the study of the nervous system and behavior, 41(3), 327-341.
Bishop, D. V., Hardiman, M., Uwer, R. & von Suchodoletz, W. (2007). Atypical long-latency auditory event-related potentials in a subset of children with specific language impairment. Developmental science, 10(5), 576-587.
Brown, L., Sherbenou, R.J. & Johnsen, S.K. (1997). Test of nonverbal intelligence, third edition. San Antonio, TX: Pearson.
Conners, C.K. (2002). Conners rating scale - revised. North Tonawanda, NY: Multi-Health Systems Inc.
Dimitrijevic, A., Michalewski, H.J., Zeng F.G., Pratt, H. & Starr, A. (2008). Frequency changes in a continuous tone: Auditory cortical potentials. Clinical Neurophysiology, 119, 2111-2124.
Harris, K.C, Mills, J.H., He, N.J., & Dubno, J.R. (2008). Age-related differences in sensitivity to small changes in frequency assessed cortical evoked potentials. Hearing Research 30 XXX, clinical neurophysiology: official journal of the International Federation of Clinical Neurophysiology, 114(4), 673-684.
Keith, R.W. (2000). Development and standardization of the SCAN-C test for auditory processing disorders in children. Journal of the American Academy of Audiology, 11, 438 - 445.
Kraus, N. (2007). Brainstem encoding of sound - implications for language and music. Association for Research in Otolaryngology Abstracts, 30, 1 - 2.
Kraus, N., McGee, T. J., Carrell, T. D., Zecker, S. G., Nicol, T. G. & Koch, D. B. (1996). Auditory neurophysiologic responses and discrimination deficits in children with learning problems. Science, 273(5277), 971-973.
Martin, B. A. & Boothroyd, A. (1999). Cortical, auditory, event-related potentials in response to periodic and aperiodic stimuli with the same spectral envelope. Ear and Hearing, 20(1), 33-44.
Martin, B.A., Tremblay, K. & Stapells, D. (2007). Principles and applications of the cortical auditory evoked potentials. In R.F. Burkard, M. Don, & J.J. Eggermont, Evoked potentials (pp. 482 - 507). PA: Lippincott, Williams & Wilkins.
Moore, D. R. (2006). Auditory processing disorder (APD)-potential contribution of mouse research. Brain research, 1091(1), 200-206.
Moore, D.R., Ferguson, M.A., Halliday, L.F. & Riley, A. (2008). Frequency discrimination in children: Perception, learning and attention. Hearing Research, 238, 147-154.
Ponton, C., Eggermont, J. J., Khosla, D., Kwong, B., & Don, M. (2002). Maturation of human central auditory system activity: Separating auditory evoked potentials by dipole source modeling. Clinical Neurophysiology : Official Journal of the International Federation of Clinical Neurophysiology, 113(3), 407-420.
Semel, E., Wiig, E.H., Secord, W.A. (2004). Clinical evaluation of language fundamentals, fourth edition - screening test (CELF-4 screening test). Toronto, Canada: The Psychological Corporation/A Harcourt Assessment Company.
Stapells, D. (2002). Cortical event-related potentials to auditory stimuli. In J. Katz (Ed.), Handbook of clinical audiology, fifth edition (pp. 378-406). PA: Lippincott, Williams & Wilkins.
Sussman,E., Steinschneider,M., Gumenyuk,V., Grushko, J. & Lawson K. (2008) The maturation of human evoked brain potentials to sounds presented at different stimulus rates. Hearing Research, 236, 61-79
Tallal, P., Miller, S. & Fitch, R. H. (1993). Neurobiological basis of speech: A case for the preeminence of temporal processing. Annals of the New York Academy of Sciences, 682, 27-47.
Ulrich, R. & Miller,J. (2004) Threshold estimations in two alternative forced choice tasks. Perception and psychophysics, 66(3), 517-533.
Wier, CC, Jesteadt, W., Green, DM. (1977). Frequency discrimination as a function of frequency and sensation level. Journal of the Acoustical Society of America, 61, 178-184.
Yost, W. (2007). Fundamentals of hearing (fifth edition). Bingley, UK: Emerald.