
 From the Desk of Gus Mueller
In 1951, astrophysicist Thomas Gold proposed at a national meeting that recently detected radio signals originated from outside of the Milky Way Galaxy. A little far-fetched perhaps? How about this one—in May of 1960 Gold published a paper suggesting that the origins of life on earth were from a pile of waste products accidently dumped by extraterrestrials long ago. And here is another—in the late 1940s he published papers suggesting that there is a mechanical resonator within the cochlea, which could actually cause the ear to produce sounds. Wait. There might be something to that one.
Gus Mueller
While all of Gold’s predictions may well be true, the last one we are quite certain about. The ear does indeed create its own sounds, and we call them otoacoustic emissions or OAEs. They were first described by David Kemp in 1978, clinically-friendly equipment for their measurement became available in the late 1980s, and an OAE CPT code was established in 1995. The measurement of OAEs is now routine in many clinics, but there continues to be new observations, developments and tweaking of the test procedures. A handful of researchers have dedicated their careers to the study of these intriguing ear sounds, and this month’s 20Q author is one of them.
Sumit Dhar, PhD, is Professor at the Roxelyn and Richard Pepper Department of Communication Sciences and Disorders at Northwestern University, where he teaches courses in audiology and applied hearing science. He is actively involved in the operation of Northwestern’s AuD program, and has received several awards for his teaching and mentoring.
As you know from his many publications, his research is primarily focused on the theory and practice of otoacoustic emissions as they relate to cochlear mechanics and auditory behavior. His work currently is funded by the National Institutes of Health and the Hugh Knowles Foundation at Northwestern University. Recently, Sumit teamed up with another frequent AudiologyOnline contributor, Jay Hall PhD, to publish the book Otoacoustic Emissions: Principles to Practice.
As the heading of this 20Q introduction states, this little blurb indeed is originating “From the Desk of Gus Mueller.” That’s rather insignificant, especially when we have 20Q articles like last month—“From the Desk of James Jerger.” But it gets even better. This month’s 20Q is “From the Desk of Raymond Carhart.” I’m not entirely sure of the degree of input Dr. Carhart provided for the present article, but I do know that at Northwestern University, the desk used by Sumit in his office is the one once occupied by the “father of audiology.” Could the desk of Thomas Gold be far away?
Gus Mueller, PhD
Contributing Editor
July 2014
To browse the complete collection of 20Q with Gus Mueller CEU articles, please visit www.audiologyonline.com/20Q
20Q: OAEs - Sound Clinical Tool

Sumitrajit Dhar
1. I’m a little behind the game, and am just starting to learn about OAEs. So first I have to ask—our ears do make sounds, right?
Our ears do most certainly make sounds, yes. I study those sounds for a living! In case you’re curious, they were originally discovered by musicians in the 18th century. As the story goes, a violinist and composer by the name of Guiseppi Tartini first heard additional sounds in his own ears when he played certain combinations of two notes on his violin. Once Tartini convinced himself that these sounds were being created by the ear, he started using them in his compositions. He would include two notes to be played together that he knew would create the sensation of a third note. Other composers in France and Germany started including these tones in their compositions as well. An example of how this might work in the ear is shown in Figure 1. Imagine that if Tartini played the two notes in gray (named f1 and f2, in the figure), the ear would create all the additional red and blue notes in response. We call these distortion product otoacoustic emissions today. It was not until 1978, however, that Professor David Kemp published the first paper describing the recordings of these ear-generated tones in a peer-reviewed publication (Kemp, 1978).
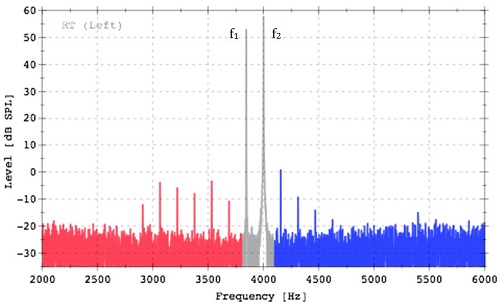
Figure 1. Tartini tones then, distortion product otoacoustic emissions now, recorded from a young healthy ear. The tones in gray were used to stimulate the distortion products in red and blue.
2. What prompted Kemp to even try to record these sounds from his ears?
Kemp was conducting psychoacoustic experiments on his own ears measuring changes in hearing threshold and loudness perception associated with small changes in frequency. Understand, it’s not uncommon for people doing psychoacoustics to want to do something else after a little while. In Kemp’s case, the motivation came from his observations that hearing thresholds exhibited periodic patterns of peaks and valleys, as did loudness estimates, when measured in small increments of frequency. By small increments, I mean really small increments, sometimes as small as a couple of Hertz. Interestingly, the valleys in hearing thresholds (frequencies where hearing appeared to be most sensitive) approximately aligned with peaks in loudness estimates (frequencies where sounds seemed disproportionately louder). Similar periodic fluctuations in hearing thresholds had been reported earlier (Elliott, 1958).
3. I’m not quite sure how fluctuations in hearing thresholds fit into our discussion?
I’m getting to that. These observations reminded Kemp of a prediction made by the British Astrophysicist Thomas Gold. Upon observing the expansive dynamic range of hearing, Gold had postulated that the ear must contain a nonlinear amplifier – an amplifier that provided gain for low inputs to make them audible but became passive to make high inputs tolerable. If this amplifier was built using a feedback mechanism, it could be likely that every once in a while the feedback mechanism would fail to control the amplifier appropriately. Under these circumstances, Gold predicted that the ear would squeal, much like a hearing aid does when it goes into feedback.
4. So these two factors sort of fit together?
Exactly. Kemp connected his observation of the peaks and valleys in behavioral data and Gold’s predictions and hypothesized that the valleys in hearing sensitivity and peaks in loudness estimates could be due to these sounds produced by the ear. That is, the presence of an internal sound source at a given frequency would add to any external tone played leading to hypersensitivity in threshold measures as well as a heightened perception of loudness. Why not put a microphone in the ear canal and see if any sounds come out of the ear, he argued. Indeed they did and today we know them as otoacoustic emissions (OAEs) and use them routinely for a multitude of clinical purposes, including screening hearing in newborns.
5. These emissions—they are generated by the outer hair cells?
Indeed, that appears to be a reasonable guess. It was clear after the earliest publications that OAEs in response to signals of different frequencies were recorded after different amounts of delays – those at high frequencies returned to the ear canal earlier than those at lower frequencies. Greater delays with decreasing frequency were consistent with our knowledge of the tonotopic organization of the cochlea, and served as early indications that OAEs were cochlear phenomenon. The supporting evidence that OAEs were most likely generated by the outer hair cells came from experiments where the outer hair cells were selectively damaged by exposure to noise or specific toxins such as cisplatin. OAEs were diminished or eliminated when outer hair cells were damaged, but not when inner hair cells were damaged (e.g., Davis et al., 2005).
6. You’re losing me here. How do you damage outer hair cells without also damaging inner hair cells?
Good question. The differential vulnerability of outer versus inner hair cells to various toxins is an interesting phenomenon. It does indeed appear to be true that outer hair cells are more vulnerable to damage from noise and other chemical agents such as gentamycin. The cause of this differential vulnerability appears to be the greater metabolic demand in outer hair cells generally and also under conditions of stress, such as noise exposure. This higher metabolic demand appears to make outer hair cells more vulnerable to a variety of toxins and perhaps even aging. In the laboratory, researchers have taken advantage of this differential vulnerability to selectively ablate outer hair cells and identify them as the source of OAEs.
I should also point out that although we are fairly certain that outer hair cells produce OAEs, the exact cellular mechanisms responsible for OAEs are still being examined. Much remains to be learned about the molecular events that have to transpire in the outer hair cells to generate otoacoustic emissions (e.g., Liberman et al., 2004; Verpy et al., 2008) and the mechanical events that are responsible for carrying these signals from deep inside the cochlea out to the ear canal (e.g., He and Ren, 2013; Dong and Olson, 2008). We researchers have ways of ensuring job security.
7. I’m still not quite understanding the relationship between OAEs and auditory thresholds, which are determined by the entire auditory system including inner hair cells, auditory nerve, etc., right?
The answer seems to be in the common link of cochlear resonance. The frequencies at which OAEs tend to spontaneously occur seem to be determined by mechanical characteristics of the whole cochlea that allow signals to bounce back and forth and build on themselves only at certain frequencies. These are the frequencies for which the characteristic frequency (CF) place on the basilar membrane allows full cycle phase accumulation as the signal energy travels between the CF place and the boundary between the cochlea and the middle ear. Now you can imagine that these will be the exact same frequencies where you would record an exceptionally low (good) threshold because the subject would perceive the external tone you play to measure threshold as well as the additional energy created by the reflections within the cochlea. The same principle would lead to these sounds being perceived as louder than those at neighboring frequencies. So, in essence it does not matter that OAEs are linked to outer hair cells and other parts of the auditory anatomy participate in hearing thresholds and loudness perception. It is the fundamental phenomenon of cochlear resonance that drives them all to create the spacing in spontaneous and evoked emissions, thresholds, and other psychoacoustic phenomena like loudness perception.
8. It may take me a while to digest all that. Let’s get practical. Why should I be doing OAEs in my clinic?
The party line is that OAEs are used for screening hearing. Specific applications include newborn hearing screenings, hearing screenings in schools, etc. However, if you think about it a little more deeply, it becomes obvious that one could have perfectly normal OAEs but still have trouble hearing. After all, many structures beyond the outer hair cells, such as inner hair cells, the auditory nerve, etc. have to function appropriately for hearing to be normal. Auditory neuropathy is an example of functional outer hair cells but malfunction further up the neural chain in the auditory pathway.
9. So how should I be thinking about OAEs?
Perhaps a more sophisticated way of thinking about OAEs is to use them as a tool to evaluate the integrity of the auditory periphery up to the outer hair cells. That is to say, the outer and middle ears have to be functional for stimuli to reach the outer hair cells and then also for the OAEs generated in the cochlea to return to the ear canal. Fortunately for us, many common disorders of hearing involve the outer hair cells. So we take advantage of this natural correlation and use OAEs as a surrogate for screening hearing.
10. Someone told me that OAEs are useful for evaluating the efferent nervous system also. True?
Whoever told you that must be reading the literature!. Here is the scoop. The auditory efferent track originates in the cortex and meanders all the way down to the outer hair cells. It is well documented that activating the efferents triggers a cascade of events that ultimately leads to a reduction in outer hair cell gain. The functional relevance of this gain control is still being investigated but it is clear that animals with a strong efferent influence on the outer hair cells are more protected from noise-induced damage to hearing. There is preliminary evidence that the efferent modulation of cochlear gain may aide humans in speech understanding in background noise, localization, among other things. I highly recommend a recent review by Guinan (2010) if you want to get caught up with the current state of this topic quickly.
11. Until I get to that article—you’re saying that OAEs are a good way to study the auditory efferent system?
It turns out that OAEs may be the most viable way to study the auditory efferents in humans. You can stimulate them with noise or tones in the opposite ear and monitor their influence on OAEs in the test ear. The best way to use OAEs for this purpose is not clear at this time, but several very talented research groups are actively engaged. The main questions that need to be sorted out relate to which OAE type should be used, how best to avoid or account for the middle ear muscle reflex, and a variety of other potential confounding variables.
12. OAE type? There is more than one?
Well, I did not have the opportunity to bring this up before but yes there are several ways of thinking about different types of OAEs and OAE-based tests. One practical way to differentiate OAE tests is by CPT codes. In their latest incarnation, there are three codes that range from automated screening without interpretation to a comprehensive evaluation of OAEs at multiple frequencies. This purpose-driven classification does not consider how you measure the OAEs. But the stimulus used to record OAEs (or not) allows another way to classify them.
13. Sounds like more than one type of stimulus can be used?
Oh yes! In classifying OAEs using stimulus type, you could have spontaneous otoacoustic emissions (SOAEs) where OAEs are recorded without stimulation or with a brief synchronizing stimulus. Even when a brief synchronizing stimulus is used, the actual OAEs are measured much after the stimulus has been turned off. The other general category would be of evoked OAEs and here you have three choices:
- A brief click or tone burst stimuli to generate transient-evoked otoacoustic emissions (TEOAEs)
- Two-tones played simultaneously to generate distortion product otoacoustic emissions (DPOAEs)
- A single tone to generate stimulus frequency otoacoustic emissions (SFOAEs)
14. How are the OAE findings typically recorded in the clinic?
There are different ways to record and display OAEs, with the format often driven by the clinical use. For example, if you are using OAEs for screening purposes, the OAE screener might do most of the work for you and simply display a pass or fail verdict. Some screeners go a little further and show OAE (DPOAE or TEOAE) level, noise floor level, signal-to-noise ratio, and a pass/fail verdict independently for different frequency bands. Figure 2 is an example of such a screening result. The more than adequate signal-to-noise ratio in the last data column in the figure would be interpreted as “pass” either by the machine or the operator.
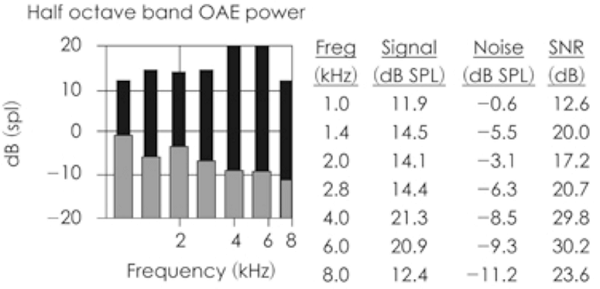
Figure 2. Typical result from OAE screening test. Adequate signal-to-noise ratio is observed in all frequency bands in this case.
At the other end of the spectrum we have the results of a diagnostic OAE test. Most commonly DPOAEs are used for this purpose and DPOAE level (amplitude in dB SPL) is plotted against the frequency of one of the stimulus tones, typically f2. The noise floor is also plotted on the same graph to give the clinician some metric of determining confidence in the data. These plots are popularly called DP-grams and an example is displayed in Figure 3.
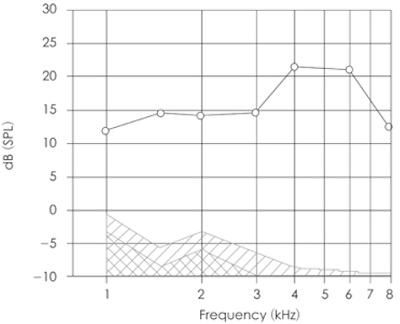
Figure 3. An example of a DP-gram. DPOAE levels at each frequency are presented using circles. The hatched area represents the noise floor. Adequate signal-to-noise ratio is recorded at all frequencies indicating a healthy ear.
15. I don’t think I had ever heard of SFOAEs before. What exactly are they?
SFOAEs are recordable at the exact same frequency of the stimulus tone. You could essentially plot an SFOAE-gram much like we plotted a DP-gram above, displaying SFOAE level as a function of frequency. To be able to do this, however, you have to be able to separate the emission from the stimulus. Recall that both are at the same frequency. This makes it difficult to reliably extract the SFOAE from the ear canal recording. Again, clever people are working on perfecting techniques to record SFOAEs and evaluating their clinical utility. We should see them being used in the clinic for specific purposes in the not so distant future. I wonder if that will mean redoing CPT codes again?
16. Speaking of CPT codes, let’s get back to the clinic. Can I use OAEs to predict hearing thresholds?
Aha! The favorite pastime of audiologists – to use any and all new procedures to predict hearing thresholds. In many cases we are probably better off to stick with behavioral threshold estimation, but one can certainly see the benefit of having an objective non-invasive tool for gathering threshold information in certain populations and situations. The attempts to predict hearing thresholds from DPOAE levels measured in response to fixed-level stimuli varied in frequency were not very productive (see Shaffer & Dhar, 2006 for a review). The results when using TEOAEs are not that promising either (Mertes & Goodman, 2013). However, subsequent efforts at predicting hearing thresholds using DPOAE input/output functions have shown greater promise (Neely et al., 2009). The trick appears to be in how the input/output function is processed before a threshold estimation is made.
17. Not sure what you mean by that?
Various transformations and computational algorithms have been attempted, but the Neely et al. (2009) method appears to be as successful as any. In this method, a DPOAE input/output function is first obtained at a specific frequency by recording the DPOAE level for various levels of the stimulus tones (left panel of Figure 4). The DPOAE levels are then converted to their corresponding pressure (in µPa) values as shown in the right panel of Figure 4. Finally three or more points with acceptable signal-to-noise ratio (say 6 dB) are used to draw a linear fit line as shown by the diagonal red dotted line in Figure 4, right panel. The stimulus level where the projected DPOAE amplitude is equal to 0 µPa, marked by the vertical red dotted arrow, appears to be well correlated with behavioral thresholds. Typically, DPOAE thresholds measured in this fashion show an offset from behavioral thresholds much like ABR thresholds are often 15 to 20 dB higher than behavioral thresholds. Reading this description might make you think that the process is too cumbersome and time consuming. However, with the correct software implementation the whole process could be automated and a predicted threshold produced automatically. I hope something like this will be incorporated into clinical OAE systems soon.
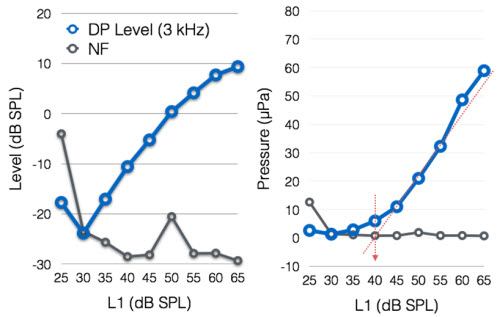
Figure 4. DPOAE input/output function in dB SPL (left) and µPa (right) used to predict a DPOAE threshold.
18. So we are not stuck to saying OAEs present or absent?
Not at all! In fact the various clinical uses of OAEs are only now starting to become apparent. However, it must be acknowledged that OAEs play an important role as a screening tool. They have been central in the expansion of newborn hearing screening programs and continue to be powerful tools in making dichotomous decisions about presence or absence of auditory pathology. That OAEs can effectively segregate ears with hearing loss from those without has been apparent for over a decade (e.g., Gorga et al., 1997). However, the techniques for making such decisions are still being refined (Reuven et al., 2013). There are other innovative clinical uses of OAEs emerging. OAE levels may be predictive of one’s vulnerability to noise induced changes in auditory function. They are also useful in evaluating the function of the auditory efferent nervous system. I can dive into more on any of these issues if you like.
19. I have plenty of questions that still need answering, but I really could use a quick summary first. Could you simply tell me what is “safe to assume” if OAEs are present or absent?
Sure. Recognize that there always can be exceptions to basic rules, but here are some pretty safe assumptions provided you have done due diligence to make sure there is no equipment malfunction or operator error.
If OAEs are present, you can be fairly certain that one or more of the following is true:
- The patient has no major middle ear pathology. There are reports of recordable OAEs with small perforations or mild pressure deviations from atmospheric pressure. However, it is improbable that OAEs will be recordable in full-blown cases of otitis media.
- The patient has a functional complement of outer hair cells.
- Because outer hair cell pathology is highly correlated with most common forms of hearing loss (e.g., noise induced or age related), it is safe to assume that the patient’s hearing is most likely within the normal range.
- Using the same logic as above it is also probably safe to assume that the patient will demonstrate normal frequency discrimination or even speech perception ability in noise.
- However, present OAEs do not guarantee normal function of the entire auditory system. For example, auditory brainstem responses would be necessary to garner confidence that inner hair cell and auditory nerve function is normal in a patient.
If OAEs are absent, you can be fairly certain that one or more of the following is true:
- The patient has degradation of outer hair cell function.
- The patient may have a middle ear condition preventing the forward transmission of stimuli and the reverse transmission of the OAEs.
- The patient most likely has hearing thresholds worse than 20 dB HL.
While it is fun to give you bullet points to create a decision tree, I would be remiss if I did not point out that conditions such as auditory neuropathy could yield perfectly normal OAEs and the disorder would not be diagnosed without the use of other tools that specifically target other parts of the auditory system. So the bottom line is that OAEs are an important part of an audiologist’s test battery but cannot be used as the one test for all purposes. This of course is true for all audiologic tests.
20. Thanks, that was very helpful. I have a ton of questions left, but I see that I’ve reached my quota for today. Can we continue this next month?
I’m ready when you are. Sounds like fun!
References
Davis, B., Qiu, W., & Hamernik, R. P. (2005). Sensitivity of distortion product otoacoustic emissions in noise-exposed chinchillas. Journal of the American Academy of Audiolgy, 16, 69-78.
Dong, W., & Olson, E. S.. (2008). Supporting evidence for reverse cochlear traveling waves. Journal of the Acoustical Society of America, 123, 222-40.
Elliott, E. (1958). A ripple effect in the audiogram. Nature, 181(4615), 1076.
Gorga, M. P., Neely, S. T., Ohlrich, B., Hoover, B., Redner, J., & Peters, J. (1997). From laboratory to clinic: a large scale study of distortion product otoacoustic emissions in ears with normal hearing and ears with hearing loss. Ear Hear, 18(6), 440-455.
Guinan, J. J., Jr. (2010). Cochlear efferent innervation and function. Curr Opin Otolaryngol Head Neck Surg, 18(5), 447-453. doi: 10.1097/MOO.0b013e32833e05d6
He, W., Ren, T.. (2013). Basilar membrane vibration is not involved in the reverse propagation of otoacoustic emissions. Scientific Report, 3,1874.
Kemp, D. T. (1978). Stimulated acoustic emissions from within the human auditory system. J Acoust Soc Am, 64(5), 1386-1391.
Liberman, M. C., Zuo, J., Guinan, J. J.. (2004). Otoacoustic emissions without somatic motility: Can stereocilia mechanics drive the mammalian cochlea? Journal of the Acoustical Society of America, 116, 1649-1655.
Mertes, I. B., & Goodman, S. S. (2013). Short-latency transient-evoked otoacoustic emissions as predictors of hearing status and thresholds. J Acoust Soc Am, 134(3), 2127-2135. doi: 10.1121/1.4817831
Neely, S. T., Johnson, T. A., Kopun, J., Dierking, D. M., & Gorga, M. P. (2009). Distortion-product otoacoustic emission input/output characteristics in normal-hearing and hearing-impaired human ears. J Acoust Soc Am, 126(2), 728-738. doi: 10.1121/1.3158859
Reuven, M. L., Neely, S. T., Kopun, J. G., Rasetshwane, D. M., Allen, J. B., Tan, H., & Gorga, M. P. (2013). Effect of calibration method on distortion-product otoacoustic emission measurements at and around 4 kHz. Ear Hear, 34(6), 779-788. doi: 10.1097/AUD.0b013e3182994f15
Shaffer, L. A., & Dhar, S. (2006). DPOAE component estimates and their relationship to hearing thresholds. J Am Acad Audiol, 17(4), 279-292.
Verpy, E., Weil, D., Leibovici, M., Goodyear, R. J., Hamard, G., Houdon, C.,...Petit, C.. (2008). Stereocilin-deficient mice reveal the origin of cochlear waveform distortions. Nature, 456, 255-8.
Citation
Dhar, S. (2014, July). 20Q: OAEs - sound clinical tool. AudiologyOnline, Article 12801. Retrieved from: https://www.audiologyonline.com