Background
Providing effective hearing aid fittings for high-frequency hearing loss is a challenging and important clinical task. The importance of this task becomes even more apparent when considering the development of speech and language skills in the hearing-impaired pediatric population. Current research suggests that children require audibility of a broad bandwidth of speech for optimal access to high-frequency speech cues and that hearing loss can impede normal development of affricate and fricative production (Moeller et al., 2007; Stelmachowicz, Pittman, Hoover, Lewis, & Moeller, 2004). Despite recent successful attempts by hearing aid manufacturers to decrease acoustic feedback and improve amplification of the high frequencies, gain and/or feedback constraints remain a factor in hearing aid fitting, particularly with significant high-frequency hearing loss. Current research suggests that frequency lowering hearing aid technology can help amplify high-frequency sounds (e.g., /s/, /∫/) for listeners with high-frequency hearing loss (Auriemmo et al., 2009; Glista et al., 2009; Kuk, Keenan, Korhonen, & Lau, in press; Wolfe, Caraway, John, Schafer, & Nyffeler, 2009). Such technology includes digital signal processing algorithms such as frequency transposition and frequency compression. Given the numerous frequency lowering hearing aids currently available on the market, providing information to clinicians on how to fit and fine-tune this type of technology is increasingly important. This article will focus on electroacoustic verification considerations for fitting frequency lowering technologies. We will present a case example of verification using one type of frequency lowering technology: multichannel, nonlinear frequency compression signal processing.
Understanding Frequency Compression
Phonak's proprietary frequency compression technology, SoundRecover, is currently available in various hearing aids from the manufacturer. This type of signal processing compresses the high-frequency bandwidth of the hearing aid signal into a region of usable hearing for a given listener (Simpson, Hersbach, & McDermott, 2005). SoundRecover uses an adjustable cut-off frequency, combined with a frequency compression ratio. Therefore, the frequency at which the compression starts is defined by the "cut-off" value and the amount of compression applied is defined by a "ratio" value. The hearing aid signal present below the cut-off value remains uncompressed in the frequency domain. The cut-off and ratio values are combined within Phonak iPFG software, to define one SoundRecover setting. A pre-fitting algorithm for SoundRecover has been implemented for use with children fitted with DSL v5.0, which differs from that used for adults fittings. The clinician can manually adjust this setting within manual fine-tuning. Fine-tuning can either strengthen or weaken the setting. In theory, a clinician can strengthen SoundRecover by providing frequency lowering over a broader band (by using a lower cutoff frequency), or by compressing to a greater degree (by using a higher compression ratio). In actual use, however, the two controls are combined into one, with each adjustment resulting in either stronger or weaker SoundRecover settings via changes to the cutoff frequency and/or the compression ratio. In our recent work with this new technology (Glista et al., 2009), we have had some experience using verification measures for fitting and/or fine-tuning with frequency compression. Because the processor adjusts the fitting in the frequency domain, rather than the amplitude domain, getting oriented to new tests and test results can feel a bit daunting for the professional. Therefore, we aim to provide you with some orientation and examples of how to verify frequency compression (i.e., SoundRecover) fittings.
Modifying Clinical Verification Procedures
With any hearing aid fitting, routine clinical verification procedures are necessary to ensure that appropriate gain and output are provided across frequencies (AAA, 2003; Aazh & Moore, 2007; Hawkins & Cook, 2003). Frequency compression hearing aids are no different; however, additional steps may be needed to verify the amount of frequency lowering that is present in the fitting. Electroacoustic measurements of hearing aid(s) with frequency lowering can appear unusual, especially in the high frequencies, when compared to measurements performed without frequency lowering. This article will consider the advantages and limitations of various electroacoustic test signals using a case study, including a range of possible verification signals: Speech, pure tones, live speech production and frequency-specific speech bands. We will summarize with a recommended clinical protocol for verifying frequency lowering hearing aids, including a basic listening check for all fittings. The verification examples included in this article were performed on the Audioscan Verifit® using the Phonak Naida IX UP hearing instrument. In some examples, test signals unique to the Verifit were used. In these cases, we have tried to provide generic approaches as well.
Case Example
Our case example is a 14-year-old child with a sloping, high-frequency sensorineural hearing loss. Figure 1 displays the pure-tone, air-conduction hearing thresholds for all octaves and inter-octave frequencies ranging from 250 to 8000 Hz in the right ear. Hearing threshold values of 120 dB HL are included where a response could not be measured using conventional audiometry. Although not shown, hearing thresholds in the left ear were similar, and the fitting was binaural. For simplicity, we will discuss the details of the right ear only.
Figure 1. Pure-tone air-conduction hearing thresholds (dB HL) for all octave and inter-octave frequencies ranging from 250 to 8000 Hz for the right ear.
Hearing thresholds in this case were measured using a personal earmold coupled to an ER3 insert earphone. The real-ear-to-coupler difference (RECD) values were also measured using the personal earmold.
This child's thresholds and other assessment information were entered into the Phonak IPFG standalone software (this can also be accomplished by using NOAH software), as well as into the Audioscan Verifit® hearing aid analyzer. The same DSL fitting parameters were selected for both the software and the hearing aid analyzer (e.g., instrument, age, transducer, and RECD values); DSL v5.0 child targets were generated in both systems (Bagatto et al., 2005). The default SoundRecover setting generated in iPFG for this specific case was 2200 Hz (cut-off) and 4:1 (compression ratio). We connected the hearing aid to a coupler and made simulated-real-ear measurements (S-REM) for the purposes of this article. Alternatively, clinicians can complete the same measurements with the hearing aid positioned on the listener's ear in the case of real-ear measurements (REM).
Verifying with Speech Signals
When fitting and fine-tuning, we routinely measure the aided long-term average speech spectrum (LTASS) at various levels. In frequency compression fittings, we perform multi-level speech verification with and/or without SoundRecover enabled to: 1) ensure that the hearing aid meets targets; 2) verify that frequency compression is enabled; and 3) ensure that an appropriate amount of frequency compression has been applied to the fitting. Figure 2 illustrates a first step in this process. The hearing aid has been measured twice using speech at an input level of 65 dB SPL: once with SoundRecover and once without. These measures provide a visual display of the overall effect of SoundRecover on the output bandwidth. Without SoundRecover, the fitting meets targets only to 2000 Hz, falling significantly below target (and thresholds) in the high frequencies. The measured response with SoundRecover active rolls off steeply at about 3000 Hz, due to the active frequency compression signal processing. This rather large change in the high frequency response is normal for fittings that employ SoundRecover, providing a clear verification that the SoundRecover feature is active in the device. We note that the specific amount of frequency compression is difficult to judge from this type of test: it looks as though a high-cut filter has been applied to the fitting. Measurement results for the pink curve display that frequency lowering has occurred; however, this may not be immediately apparent. For this reason, we typically include additional verification procedures, discussed below.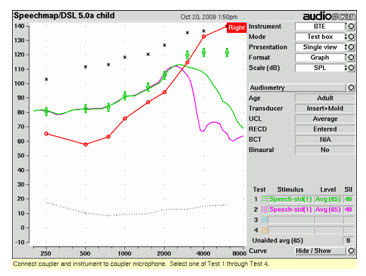
Figure 2. An Audioscan Verifit screen capture of aided verification results the LTASS for average level speech without SoundRecover (test 1/green curve) and with SoundRecover (test 2/pink curve).
We typically evaluate the fit to targets for soft (i.e., 55 dB SPL), average (i.e., 65 dB SPL), and loud (i.e., 75 dB SPL) speech signals. In Figure 3, we see that the fit-to-targets for soft, average, and loud speech is achieved from 250 through 2000 Hz. SoundRecover is applied from 2200 Hz and above, resulting in a frequency-compressed band from 2200 to approximately 4000 Hz. We evaluate fit-to-targets only within the passband of the device when SoundRecover is active. For this example, we would evaluate fit-to-targets up to and including the compressed and lowered region; this compressed region rolls off just before 4000 Hz. The measurement becomes invalid beyond the upper bandwidth of the compressed signal where the hearing aid response rolls off. This is because gain is no longer applied to the region where the input signal has been compressed to a lower output signal. In this fitting, the hearing aid response is under targets at 3000 and 4000 Hz; this is true for the conventional curve as well as the frequency compressed curved and can be attributed to gain limits of the chosen hearing aid.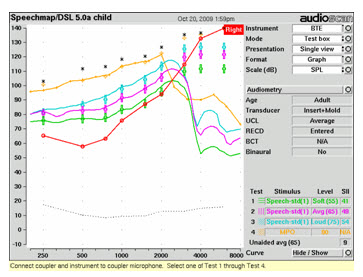
Figure 3. An Audioscan Verifit screen capture of aided verification results for the Naida IX UP hearing instrument fitted to DSL v5.0 targets, with SoundRecover active. Measurements are displayed for the LTASS for soft (test 1/green curve), average (test 2/pink curve) and loud speech signals (test 3/blue curve), as well as for the MPO (test 4/yellow curve).
Verifying with Pure Tones (important for MPO tests)
When SoundRecover is active, interpretation of pure tone measurements become invalid directly above the cut-off frequency. Examples of these measures include maximum power output (MPO) measurements as well as verification using swept tone signals. To evaluate fit-to targets for the MPO, a narrowband signal at 90 dB SPL is used (Figure 3: test 4/yellow curve). Here, the MPO can only be interpreted below the SoundRecover cut-off value (i.e., 2200 Hz) as it drops off sharply in the high frequencies where frequency compression is active. For this example, we can interpret the fit to MPO targets only to 2000 Hz. If the clinician would like to evaluate the MPO beyond the cut-off value, s/he can disable the SoundRecover feature within manual fine-tuning and re-measure the MPO. After the MPO has been set to an appropriate value, SoundRecover can be re-enabled.
Figure 4 displays electroacoustic measures completed using a swept tone signal at a 65 dB SPL presentation level, without and with SoundRecover active. In this example, the hearing aid response drops off at 2000 Hz, which is consistent with the cut-off frequency used (i.e., 2200 Hz). For this reason, swept tone signals are NOT recommended when verifying hearing aids with SoundRecover, as interpretation of the region where the frequency compression is active is not possible; nor can the effects of SoundRecover on the speech signal itself be evaluated.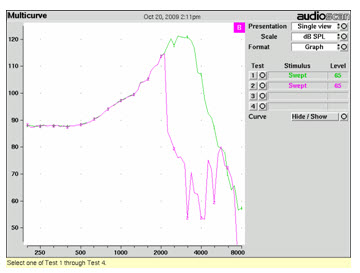
Figure 4. Aided response for a swept tone signal presented at 65 dB SPL without SoundRecover (test 1/green curve) and with SoundRecover active (test 2/pink curve).
Verifying with Speech-weighted Noise
Figure 5 displays electroacoustic measures of pink noise without and with SoundRecover active. When SoundRecover is active, broadband measures with speech-weighted noise are valid and reflect the narrowed output bandwidth associated with frequency compression processing. Therefore, speech-weighted noise can be used to show the effects of SoundRecover and to evaluate fit-to-targets in the absence of speech stimuli. However, considering the chosen verification system, it is possible and preferable to verify using speech signals. In this case, we would not choose to use the pink noise test signal for clinical applications - we have included it as an example to illustrate the effects of SoundRecover on this signal.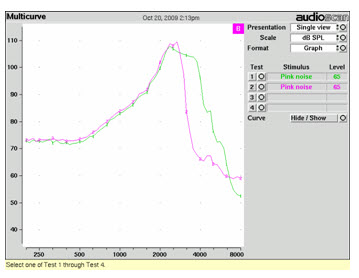
Figure 5. Aided electroacoustic measures of pink noise presented at 65 dB SPL without SoundRecover (test 1/green curve) and with SoundRecover active (test 2/pink curve).
Advanced Speech Measures: Live Speech
Measures of live voice productions of /s/ and /∫/ have previously been recommended to assist in the evaluation of the audibility and/or separation of speech sounds for a given hearing aid fitting (Scollie, Glista, Bagatto, & Seewald, 2007). Clinicians can complete such measures using the Audioscan Verifit® by producing a sustained phoneme into the microphone(s) of the connected hearing aid for S-REM. These measurements can be done without and with SoundRecover active to illustrate the effects of SoundRecover, and to evaluate the approximate audibility of different phonemes of interest. Clinicians should be aware that conclusions made with respect to the audibility of the phonemes (i.e., whether measured phonemes lie above the hearing thresholds) will directly reflect both the intensity and the pitch of the speaker's voice. For this reason, the speaker should use a consistent and moderate vocal effort and level when producing these phonemes. The live speech curve can be "frozen" when an appropriate level has been sustained after a few seconds. Using this informal test, we see greater audibility of both /s/ and /∫/ as a result of activating SoundRecover (Figure 6). We suggest that these measures be used together with a calibrated frequency-specific speech measure (to be discussed in the following section). Alternatively, clinicians could choose to use a calibrated frequency-specific speech measure instead of this live voice technique.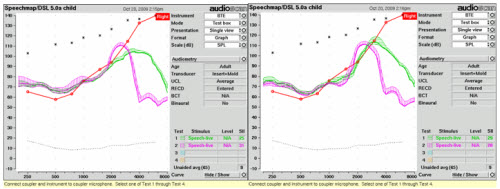
Figure 6. Live voice productions of /s/ (left screen capture) and /∫/ (right screen capture), without SoundRecover (test 1/green curve) and with SoundRecover active (test 2/pink curve).
Measures of the amount of overlap for /s/ and /∫/ can advise whether the listener is likely to experience sound confusions for a given SoundRecover setting (Figure 7). In unaided speech, /∫/ has a frication band that is broader in bandwidth and lower in frequency than the frication noise band of /s/. In this case example, the bandwidth of the /∫/ remains both broader and lower than that of the /s/ sound with SoundRecover active. This may provide cues needed to differentiate between the two sounds. However, the SoundRecover fitting also provides a large amount of overlap between /s/ and /∫/. In general, when a SoundRecover setting is made stronger, /s/ and /∫/ have a greater amount of overlap and will become more similar in appearance. Too much overlap may cause confusions in perceiving a difference between the high-frequency speech sounds for the listener. Monitoring the listener's ability to discriminate between these two sounds may be important; if they cannot, a milder SoundRecover setting may be indicated. Behavioral measures of aided speech discrimination or recognition (to determine sound confusions) can assist the clinician in the fitting process. Further research in this area will help determine the optimal amount of separation needed between /s/ and /∫/.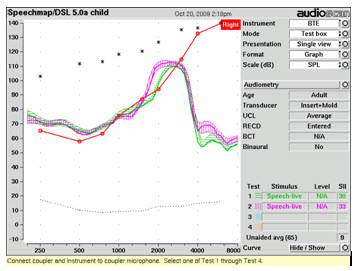
Figure 7. Live voice productions of /s/ (test 1/green curve) and /∫/ (test 2/pink curve) with SoundRecover active.
Advanced Speech Measures: Frequency-specific Speech Bands
A new verification option available in the Audioscan Verifit® uses modified speech stimuli comprised of bands of high-frequency speech energy at specific center frequencies: 3150, 4000, 5000, and 6300 Hz. Figure 8 provides an illustrative example of this frequency lowering verification test. Specifically, the mid-frequency region of the speech test is notched out, allowing for visual representation of the high-frequency speech band, while the low-frequency region remains unaltered. The purpose of the notched "empty area" is to allow the lowered speech band to be visible, rather than mixing it with the energy that would otherwise be present in that band.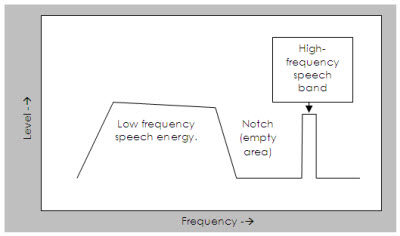
Figure 8. Illustration of the Audioscan Verifit® Frequency Lowering Test.
This modified verification procedure can provide useful information regarding the effects of frequency lowering and high-frequency sound confusions. Without SoundRecover, the speech band should occur at the nominal frequency; with SoundRecover active, the band will appear at a lower frequency. The difference between the two provides a direct measure of how much frequency lowering is provided by the hearing aid. Figure 9 illustrates the effects of SoundRecover for the 4000 Hz speech band (left pane) and the 6300 Hz band (right pane). The left pane shows that a 4000 Hz speech band is lowered to about 2500 Hz, while the 6300 Hz speech band is lowered to about 3000 Hz. Looking at the SPLogram, SoundRecover would likely provide some audibility of speech at 4000 Hz for this listener, which would not have been available without SoundRecover. However, a minimal amount of audibility for the 6300 Hz speech band has been provided even though it has been shifted to a significantly lower frequency. This 6300 Hz speech band may or may not be audible to this listener given that it the response is peaking at the hearing threshold line. The application of a more aggressive SoundRecover setting may be warranted if the listener reports little benefit related to audibility of high-frequency sounds; however, it is recommended that further adjustments be made in absence of the introduction of speech sound confusions.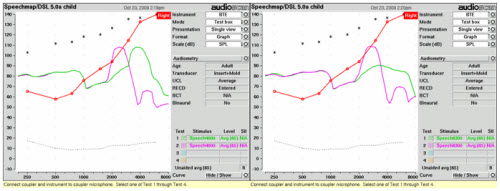
Figure 9. Measure of the 4000 Hz (left) and 6300 Hz (right) speech bands presented at a 65 dB SPL level without SoundRecover (test 1/green curve) and with SoundRecover active (test 2/pink curve).
When compared to the measurements using live speech stimuli, the 4000 Hz band and 6300 Hz bands closely approximate the center frequencies for /∫/ and /s/ respectively (Figure 10). In this example, the peak of the 6300 Hz band is occurring at approximately the same frequency as the peak of a live production of /s/. Therefore, the 6300 Hz speech band may be a reasonable (and calibrated) substitute for a live /s/. The 4000 Hz speech band lies in the center of the live voice /∫/. However, the bandwidth and morphology of the 4000 Hz speech band differs from that of the live production of /∫/, making it a less direct substitute. In summary, the live voice /∫/ has the advantage of a realistic bandwidth of frication, while the 4000 Hz speech band has the advantage of calibration. At this point in time, we do not know which measure's advantage is most important, and are therefore continuing to administer both measures. In practice, we see the effects of SoundRecover most directly when choosing any of these measures (speech bands or live speech), measured with SoundRecover activated and de-activated, and comparing the two.
In general, the frequency-specific speech bands can serve as a calibrated measure of a band of high-frequency energy that can be compared to specific regions of speech sounds. The test is controlled, repeatable and within a running speech context. Further information on verifying SoundRecover using the latest Audioscan Verifit® tests can be found at the following website: www.naida.phonak.com.
Listening Check
When SoundRecover is active, the sound quality of the amplified speech may be different than with SoundRecover de-activated, for reasons including:
a) High-frequency speech sounds have been lowered in frequency, causing a change in the perceived pitch. This can result is speech having a lisping quality, more noticeable with stronger SoundRecover settings. In general, settings that result in no distinction between /s/ and /∫/ sounds should be avoided. Many settings will, however, make /s/ and /∫/ sound unusual but still distinguishable.
b) High-frequency speech sounds may have a more piercing sound quality with SoundRecover active. This may be unavoidable with some settings and may or may not be perceived by the hearing impaired listener.
c) Vowels and/or the vocal tone of speech can be altered with SoundRecover. Vowel sounds should always remain clearly identifiable with SoundRecover active; confusions among vowels sounds should be avoided.
d) Alterations in sound quality are more likely to occur when listening to high-pitched speech. Female and child speech passages are available in many hearing aid test boxes, which can assist the clinician during the verification process.
Normal hearing listeners will readily perceive these sound quality changes. Some hearing impaired listeners will be able to perceive sound quality differences due to frequency lowering and others will not. For young children, the fitter's evaluation of sound quality may have to serve as a surrogate for the child's evaluation until such time that the child's perceptions or opinions can be evaluated. When adverse sound quality effects are present in a fitting, the clinician can adjust the SoundRecover setting to make it weaker. The goal of each fitting should be to provide benefit in high-frequency speech perception, while minimizing negative sound quality effects.
Suggested Clinical Protocol for Verification of Frequency Lowering Hearing Aids
The following protocol has been developed using hearing aids with multichannel, nonlinear frequency compression. Various parts of the protocol may be applied to other types of frequency lowering devices; however, technology related modifications to the protocol will be needed. Furthermore, this protocol does not consider the value of a period of acclimatization when fitting frequency lowering hearing aids; this may be of importance for some listeners.
- Verify the shape and gain of the hearing aid by fitting the aided long-term average speech spectrum to targets. Begin by using the default frequency lowering setting provided in the manufacturer specific software; adjustments to increase or decrease the strength of the setting can be completed after considering further electroacoustic measurement results, subjective feedback, and/or real world performance of the fitting.
- Verify the maximum output of the hearing aid using the MPO test, for example. Results above the cut-off frequency, in the case of frequency compression hearing aids, should not be interpreted.
- Use the frequency-specific speech band tests in the Audioscan Verifit® to determine if high-frequency regions of speech have been made audible with frequency lowering. Specifically, the 6300 Hz band can be used to judge whether an /s/ sound will be audible for a given fitting.
- Perform a listening check prior to completing a fitting with frequency lowering. Once an appropriate fitting has developed, listener perceived comments can help guide the fitting process. If subjective feedback indicates difficulty with speech sound distinctions (especially /s/ and /∫/), frequency-specific speech bands can assist clinicians with fine-tuning to provide less frequency lowering. Finetuning to provide less frequency lowering may result in the loss of some audibility of high-frequency sounds; maintenance of some audibility of high-frequency sounds is desirable in many cases. In the case example discussed in this article, we maintained audibility of signals to 4000 Hz, but a significant increase in audibility for the 6300 Hz signal was not possible.
At this point, many fittings will be complete. Sometimes, additional measures are useful for troubleshooting:
- If a particular setting does not make the high-frequency speech bands audible, repeated tests at fine-tuned settings may assist clinicians in discovering a setting that provides greater audibility for the listener. Depending on the severity of the hearing loss, it may not be possible to make all of the speech bands audible for the listener.
- Live voice productions of /s/ and /∫/ may have some value when evaluating specific level and frequency location of these phonemes. Specifically, if confusion between /s/ and /∫/ is a concern, measuring these phonemes carefully may help in evaluating if too much frequency compression has been applied.
In summary, simple modifications to routine clinical verification procedures can help guide frequency lowering hearing aid fittings. The recommended procedures presented above can assist clinicians when fitting and/or fine-tuning such devices.
Acknowledgments
Special thanks to Bill Cole and Jacob Sulkers for their contributions to the article. This work has in part been supported by the Canadian Institutes of Health Research and Phonak AG.
References
American Academy of Audiology. (2003). Pediatric amplification protocol [Electronic Version]. Retrieved October 26, 2009 from www.audiology.org
Aazh, H., & Moore, B. C. (2007). The value of routine real ear measurement of the gain of digital hearing aids. Journal of the American Academy of Audiology, 18(8), 653-664.
Auriemmo, J., Kuk, F., Lau, C., Marshall, S., Thiele, N., Pikora, M., et al. (2009). Effect of linear frequency transposition on speech recognition and production of school-age children. Journal of the American Academy of Audiology, 20(5), 289-305.
Bagatto, M., Moodie, S., Scollie, S., Seewald, R., Moodie, S., Pumford, J., et al. (2005). Clinical protocols for hearing instrument fitting in the desired sensation level method. Trends in Amplification, 9(4), 199-226.
Glista, D., Scollie, S., Bagatto, M., Seewald, R., Parsa, V., & Johnson, A. (2009). Evaluation of nonlinear frequency compression: Clinical outcomes. International Journal of Audiology, 48(9), 632-644.
Hawkins, D. B., & Cook, J. A. (2003). Hearing aid software predictive gain values: How accurate are they? The Hearing Journal, 56, 26-34.
Kuk, F., Keenan, D., Korhonen, P., & Lau, C. (in press). Efficacy of linear frequency transposition on consonant identification in quiet and in noise. Journal of the American Academy of Audiology.
Moeller, M. P., Hoover, B., Putman, C., Arbataitis, K., Bohnenkamp, G., Peterson, B., et al. (2007). Vocalizations of infants with hearing loss compared with infants with normal hearing: Part I - Phonetic development. Ear & Hearing, 28(5), 605-627.
Scollie, S., Glista, D., Bagatto, M., & Seewald, R. (2007, December). Multichannel nonlinear frequency compression: A new technology for children with hearing loss. Paper presented at the A Sound Foundation Through Early Amplification, Chicago, IL.
Simpson, A., Hersbach, A. A., & McDermott, H. J. (2005). Improvements in speech perception with an experimental nonlinear frequency-compression hearing device. International Journal of Audiology, 44(5), 281-292.
Stelmachowicz, P. G., Pittman, A. L., Hoover, B. M., Lewis, D. E., & Moeller, M. P. (2004). The importance of high-frequency audibility in the speech and language development of children with hearing loss. [Review] [26 refs]. Archives of Otolaryngology ead & Neck Surgery, 130(5), 556-562.
Wolfe, J., Caraway, T., John, A., Schafer, E. C., & Nyffeler, M. (2009). Study suggests that non-linear frequency compression helps children with moderate loss. The Hearing Journal, 62 (9), 32-37.