
There are an estimated 31 million persons in the United States who experience some form of hearing loss, yet only 7.3 million opt to use hearing aids (Kochkin, 2005). The market penetration for hearing aids—calculated as the number of hearing users divided by the number of persons with a hearing loss—is about 23.6% (7.3/31). In other words, for roughly every four patients that enters a practice needing hearing aids, only one will purchase them.
In 1998, Lee and Lotz analyzed the hearing aid industry and found several factors that contribute to poor market penetration. First, no hearing aid can correct hearing loss completely. In other words, hearing aids cannot repair deficits of the ear, but they are able to reduce the loss of hearing. If hearing aids—like corrective lenses—could better correct deficits of the ear, then more people would be willing to use them. This has been and continues to be a major challenge for manufacturers and researchers. Second, there is an acclimatization period for new users of hearing aids. In some cases, this period of adjustment might take longer than the patient is willing to endure and, in other cases, the hearing aid is inappropriately fit for the loss. In any case, the hearing aid may end up in the proverbial drawer, often to the regret of the potential user, the family, and close friends. Third, hearing aid use is often stigmatized for use with old people, for not-so-smart people, or for people who are out-of-touch with their environments. Perceptions of stigmatism often result in a denial of hearing problems (Hetu, 1996; Kochkin, 1993) and a lack of adherence to professional recommendations to use hearing aids (Garstecki & Erler, 1998; Surr & Hawkins, 1988).
To lessen the impact of these factors, it might seem reasonable to expand the hearing aid market by simply reducing prices. Price represents one attribute that consumers evaluate when purchasing a product or service. In fact, price plays one of two roles in the purchase decision process for consumers. First, consumers might use price as a measure of product quality. That is, when quality is associated with higher prices, price can become an incentive to buy. Examples of this type of practice include Neiman Marcus and Ferrari. Alternatively, consumers might buy more of a product at lower prices and less at higher prices, all other things being equal. Warehouse/retail outlets such as Costco and Sam's Club are examples of this type of practice. The purpose of this paper is to introduce the concept of price elasticity of demand to the reader as a way to understand the purchasing behavior of consumers and its application to hearing aid pricing.
Elasticity and Its Characteristics
Price elasticity of demand (ε) measures the sensitivity of consumer purchasing behavior when price is raised (or lowered) by some percentage and the corresponding percentage decrease (or increase) in quantity demanded. It is important to note that price and quantity are inversely related, as shown in Figure 1.
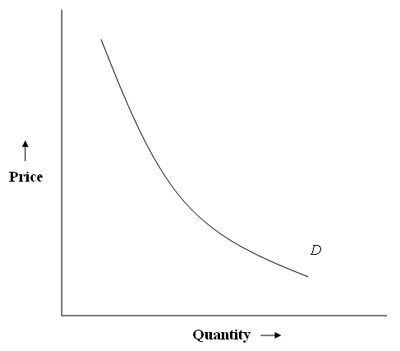
Figure 1. The relationship between price and quantity for a hypothetical demand function (D).
Elasticity is calculated as:
where ε is the elasticity, %ΔQx is the percentage change in the quantity demand of a product or service at a given point, and %ΔPx is the percentage change in price at the same point. As a general rule, when the absolute value of ε> 1, the demand curve is elastic, suggesting that consumers are more responsive to price changes. On the other hand, when the absolute value of ε inelastic, indicating that consumers are less responsive to price changes. An example of how this equation can be used in hearing aid pricing is given in the next section.
Figures 2 and 3 are examples of price elasticity of demand functions for a hypothetical audiology practice. Point A, in Figure 2, shows that this business is dispensing 150 hearing aids annually and yielding a total revenue of $400,000. The company wants to increase revenue by $25,000—resulting in total revenue of $425,000 (point B)—by reducing the number of units sold by 25 to 125 units. The percentage change in price (%ΔP) is calculated using:

where ΔP is the change in price between the original price and the new price, and Pavg is the average price between the original price and the new price. Equation 2 yields a percentage change in price of 6.1% ($25,000/$412,500).
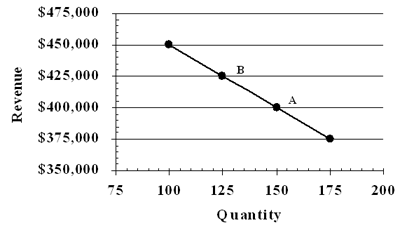
Figure 2. An example of an elastic demand function. See text for details.
As price increases, the quantity demanded is expected to decrease by 25 units from 150 units (point A) to 125 units (point B) in Figure 2. The percentage change in quantity (%ΔQ) is expressed as:
where ΔQ is the difference between the original quantity and the new quantity, and Qavg is the average quantity between the original quantity and the new quantity. Equation 3 yields a percentage change in quantity of -18.2% (-25/137.5). Given the solutions from Equations 2 and 3, the price elasticity of demand is -3.0 (-18.2%/6.1%, from Equation 1). Because the absolute value of ε> 1 (3.0), the demand curve is elastic, suggesting that consumers are more responsive to price changes.
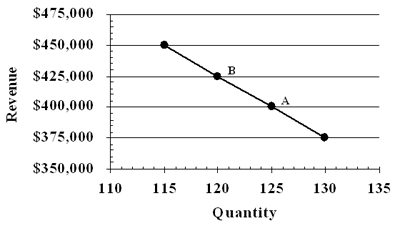
Figure 3. An example of an inelastic demand function. See text for details.
Figure 3 illustrates another example of an elasticity function. In this example, an audiology practice is dispensing 125 hearing aids annually, resulting in a total revenue of $400,000 (point A). The company hopes to increase its revenue by $25,000, which would result in a new total revenue of $425,000 (point B). Using Equation 2, the percentage change in price (%ΔP) equals 6.1% ($25,000/$412,500).
As price increases, the quantity demanded is expected to decrease by 5 units from 125 units (point A) to 120 units (point B). Equation 3 yields a percentage change in quantity (%ΔQ) of -4.1% (-5/122.5). The price elasticity of demand, in this example, equals -0.67 (-4.1%/6.1%, from Equation 1). Because the absolute value of ε inelastic, suggesting that consumers are less responsive to price changes.
Relationship between Elasticity and Revenue
The calculation of elasticity is important given:
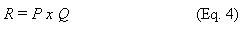
where R represents total revenue, P denotes price, and Q signifies quantity demanded. As noted in the equation, changes in price will impact quantity demanded and, ultimately, total revenue.
Total revenue also depends on demand function. That is, when demand is elastic, a decrease in price will result in an increase in total revenue. Total revenue increases when the percentage in quantity demanded exceeds the percentage change in price. Alternatively, an increase in price will result in increased total revenue when demand is inelastic. Total revenue will decrease when the percentage in price is greater than the percentage increase in quantity demanded. Table 1 highlights the relationship between elasticity and revenue. The take home message here is simple: raise prices when demand is inelastic and lower prices when the demand is elastic. (The reader should note that over-charging is not being advocated in this article. As detailed later in the text, over-charging for a product can result in no gain or a loss in revenue.)
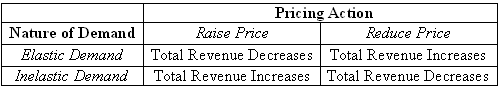
Table 1. Relationship between elasticity and revenue
Determinants of Elasticity
What makes demand for a product or service more (or less) price sensitive? There are at least eight factors that combine to determine elasticity of demand. These factors are tabulated in Table 2.
Table 2. Determinants of Elasticity in the Hearing Aid Industry
The leading determinant of a product's or service's demand elasticity is the availability of substitutes from other sources. A market having a large number of substitutes—such as over-the-counter pain and fever medications—generally lends to an increase in responsiveness by consumers (i.e., elasticity) as price changes. A market having few or no substitutes is inelastic. Examples of an inelastic market include hearing aids, electricity and tobacco. The introduction of over-the-counter amplification devices into the marketplace is potentially one way to improve consumer's responsiveness to hearing aids.
In a market having few or no substitutes, demand can be fairly elastic when the product or service is not an important purchase. Items that are nonessential purchases or viewed as luxury items—such as artwork or home-theater system—will tend to have an elastic demand. Conversely, the more an item is perceived to be a necessity, the more inelastic the demand function. Research has shown that persons with hearing loss are more likely to procure a hearing aid only when the perception of loss reaches a point of severe communication breakdown (Kochkin, 2000). In such cases, the demand for hearing aids is inelastic.
Demand is also more elastic for products and services that contain unique and salient features that differentiate them from those of competitors. For such a product or service, price becomes a less important feature, and the consumer is more willing to purchase the unique and salient features. Further, the more unique the product or service, the less consumers view competitive offerings as acceptable substitutes. On the other hand, demand will be more inelastic for undifferentiated, commodity-like products, such as those found in the hearing aid industry. The inelasticity of the hearing aid industry stems, in part, from the relatively few competitors that hold a disproportionate share of the market (i.e., oligopoly), and from the heavily interdependent strategies used by companies (e.g., open-ear fittings, noise reduction/cancellation, directional microphones).
Products having qualities and features that are difficult for consumers to evaluate and compare—such as hearing aids—tend to have an inelastic demand. The ability of the consumer to compare features across manufacturers will result in a more elastic demand.
If a product's price represents a sizeable percentage of the consumer's budget or income, then demand will be more inelastic. That is, consumers are more sensitive to price when the purchase requires a larger portion of their budgets or income. One way to make consumers less-price sensitive to high-ticket items is by allowing them to make installments over time. For such consumers of hearing aids, third-party financing is an option.
In some cases—such as in healthcare—consumers are required to pay only a portion of the total price for a product or service (i.e., co-payment), with a third-party paying the difference. In these instances, the smaller the proportion of the total price that consumers pay, the more inelastic the demand.
Switching costs refer to the amount a consumer must spend beyond the purchase price when changing from one brand to another. This includes any additional equipment, materials or related expenditures needed to operate and use the new product. Consumers will be less-price sensitive to brands when switching costs are high, and more sensitive to price when they can easily switch between brands.
The final determinant of elasticity is the existence of strong price-quality relationships. Generally speaking, demand is more inelastic for products that rely heavily on price to convey a high-quality image. That is, the higher price is a reflection of higher quality. In such cases, consumers generally expect price to be somewhat steep.
Elasticity of the Hearing Aid Market
What is the demand elasticity for the hearing aid market, and will demand elasticity allow for greater market penetration? The demand curve for this market is expected to be inelastic. Rationales for this conclusion were provided in the previous section on determinants of elasticity. Hearing aids have few substitutes, it is seen as an essential device to hear, hearing aid technology is difficult for the consumer to differentiate, and overall hearing aids are a significant investment for the patient as they are typically not paid for by insurance.
Few studies have been undertaken to determine the demand function in the hearing aid industry. Using Kochkin's (1992) MarkeTrak III data, Lee and Lotz (1998) demonstrated that price elasticity for hearing aids is rather low. In other words, lowering the price of hearing aids will not result in appreciable increases in the number of devices dispensed, and increasing prices will not decrease markedly the number of potential hearing aid users.
More recently, Amlani and De Silva (2005) examined the effect of economy and the impact of the FDA's intervention on the hearing aid industry between 1981 and 2002. Their results showed that the demand function within the hearing aid industry is inelastic and that the availability of differing technology types (i.e., analog, analog-programmable, digital) made the inelastic market more elastic. The authors further found that the demand-side of the hearing aid industry is significantly more responsive to changes in the economy (i.e., 10-14% decrease in demand during periods of recession) and hearing aids engineered with digital signal processing resulted in a reduction in quantity demanded.
Given the inelastic nature, Aaron (1987) found that overall market penetration would increase only by 35%, even when the federal government subsidized hearing aids fully. When Aaron's value is applied to the present market penetration of hearing aids of 23.6% or 7.3 million users, the number of persons with hearing loss procuring hearing aids would result in a total market penetration of only 31.9% or 10.1 million users.
Pricing Strategy for Dispensers
Given the inelasticity, what pricing strategy is available to dispensers? The answer to this question is illustrated in Table 3 and Figure 4. The data represented in Figure 4 is derived from a hypothetical practice that dispenses 210 hearing aids annually at $0 (not a misprint). Reducing the price will neither increase market penetration nor increase total revenue because the demand function for this market is inelastic.
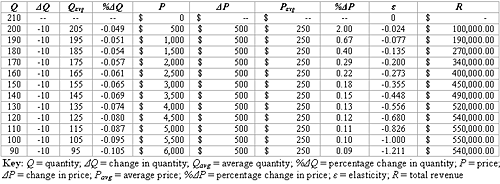
Table 3. Relationship between quantity and price on total revenue for an inelastic market derived from a hypothetical audiological practice. Corresponding data values were taken from Figure 4.
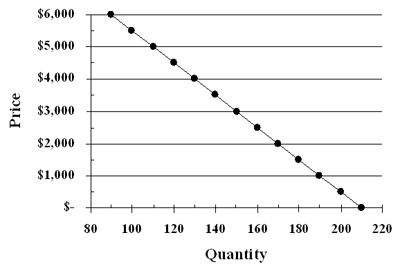
Figure 4. An example of an inelastic demand function derived from a hypothetical audiological practice, and its affect on revenue. Corresponding data values are also reported in Table 3.
To increase total revenue, price is increased to $1,000 per unit and 190 units are sold (Figure 4). This results in total revenue of $190,000 ($1,000 x 190), as shown in Table 3. Note that total revenue increases, while the number of units decreases in 10 unit increments and price increases in $500 increments. This means that fewer units are dispensed at a higher price yielding an increase in total revenue.
Table 3 also shows that the inelastic demand function becomes more elastic at higher prices. Increasing price and reducing quantity beyond this threshold (100 units at $5,500 each) will result in no gain or a loss in revenue. For instance, 90 units sold at $6,000 each yields a total revenue of $540,000—which is equal to 120 units sold at $4,500 each—or 80 units sold at $6,500 each, yields total revenue of $520,000.
To increase total revenue when the demand function is elastic, it is necessary to increase quantity and reduce price. For instance, increasing quantity by 5 from 100 units to 105 units and decreasing price from $5,500 to $5,250 will increase total revenue to $551,250 ($5,250 x 105).
As indicated by the example in this section, practices that understand the relationship between price and quantity have the greatest potential of maximizing its total revenue. By using the information in this article, practices can assess the quantity and price needed to maximize their revenue potential, given the price inelasticity of demand in the marketplace.
Summary
The price elasticity of demand (å) was introduced in this paper as a way to help practitioners quantify the sensitivity of consumer purchasing behavior as it applies to hearing aids. Why is this important? Ultimately, increasing the total revenue is an important aspect of any business— especially one that hopes to remain competitive—and pricing can have a significant impact on revenue. Given the inelastic nature of the hearing aid market, the author hopes that the information provided in this article will help hearing health professionals better understand those factors that influence the purchasing behavior of their patients and allow them to structure the price of hearing aids that maximizes the potential of their business.
References
Aaron M. J. (1987). An Economic Study of the United States Hearing Aid Industry: A Demand- and Supply-Side Examination. Unpublished doctoral dissertation. University of Illinois, Chicago, Illinois.
Amlani, A. M. & De Silva, D. G. (2005). Effects of business cycles and FDA intervention on the hearing aid industry. American Journal of Audiology, 14(1): 71-79.
Garstecki, D. C., & Erler, S. F. (1998). Hearing loss, control, and demographic factors influencing hearing aid use among older adults. Journal of Speech, Language, and Hearing Research, 41, 527-537.
Hetu, R. (1996). The stigma attached to hearing impairment. Scandinavian Audiology, 25(Suppl. 43), 12-24.
Kochkin, S. (1992). MarkeTrak III-Part 3: Would lower retail prices grow the market? The Hearing Journal, 45(9), 33, 36-38.
Kochkin, S. (1993). MarkeTrak III: Why 20 million in US don't use hearing aids for their hearing loss. The Hearing Journal, 46, 26, 28-31.
Kochkin, S. (2000). MarkeTrak IV: Correlates of hearing aid purchase intent. The Hearing Journal, 51(1), 30-38.
Kochkin, S. (2005). MarkeTrak VII: Hearing loss population tops 31 million people. The Hearing Review, 12(7), 16-29.
Lee, K., & Lotz, P. (1998). Noise and silence in the hearing instrument industry. Working Paper, Department of Industrial Economics & Strategy, Copenhagen Business School.
Surr, R. K., & Hawkins, D. B. (1988). New hearing aid users'perception of the "hearing aid effect." Ear and Hearing, 9, 113-118.
