H. Gustav Mueller, Ph.D.
Professor, Department of Hearing and Speech Science,
Vanderbilt University, Nashville, TN
Earl E. Johnson, Au.D., Ph.D.
Advanced Practice Audiologist, Veterans Affairs Medical Center, Mountain Home, Tennessee
Assistant Professor, East Tennessee State University, Johnson City
Jennifer Weber, Au.D.
Program Coordinator and Associate Professor, Audiology and Speech-Language Sciences, Department of Communication Disorders,
University of Northern Colorado, Greeley
Introduction
As expressed in published guidelines, there are several components to the overall hearing aid fitting process. The primary focus usually surrounds the selection of the hearing aids and their special features, verification of the fitting, and then some type of real-world validation. Another component recommended in all published hearing aid fitting guidelines but often overlooked, is pre-testing.
Pre-tests that are commonly conducted include the pure-tone audiogram, immittance and word recognition. These tests, however, are really part of the diagnostic battery and would be conducted on individuals who were not hearing aid candidates as well. Rather, the pre-tests referred to here are those that are specifically conducted to assist with the selection and fitting of amplification. There are several categories of tests available and several different tests within each category. Pre-testing can involve measures of loudness discomfort, speech understanding in quiet or in noise, noise annoyance, central auditory processing, cognitive function, patient expectations or personality assessment.
QuickSIN, ANL, PPT
This study looked at three speech-in-noise tests that have been suggested in the literature as providing useful guidance for the hearing aid fitting: The QuickSIN Speech in Noise test (Killion, Niquette, Gudmundsen, Revit & Banerjee, 2004), the Acceptable Noise Level (ANL) test (Nabelek, Freyaldenhoven, Tampas, Burchfield & Muenchen, 2006), and the Performance/Perceptual Test (PPT; Saunders, Field & Haggard, 1992), which includes the measure of the Performance-Perceptual Discrepancy (PPDIS).
The underlying purpose of each test is described as follows:
- QuickSIN: Measures the patient's understanding of key words in sentences with a background noise present (four-talker babble). The sentences are presented at six different signal-to-noise ratios (SNRs) ranging from +25 to 0 dB. The test can be scored either as SNR Loss or percent correct. It is generally believed that people with a large SNR Loss will have less success using hearing aids (for review, see QuickSIN manual at www.etymotic.com).
- ANL: As the name suggests, this test measures the level that the patient finds background noise acceptable while listening to speech at his or her most comfortable loudness (MCL) level. The difference in dB between the speech signal at MCL and the acceptable background noise (i.e., the SNR) is referred to as the ANL. It is generally believed that people with large ANLs will less likely be full time hearing aids users (See Plyler, 2009 for review).
- PPT: The PPT involves administering the Hearing In Noise Test (HINT) (Nilsson, Soli & Sullivan, 1994) twice with a patient. In one condition, referred to as Performance, the test is scored in the normal manner, which determines the SNR for 50% correct. This is referred to as the reference threshold for sentences (RTS) or speech reception threshold in noise (SRTN). In the second condition, referred to as Perceptual, the SRTN is determined based on the patient's report of whether he or she understood all the words in the sentence. The Perceptual score is subtracted from the Performance score to obtain the PPDIS. It is generally believed that a large PPDIS (negative or positive), could impair a patient's communication skills, and perhaps even his or her satisfaction with amplification (See Saunders, 2009 for review).
Since the QuickSIN, ANL and PPT all involve speech-in-noise, one might predict that there are significant associations among the results of these tests. A few examples of such predictions are listed here.
- QuickSIN vs. ANL: One might predict that people who do poorly on the QuickSIN would also have a large ANL. Since they are aware that they cannot understand well in background noise, and probably frustrated concerning this, they might find background noise more annoying and bothersome.
- QuickSIN vs. PPDIS: People who do poorly on the QuickSIN might have a negative PPDIS; that is, Perceptual SRTN worse (more positive SNR) than the Performance SRTN. Because they are accustomed to doing poorly in background noise, they might believe that they are doing worse than they really are.
- ANL vs. PPDIS: People who find noise to be unusually annoying (large ANL score) might find many thmngs in life annoying. This attitude could prompt them to think they were understanding speech worse than they really were (negative PPDIS). Conversely, a person who believes he understands speech much better than he really does might not be someone willing to admit that background noise is annoying.
While each of these tests is easy to administer and score, each one does add extra time to the overall pre-fitting process; conducting all three might not be deemed practical in a busy dispensing practice. If there are significant associations among the tests, and the outcome of one test more or less predicts the outcome of another, then there would be little reason to conduct all three. On the contrary, if the pre-tests are not associated, perhaps each really does bring new information to the fitting table and should be considered in a pre-fitting protocol. This study examined associations among these tests to help in clinical decision making in terms of inclusion in the pre-test battery.
Clinical usage
Mueller (2010) examined usage and popularity of these pre-tests through a survey of dispensing audiologists and hearing instrument specialists (n=107) who participated in two hearing aid workshops in 2009. A 20-minute presentation was given for each test describing its purpose, its administration and scoring, and how it could be used for fitting and counseling. At the end of each presentation, participants answered a question based on the test that had just been discussed. Five choices were offered:
- I already do this test routinely.
- I already do this test some of the time.
- Sounds good, and I'll probably start doing this test.
- Sounds good, but I'll probably never do this test.
- Don't think this test is worth the time investment.
The results are shown in Figure 1. Of the three tests, the QuickSIN was by far the most popular. Results showed that it currently was being used at least some of the time by 33% of respondents, with another 43% reporting that they will probably start using it. In addition, while over 50% of respondents believed that both the ANL and the PPT sounded like good tests, only approximately 5% reported using them, with another 18-23% stating that they think they might start.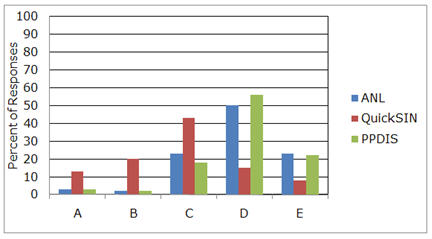
Figure 1. Distribution of popularity, as rated by dispensers (n=107), of three speech-in-noise tests associated with hearing aid fittings. A=I already do this test routinely. B=I already do this test some of the time. C=Sounds good, and I'll probably start doing this test. D=Sounds good, but I'll probably never do this test. E= Don't think this test is worth the time investment.
While the ANL and PPT are not widely used, the question remains whether they do provide unique information and should be given stronger consideration in pre-test battery, or because of associations among pre-tests, their results can be predicted by other tests such as the more popular QuickSIN.
Methods and Procedures
Participants
The 20 participants (14 male, 6 female) in this study ranged in age from 47 to 83 years with a mean age of 66.6. All had bilateral, symmetrical, downward-sloping sensorineural hearing loss and were regular satisfied users of bilateral hearing aids. The mean audiogram is shown in Figure 2. The participants were recruited through the Audiology Clinic at the University of Northern Colorado and were paid $50 for their participation.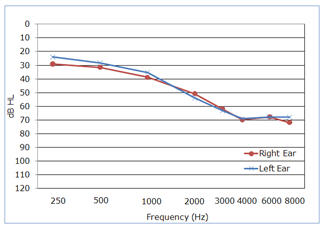
Figure 2. Mean audiogram for the right and left ear of the study participants.
Speech Tests and Methods
The QuickSIN, ANL and PPT were administered to each participant. All testing was conducted bilaterally unaided in the soundfield, with the patient seated one meter from the loudspeaker used to deliver both the speech and competing speech signals, presented from a 0 degree azimuth. The order of test presentation was counterbalanced, and participants were randomly assigned an ordering.
QuickSIN.
The standard CD available from Etymotic Research was used for the QuickSIN test. The QuickSIN consists of a list of six sentences presented by a female talker. There are five key words per sentence presented in a four-talker babble noise. Each key word is scored for a potential score of 30 for each six-sentence list. The sentences are presented at pre-recorded SNRs that decrease in 5 dB steps from 25 (very easy) to 0 (extremely difficult). The six SNRs used were: 25, 20, 15, 10, 5 and 0.
The sentences were presented at 75 dB SPL, which resulted in the background babble being presented from 50 to 75 dB SPL in 5 dB steps. Two lists were given to each individual (Lists 2 and 3) following a practice list. The following instructions were given to each participant:
"Imagine that you are at a party. There will be a woman talking and several other talkers in the background. The woman's voice is easy to hear at first, because her voice is louder than the others. Repeat each sentence the woman says. The background talkers will gradually become louder, making it difficult to understand the woman's voice, but please guess and repeat as much of each sentence as possible."The results were scored for both SNR Loss and overall percent correct, averaged for the two lists. For example, someone missing 9 of the 60 words on the two lists would have an SNR Loss of 0 dB, and a percent correct score of 85; this is average performance for individuals with normal hearing. A person missing 15 words for each list, or 30 of the 60 words, would score 50%, or an SNR Loss of 10.5 dB (see SNR scoring procedure at www.etymotic.com/pdf/quicksin-manual.pdf.)
Acceptable Noise Level Test.
The ANL is the difference between a person's MCL for running speech, and the highest level of background noise level (BNL; multitalker babble) that they can "put up with" while listening to the speech signal at their MCL. That is, if an individual's MCL is 70 dB HL, and the BNL is 62 dB HL, the ANL would be 8 dB. The smaller the ANL, the greater acceptance the individual has with background noise.
The signal used for the MCL measurement was the standard male running speech known as the Arizona Travelogue presented from CD from Cosmos Inc. (now available from Frye Electronics), which has been used in the majority of ANL research. The background noise, presented from the same CD, was the multitalker babble of the revised Speech Perception in Noise (SPIN) test (Kalikow, Stevens & Elliot, 1977).
During testing, the participants used hand signals to indicate whether the speech or noise level needed to be higher or lower. At first, the boundaries were set by making the signal "definitely too loud" and then gradually lowering to "definitely too soft." Then, a 2 dB bracketing procedure was used to obtain the MCL and the BNL. For each participant, the BNL was then subtracted from the MCL, and an ANL value was obtained.
The instructions for the MCL procedure were as follows:
"You will listen to man reading a story through the loudspeaker. After a few moments, select the loudness of the story that is most comfortable for you, as if you were listening to a radio. I will adjust the loudness for you—just signal to me if you want it turned up or down. But first, I'd like you to have me turn the loudness up until it is too loud and then down until it is too soft. Then, have me turn the loudness up and down until we find the loudness level that is the most comfortable for you."
The following instructions were used for the BNL testing:
"Now you will listen to the same story as before, except there now will be background noise of several people talking at the same time. After you have listened to this for a few moments select the level of background noise that is the MOST you would be willing to accept or "put-up-with" without becoming tense and tired while following the story. First, have me turn the noise up until it is too loud and then down until the story becomes very clear. Finally, have me adjust the noise (up and down) to the MAXIMUM noise level that you would be willing to "put-up-with" for a long time while following the story."
Performance-Perceptual Test (PPT).
The PPT was conducted using the conventional HINT CD recording with the broadband background noise, filtered to match the long-term average spectrum of the sentences. The background noise was presented at a fixed level of 70 dB SPL. Using an adaptive procedure for the sentences, two lists (total of 20 sentences) were administered for both the Performance and Perceptual testing. The order of Performance vs. Perceptual testing was counterbalanced and randomized.
The Performance portion of the PPT was scored in the traditional HINT manner. The participants repeated back as much as possible for each sentence, and if all key words were repeated correctly, the sentence was scored as correct, and the next sentence was presented 2 dB softer. Using this adaptive approach, after 20 sentences the 50% correct score for the sentences waw calculated, termed the reference threshold for sentences (RTS) or with the PPT, referred to as speech reception threshold in noise (SRTN).
For the Perceptual portion of the PPT, the same test procedure was followed, except that after each sentence presentation, the participant said either "Yes" (I could understand everything) or "No" (I could not understand everything). Again, the Perceptual SRTN was scored, and was then subtracted from the Performance SRTN, to obtain the PPDIS. The PPDIS is a measure of how well a person judges his or her ability to understand speech in background noise. A positive score would indicate the person overestimates his speech understanding ability while a negative score suggests that he underestimates his ability.
Selection of Presentation Levels
The speech signal was set at similar SPLs for the different tests, as it was believed that the audibility of the speech signal may impact results. However, it could not be set at exactly the same SPL for each test. The QuickSIN has a fixed speech signal, the HINT has a fixed noise signal, and the ANL is conducted at the speech MCL. Previous ANL research with a group of participants with very similar hearing loss (Mueller, Weber & Hornsby, 2006) found an average speech MCL of 76 dB SPL. This supported the use of a fixed 75 dB SPL speech signal for tle QuickSIN. A group of individuals with this degree of hearing loss would be expected to have an average HINT RTS of about 5-7 dB. For the average HINT speech signal to fall at approximately 75 dB SPL (close to the average level for the ANL and QuickSIN), a fixed noise level of 70 dB SPL was used for the HINT.
It is possible that slightly higher QuickSIN scores would have been obtained if a higher presentation level were used: a 70 dB HL (~85 dB SPL soundfield) is recommended for earphone testing. However, then the presentation level would have been above the MCL that the average participant with hearing loss had selected during the ANL procedure. Moreover, to have the average HINT speech signal presented at a similar level, it would have been necessary to raise the fixed background noise to 80 dB SPL. This in turn may have pushed the speech level to a participant's loudness discomfort level (LDL) if he had an unusually large (poor) RTS (e.g., with an RTS of 15 dB, it would be necessary to present speech at 95 dB SPL or louder if an 80 dB fixed noise signal were used). Loud presentation levels also tend to distort the usability of audible speech (level distortion factor), decreasing speech intelligibility (American National Standards Institute, 1997).
Results
QuickSIN
The range of SNR Loss for the QuicoSIN test was 18.5 dB to -3.0 dB, with a mean SNR Loss of 6.0 dB. Expressed in percent correct, the range was 24 to 95%, with a mean of 65.5%. These results are typical for the age and degree of hearing loss of the participants in this study.
ANL
The ANL test scores ranged from 2 to 14 dB, with a mean score of 7.3 dB. ANL scores often are categorized by their predictive properties relative to hearing aid use. Given that all participants were full-time hearing aid users, it is not surprising that 50% of them were in the Low-ANL group (ANL<7 dB). Nine participants were in the Mid-ANL range (8 to 12 dB), and only one participant was in the High-ANL range (>12 dB).
PPT
The mean HINT Performance SRTN (RTS) was 6.4 dB, with a range of 16.3 to 0.4 dB. This is consistent with the expected finding for a group with this degree of hearing loss, and these results are similar to those of the QuickSIN. The Perceptual HINT SRTNs ranged from 13.0 to -1.6 dB, with a mean of 4.4 dB. This resulted in PPDIS scores ranging from 5.7 to -1.2 dB, with a mean PPDIS of 2.0 dB. Nine of the 20 participants had a positive PPDIS of 2 dB or greater, and there were no participants with a negative PPDIS of 2 dB or greater. That is, as a group these individuals tended to overestimate their speech understanding ability. This is somewhat contradictory to the work by Saunders who has found that average PPDIS scores fall in the -3 to 0 dB range (see Saunders 2009 for review). This could be related to the method of participation selection in this study. Participants in this study were experienced, full-time, satisfied users of hearing aids. There are data to suggest that dissatisfied hearing aid users are more apt to have negative PPDIS scores.
As mentioned, the main purpose of this study was to analyze the associations among the three tests. Because the PPT requires the traditional HINT RTS for calculation, these scores were included as a separate variable in addition to the PPDIS. Also included was the participant's age and degree of hearing loss. The average hearing loss for each participant was calculated as a bilateral pure-tone average (PTA) using 500, 1000, and 2000 Hz and also as a high-frequency pure-tone average (HF-PTA) using 1000, 2000 and 3000 Hz. This resulted in a total of seven different variables.
Figure 3 displays the distribution of the findings for the three different tests. The X-axis is the QuickSIN score expressed in percent correct, and the Y-axis shows the ANL and PPDIS score, as well as the HINT RTS for the Performance measure. The ANL relative to the PPDIS score is plotted in Figure 4.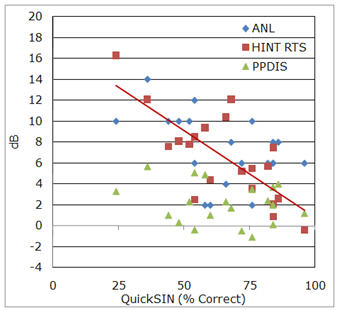
Figure 3. Distribution of the QuickSIN data (displayed in percent correct on the X-axis) versus the ANL, HINT RTS, and PPDIS data (displayed in dB on the Y-axis).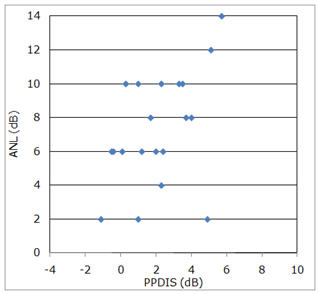
Figure 4. Distribution of the PPDIS calculations (in dB) versus the ANL test scores.
A correlation statistical analysis was conducted to examine potential associations between the scores shown in Figures 3 and 4 as well as patient age and degree of hearing loss (i.e., the seven different variables mentioned earlier). A matrix of Pearson correlation coefficients and significance values are shown in Table 1.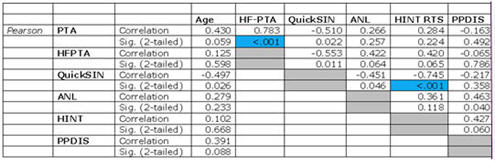
Table 1. A matrix of Pearson correlation coefficients indicating the associations among the seven variables. The two significant correlations (p<.01) are highlighted.
Click Here to View a Larger Version of Table 1 (PDF)
A more stringent significance value of p < 0.01 was chosen over the more typical p < 0.05 for two reasons. First, from a statistical perspective, 3Gi>p < 0.01 was selected to reduce the likelihood of incorrectly rejecting the null hypothesis (test variables were thought to be related when they in fact were not), because of the high number of statistical comparisons in this analysis (i.e., 21). Choosing a p < 0.05 would mean that 1 out of 20 correlations would be significantly correlated with one another based on chance alone. The more stringent significance value of p < 0.01 would help control for this.
The second reason is related to a clinical perspective, that is, these three pre-fitting tests were developed for specific purposes by their respective developer(s). If by demonstrating a correlation among the tests one of more of the tests would be eliminated from a pre-fitting battery, then it would be justifiable for correlations to not only be statistically significant, but also of a high correlation magnitude (e.g., R = 0.70 or greater). When correlations are higher than approximately 0.70, the correlated variables have an associative redundancy (r2) of approximately 50% or greater. Such high correlations, if demonstrated, then would seem to have more clinical relevance in regards to advocating against the use one or more of the pre-fitting tests.
For an estimate of statistical power in the analyses conducted here, using an assumed true r2 value of 0.5 (equal to 50%), a sample size of 20 participants, and one independent variable for every dependent variable, power was calculated at 0.86. A sufficiently powered analysis is typically considered to have a calculated power of 0.80 (Cohen, 1988); this study design would have demonstrated significant correlations having an r2 value of 0.5, at least 86% of the time (Lenth, 2010). In terms of effect, very large effect sizes were sought in order to meet the goal of clinical relevance. The sample size of 20 and chosen alpha level of 0.01 allowed for the detection of 0.75 effect sizes with 0.80 statistical power.
As shown in Table 1, using a criterion of p <0.01, only two variables were shown to correlate with one another: the PTA at 500, 1000, 2000 Hz and the HF-PTA at 1000, 2000, and 30000 Hz, and the performance HINT RTS and the QuickSIN score. The HINT/QuickSIN correlation was negative, as the QuickSIN was scored in percent correct (bigger = better) and the HINT was scored in RTS (SRTN) (smaller = better). The strong magnitude of the relationship between the HINT RTS and QuickSIN score is illustrated by the red trend line in Figure 3.
Previous research has shown that age will significantly affect speech intelligibility in background noise (e.g. the QuickSIN and the HINT performence score), but that was not evidenced in this study. This could be because all the participants were in a relatively narrow age range (47 to 83 years), and perhaps also because a requirement for participation in the study was that they were experienced and satisfied hearing aid users - the older participants, therefore, probably had minimal cognitive or auditory processing deficits.
Concomitantly, regarding the purpose of this study, it is most important to note what was not correlated. As shown in Table 1, and indirectly in Figure 3, the QuickSIN was not correlated to either the ANL or the PPT, and the ANL and PPT were not correlated to each other in a significant manner (illustrated in Figure 4). In fact, the highest non-significant correlation among the three tests was 0.463 between the PPT and the ANL. By squaring the correlation of 0.463, it can be said that only 21.4% of the variance on one test can be explained by the other test. This suggests that each test provides some unique information about the patient.
Summary
This study supports the use of pre-fitting measures and, in particular, the data suggests that three pre-fitting measures that will likely provide useful, non-associative, information about the patient are the ANL, PPT, and QuickSIN. Each test brings new information to the table and can be used for counseling and perhaps even decision making regarding technology (see Mueller 2010 for review).
In a busy practice, efficiency is important, therefore the usefulness of a given test must be weighed against the time investment. In many cases, these tests can be conducted during the routine diagnostic exam; each test may add an extra 5 minutes. Testing could be conducted for anyone who appeared to be a potential candidate for hearing aids. Using the same test material would streamline the testing. The Mueller (2010) survey showed that one-third of professionals are already conducting the QuickSIN, with another ~40% planning on starting. While we are not familiar with research validating the use of the QuickSIN material for ANL measures, research with other similar speech materials (e.g., the HINT) would suggest that the results would be similar to those obtained with the traditional ANL speech and noise signals (one would need to use the QuickSIN tracks which allow for independent control of the speech and babble signals). We also are not aware of research using the QuickSIN for the PPT, but this also would seem possible. The Perceptual scoring would need to be adapted since the sentences are not scored "all" or "nothing" as the HINT, but it could likely be done. This would be especially helpful for someone starting out with the PPT, as the CD version of the HINT is no longer commercially available.
Disclaimer: The opinions expressed in this article are those of the authors and do not necessarily represent the official position of the U.S. Department of Veterans Affairs or the United States government.
Acknowledgements
A portion of this article's completion was supported by the Mountain Home, TN VAMC Auditory and Vestibular Research Enhancement Award Program and a Career Development Award-1 sponsored by the U.S.A. Department of Veterans Affairs Rehabilitation Research and Development Office.
The authors would like to acknowledge the assistance of Emily Wakefield, Au.D. candidate at the University of Northern Colorado, for her assistance with data collection and management.
References
American National Standards Institute (ANSI). (1997). ANSI S3.5-1997. Methods for calculation of the speech intelligibility index. New York, NY: Author.
Cohen J. (1988). Statistical power analysis for the behavioral sciences (2nd ed.). New York: Academic.
Kalikow, D.N., Stevens, K.N. & Elliot, L.L. (1977). Development of a test of speech intelligibility in
noise using sentence materials with controlled word predictability. Journal of the Acoustical Society of America, 61, 1337-1351.
Killion, M.C, Niquette, P.A., Gudmundsen, G.I.2G Revit, L.J., Banerjee, S. (2004). Development of a quick speech-in-noise test for measuring signal-to-noise ratio loss in normal hearing and hearing impaired listeners. Journal of the Acoustical Society of America, 116(4), 2395-2405.
Lenth, R.V. (2010). Java applets for power and sample size computer software. Retrieved February 26, 2010, from https://www.stat.uiowa.edu/~rlenth/Power.
Mueller, H.G. (2010). Three pre-tests: What they do and why experts say you should use them more. Hearing Journal,63(4), 23-28.
Mueller, H.G., Weber, J. & Hornsby, B.W.Y. (2006). The effects of digital noise reduction on the acceptance of background noise. Trends in Amplification, 10(2), 83-93.
Nabelek, A.K., Freyaldenhoven, M.C., Tampas, J.W., Burchfield, S.B., & Muenchen, R.A. (2006). Acceptable noise level as a predictor of hearing aid use. Journal of the American Academy of Audiology,17, 626-639.
Nilsson, M., Soli, S.D., Sullivan, J. (1994). Development of the Hearing In Noise Test for the measurement of speech reception thresholds in quiet and in noise. Journal of the Acoustical Society of America, 95, 1085-99.
Plyler, P.N. (2009). Acceptance of background noise: Recent developments. Hearing Journal, 62(4), 10-14.
Saunders, G.H. (2009). Understanding in noise: Perception versus performance. Hearing Journal,62(5), 10-14.
Saunders, G., Field, D., & Haggard, M. (1992). A clinical test battery for Obscure Auditory Dysfunction (OAD): Development, selection and use of tests. British Journal of Audiology, 26, 33-42.