Learning Objectives
After this course, participants will be able to:
- List three studies designed to improve the TV listening experience for people who use hearing aids.
- Describe the objectives and methodology of three studies designed to improve the TV listening experience for people who use hearing aids.
- List three conclusions that can be made based on the results of the studies described.
Introduction
Understanding television dialogue can be a challenge for anyone, but more so for the hearing impaired. Given the variety of accents, dialects, articulation, backgrounds, sound effects and music, it is not surprising that this would be one of the most difficult listening situations a hearing aid user encounters on a regular basis. Today’s movies and television programs incorporate powerful sound effects and music which are often considered as much a part of the story as the dialogue between the characters. While these effects add to the experience of the program, they can also make the task of understanding the dialogue and conversations much more difficult. At the same time, television viewing remains one of the most common leisure activities for American adults. The Bureau of Labor (2015) reports that the average American watches 2.7 hours of TV per day, and Nielsen (2017) reported that Americans over the age of 50 watch over 47 hours of TV per week. Additionally, Hasan and colleagues (2014) found that the two most frequent listening activities of hearing aid users were conversations and listening to media. It is therefore surprising that there has been little research on TV listening by hearing aid users.
As hearing aid technology continues to improve, manufacturers are expanding the newest technologies to aid users in more complex listening environments. For example, some hearing aids have unique programs for speech in various noise backgrounds, speech from the sides or behind, speech in the car, etc. However, there are no defined or specifically recommended programs that fully optimize TV listening. The introduction of audio streaming from TVs to hearing aids via wireless accessories such as Phonak’s TV Link II promised to alleviate some of the difficulties. Streaming bypasses the ambient noise and reverberation picked up by the hearing aid microphones and thus provides clearer TV audio to hearing aid users. Yet despite the fact that understanding TV remains both a priority and challenge to hearing aid users, streaming accessories do not appear to be widely utilized (Strelcyk et al., 2016; Deuber & Renken, 2014).
In 2014, Phonak researchers began a series of studies on TV listening in order to better understand the challenges involved and to improve the TV listening experience for hearing aid users. By 2016, three studies had been completed at the Phonak Audiology Research Center (PARC) with the results of these studies aiming to inform developments for future products. The first of these studies evaluated specific hearing aid acoustic programs for TV listening using the television speakers. The second study compared different hearing aid programs presented via streamed presentation, and finally, the third study evaluated different binaural presentation modes within the streaming program.
TV Listening Study #1
This first study focused on evaluating three different hearing aid programs for acoustic TV listening. The main differences between the programs were the use of EchoBlock and different dynamic range compression (DRC) time constants. EchoBlock was tested here because the down-firing or rear-firing loudspeakers, which are commonly found in today’s flat-panel TVs, result in viewers receiving high degrees of reverberation due to sound indirectly bouncing off walls, TV stands, or the floor.
Methodology
Nine adult participants ranging in age from 22 to 66 years (median of 57) participated in this first study. All participants had mild to moderate sensorineural symmetric hearing loss, with an average PTA of 53 dB HL. All were experienced hearing aid users and native speakers of American English.
The room set up is shown in Figure 1. The media clips were played back from a Sony BDP-S370 Blue-Ray disc player via a Sony flat screen TV (model #40W600B). The TV was placed on a table 22 inches from the short wall, and the participant was seated 90 inches from the TV. The wall to the right of the participant was lined with upper and lower cabinets. The television’s internal, down-firing loudspeakers were used to play back all sounds. The reverberation time (RT60) in the listening room measured from the TV loudspeakers to a KEMAR manikin was 500 ms, and the direct- to- reverberation energy ratio was -7 dB. The media clips were played back at a level of 60 dBA at the listener’s position.
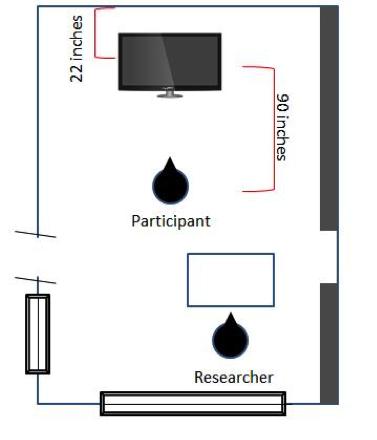
Figure 1. Room set up for all three listening studies.
Participants were fit binaurally with Audeo V90 312 RIC devices using power domes and the appropriate receiver as prescribed by Target 4.1 software. All devices were set to 100% target gain using the NAL-NL2 fitting formula. AutoSense, SoundRecover, WindBlock, NoiseBlock, and SoundRelax were disabled. Whistleblock was activated. The hearing aids were programmed with three custom programs. Program 1 was set to Comfort in Echo with EchoBlock enabled at the default strength of “13”. Programs 2 and 3 featured different DRC speeds, with attack/release time constants on the order of 10/50 ms and 1000/5500 ms, respectively. From here on forward, these programs will be referred to EB, FastDRC, and SlowDRC, respectively.
A custom Matlab software for real-time sound attribute ratings was used to allow the participants to compare and evaluate the three programs alongside each other while listening to the running media clips. Using the computer and a mouse, the participants were able to toggle between the hearing aid programs and rate them according to the sound attribute being evaluated. The order of the programs, which were labeled as “A”, “B”, and “C” on the user interface, was randomized from clip to clip, thus keeping the participants blinded as to which program they were listening to at any given time. Figure 2 shows an example of one of the test screens.
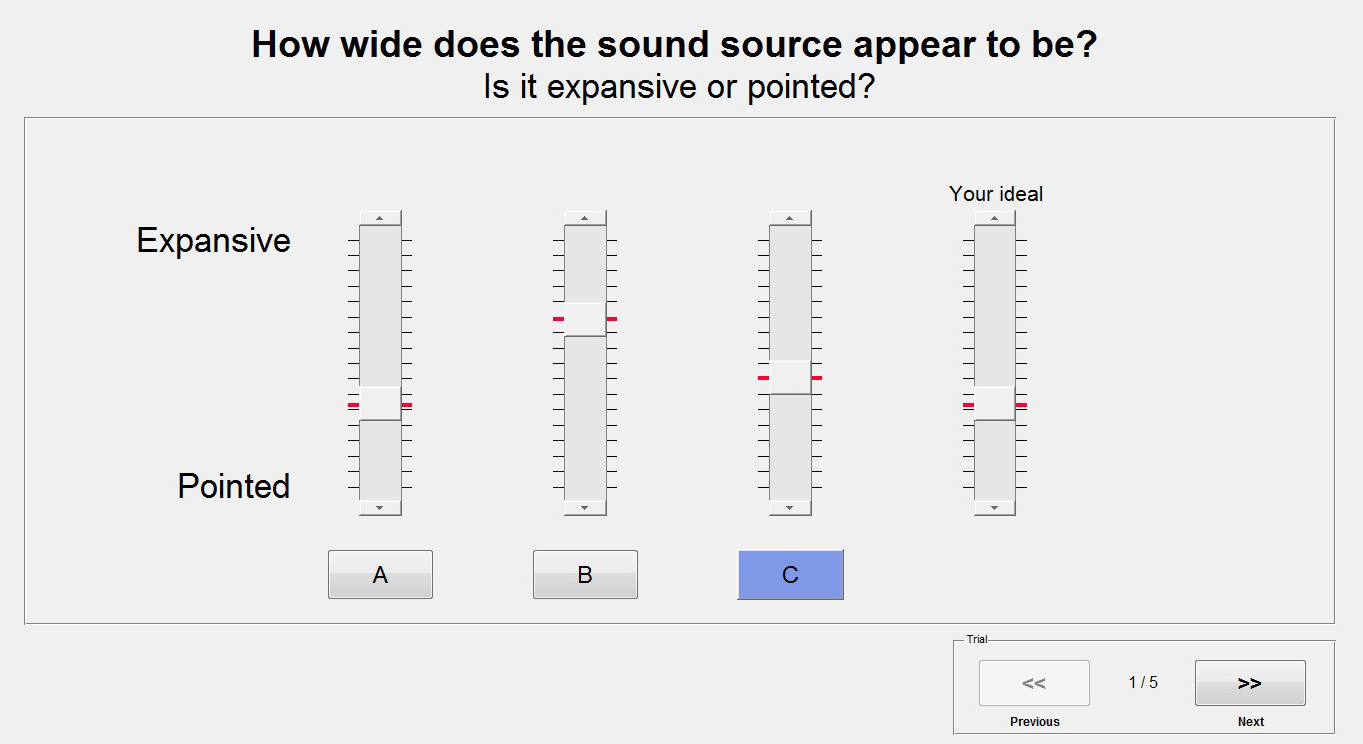
Figure 2. An example of the test screen used by the participants to rate one of the sound attributes. A, B, and C are the different hearing aid programs and the participant could click on each letter to switch between the hearing aid programs while listening to the clip.
The following attributes were evaluated:
- Speech intelligibility
- Dynamics of music and sound effects (audio-visual presentation, i.e., TV picture was presented along with audio)
- Source width (i.e. “How wide does the sound source appear to be?”)
- Amount of reverberation
Each attribute was rated for running clips of 60 to 75 second durations. Four to six clips were used, depending on the rated attribute. For the dynamics ratings, the picture was presented along with the audio. For all other attributes, only the audio signal was presented. The order of the attributes to be rated was counterbalanced across participants. Each clip was carefully chosen such that audio content remained relatively constant across the duration of the clip. Different clips were selected for each attribute. Specifically, scenes that incorporated accents, whispers, reverberation, and backgrounds such as music, ambient effects, babble or crowd noise were chosen for the intelligibility ratings. These clips were shown only once as intelligibility ratings would have been distorted by repeated exposure to the same clips. Clips that were particularly focused on sound effects and music but with little dialogue were chosen for the dynamics rating, and so on. Participants were given explicit instruction on what they were listening for and rating in each block. A training clip was used prior to each measurement block. In addition, participants were instructed to rate their ideal point for selected attributes. For example, participants might have rated source width as “expansive” for the hearing aid programs, but their ideal source width, i.e., the source width that they would have found most desirable, might have been “pointed”.
Results
Speech intelligibility. A repeated measures ANOVA was conducted to compare the perceived speech understanding between the three programs. There was a statistically significant difference between the programs [F (2, 16) =5.39 p = .02]. Specifically, a post-hoc Tukey test confirmed a difference between EB and FastDRC (p=.013). There was no significant difference between FastDRC and SlowRC, nor between EB and SlowDRC. Figure 3 shows the mean intelligibility ratings.
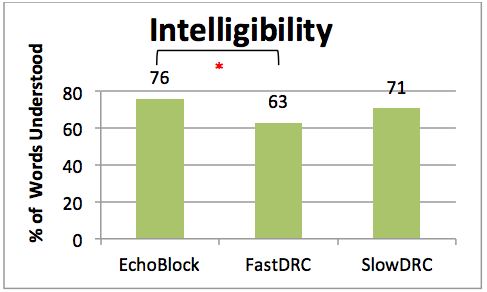
Figure 3. Mean ratings of speech intelligibility across all three programs for all nine participants. Participants were instructed to pay attention to each word and rate the percentage of words understood.
Dynamics. The participants were instructed to pay close attention to the entire scene, including background sound effects and music for these clips, and rate them on a scale from “powerful, present, alive, lifelike, and realistic” to “flat”. There were no significant differences between the three programs. However, the SlowDRC program tended to yield the most powerful dynamics. Ideally, participants would have preferred the sound effects to be slightly more powerful than delivered by any of the tested hearing aid programs.
Source Width. Participants were asked to rate the apparent width of the sound source on a scale from “expansive” to “pointed”. There were no significant differences between the three programs. However, there was a trend for EB to yield narrower source widths than the other programs. The ideal source widths depended upon the clip contents. Participants tended to prefer a more pointed source width for speech, but wider source width for music and sound effects. Results are shown in Figure 4.
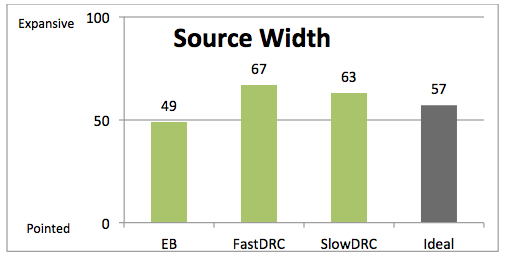
Figure 4. Mean ratings of source width across the three programs for study #1. Participants tended to rate EB as less expansive than the other two programs. Note: The user interface displayed the ordinate labels “pointed” or “expansive”. The numbers 0 to 100 have been added to the figure to quantify the mean ratings.
Reverberation. There was no significant effect of hearing aid program. However, there was a trend for EB yielding the lowest amounts of reverberation, and closest to the ideal level of reverberation.
TV Listening Study #2
This study was similar to the first study, with the difference that the television audio was streamed directly to the hearing aids (via direct audio input, DAI) instead of being presented acoustically from the TV loudspeakers. Thus, in contrast to the first study, room reverberation was absent and the TV audio was presented in full stereo to both ears. Again, the hearing aid programs under test were EchoBlock, fast, and slow DRC.
Methodology
Fifteen experienced adult hearing aid users with bilateral symmetric sensorineural hearing loss participated in this study. All were native speakers of American English. There were five females and 10 males, ranging in age from 45 to 80 years, with a median age of 71. The hearing losses ranged from mild to moderate-severe, with an average PTA of 48 dB HL.
TV streaming was simulated using DAI from the TV stereo headphone output via a VST (Virtual Studio Technology) plugin to bilateral Audeo V90 RIC 13 devices with AS18 audio shoes. The TV clips were played back at a level of 60 dB (A) at hearing aid input. The TV speakers were turned off.
As in the previous study, the NAL-NL2 fitting formula was used and set to 100% target gain. The software prescribed receivers were coupled to the devices using power domes. The hearing aids were again programmed with three custom programs, all based off of the “TV via Roger/DAI+mic” program. The program settings were otherwise identical to those used in the first study, with hearing aid programs EB, FastDRC, and SlowDRC.
The same audio clips that were used for study #1 were also used for this study with the addition of a news clip and a live sports clip.
The following sound attributes were rated in this study:
- Speech intelligibility
- Dynamics of music and sound effects (audio-visual presentation)
- Dynamics of music and sound effects (audio only, otherwise the same as 2); in particular, the same clips were used)
- Source width
- Amount of reverberation
The same user interface as in the first study was used for the attribute ratings.
Results
Speech Intelligibility. There were no significant differences between the three programs, with the average percent of words understood at 79%, 78% and 80% for EB, FastDRC and SlowDRC, respectively.
Dynamics (audio only). The program ratings differed significantly [F (2, 26) =8.341, p=.002]. Specifically, a post-hoc Tukey test revealed that there was a significant difference between EB and SlowDRC (p=.001), with EB being rated less “powerful”. This indicates that EB may reduce the perceived dynamics of sound effects and music.
The ratings for dynamics including the TV picture did not differ significantly from the ratings using the same audio only clips. The similarity of these audio-visual and audio-only ratings suggests that the additional presentation of video along with the audio did not influence the dynamics ratings. On the contrary, when averaged across clips, the participants’ audio-visual and audio-only ratings were significantly correlated (p<0.01 after Bonferroni correction), indicating that the attribute rating method yielded reproducible results.
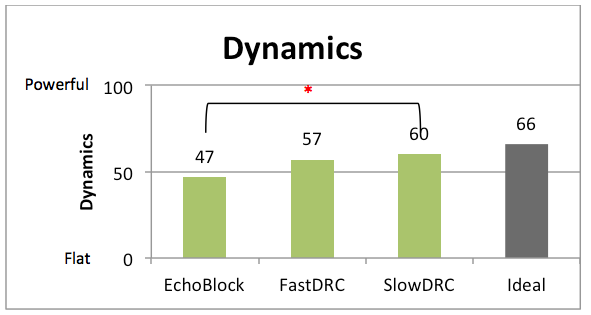
Figure 5. Mean ratings for dynamics in study #2. The EchoBlock program yielded the lowest dynamics ratings. Note: The user interface only displayed the ordinate labels “Powerful” and “Flat”. The numbers from 0 to 100 have been added to the figure to quantify the mean ratings.
Source Width. There were no significant differences between the programs. However, as in the first study, sources tended to be rated least expansive for EB.
Reverberation. The reverberation ratings differed significantly across the hearing aid programs [F (2, 28) =9.479, p =.001], as shown in Figure 6. A post-hoc Tukey analysis revealed significant differences between EB and FastDRC (p=.003) as well as between EB and SlowDRC (p=.002), with EB yielding the lowest amounts of perceived reverberation. Thus, despite the absence of acoustic room reverberation, EB seems to have reduced intrinsic reverberation in the film clips.
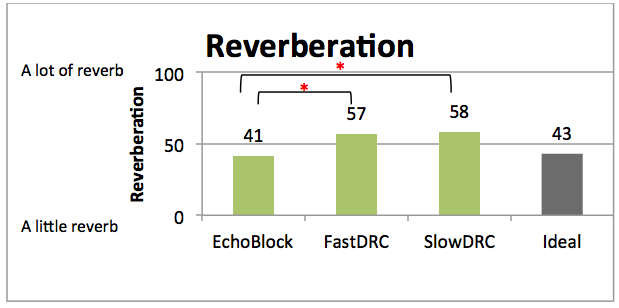
Figure 6. Mean reverberation ratings for the three hearing aid programs. The EB program yielded the lowest reverberation ratings, closest to the participants’ ideal level. The numbers from 0 to 100 have been added to the figure to quantify the mean ratings.
TV Listening Study #3
The purpose of this final study was to evaluate different binaural presentation modes for streaming television audio to hearing aids. The tested presentation modes were mono, stereo, and spatial enhancement. Mono presents the same sounds to both ears (diotic presentation) and will typically produce a sound image that is centered in the head. Stereo may be considered superior to mono as it presents two partly independent sound channels to the ears. This allows hearing sounds from various directions and thus can result in a more natural or realistic listening experience. Spatial enhancement is an extension of stereo. Starting with the stereo audio, we used Dolby® ProLogic® II processing to upmix the signal from two to 5.1 channels and subsequently applied Dolby® Headphone processing, which uses generic head-related transfer functions (HRTFs) to yield a spatialized two-channel signal. In the ideal case, this spatialized signal could deliver a virtual, externalized surround sound experience. Both stereo presentation and spatial enhancement have been found to be preferred by normal hearing listeners over mono presentation (Lorho, 2005). However, Lorho and Zacharov (2004) and Lorho (2005) found that normal hearing listeners did not prefer spatial enhancement over stereo presentation. Therefore, Phonak researchers were curious to evaluate the benefits of stereo presentation and spatial enhancement in hearing impaired listeners.
Methodology
Sixteen hearing impaired adults ranging in age from 23 to 81 y (median of 71 y) and eight normal hearing adults ranging in age from 27 to 67 y (median of 35 y) participated in this study. All were native speakers of American English. The hearing impaired participants were experienced hearing aid users. Their audiograms ranged between mild to moderate-severe, with an average PTA value of 56 dB HL. All were symmetric sensorineural losses.
As in the second study, TV streaming was simulated using DAI from the TV stereo headphone output via VST plugins to bilateral Audeo V90 13 RIC devices. However, only one hearing aid program was used in this study, which corresponded to the SlowDRC program of the second study. The NAL-NL2 fitting formula was used for the hearing impaired participants. The normal hearing participants also used the hearing aids, albeit configured with 0 to 5 dB insertion gains. The three binaural presentation modes to be compared were implemented using the Dolby® Media Emulator VST plugin version 1.1 (Dolby Laboratories, Inc.), with additional processing to equalize the RMS levels across the different presentation modes. The presentation level was 60 dB (A) at hearing aid input. The TV speakers were turned off.
The participants rated the following sound attributes:
- Speech intelligibility
- Realism (audio-visual presentation)
- Position of sounds
- Ease of distinguishing locations
- Listening comfort (audio-visual presentation)
The order of the first four attributes was counterbalanced across participants, while listening comfort was rated last by all participants. It has been shown that timbre changes due to spatial enhancement can affect perceived audio quality (Lorho, 2005; Rumsey et al., 2005). However, we decided not to rate timbre, because it would have been very difficult to obtain reliable timbre ratings from naïve listeners.
The clips were the same as used in study #2, and the same user interface was used for the attribute ratings. However, this time, the buttons “A”, “B”, and “C” switched between the different stereo presentation modes while the hearing aid program remained unchanged. The procedures were otherwise similar to those of the preceding studies.
Results
Speech Intelligibility. There was no significant effect of binaural presentation mode on the intelligibility ratings. In particular, the spatial enhancement did not degrade perceived intelligibility compared with stereo presentation, which was a positive outcome given that the spatial enhancement added reverb to the signal (the HRTF had an RT60 of 0.3 s).
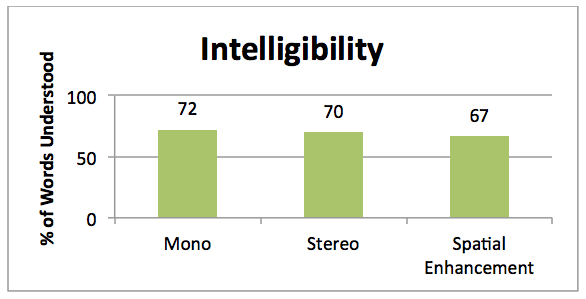
Figure 7. Mean speech intelligibility ratings for the hearing impaired participants. There was no significant effect of binaural presentation mode.
Realism. Participants were instructed to rate whether the scene sounded real, authentic and lifelike, or simulated and artificial. Figure 8 shows their mean ratings. Repeated measures ANOVA were completed for both groups of listeners. There was a significant effect of binaural presentation mode for the hearing impaired group [F (2, 30) =12.59, p=.001] as well as for the normal hearing listeners [F (2, 14) =10.64, p=.002]. A post hoc Tukey analysis revealed that the hearing impaired participants rated both stereo (p=.002) and spatial enhancement (p=.002) as significantly more realistic than mono presentation. The normal hearing participants rated the stereo program as significantly more realistic than the mono program (p=.04). However, there was no significant difference between spatial enhancement and mono presentation. Ideally, both groups would have preferred a high degree of realism.
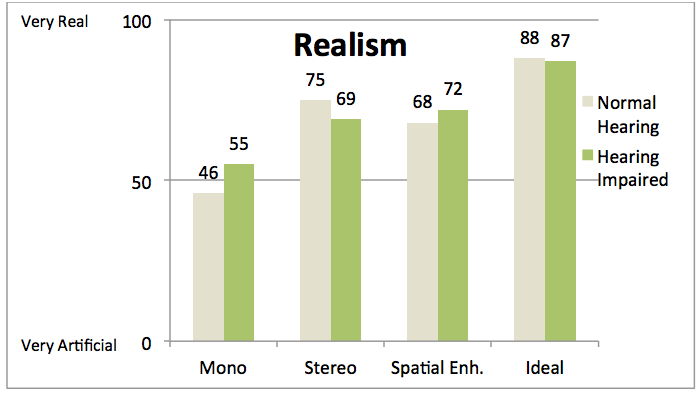
Figure 8. Mean ratings of perceived realism for the hearing impaired and normal hearing participants. The numbers from 0 to 100 have been added in the figure to quantify the mean ratings. Both groups rated mono presentation as least realistic.
Position of sounds. Participants were instructed to imagine that the sounds were coming from virtual loudspeakers and to answer the question where those loudspeakers were placed. The response options were: “I hear the sounds as if loudspeakers were placed in front of me”, “above my head”, “between my ears or in my ears”, “in the center of my head”, or “behind me”. It was clarified that this was not asking about where the sound objects were supposed to be in the film world, but instead, about their actual sensation of the sound. Before the ratings on five TV clips, a test-retest was performed with an artificial dichotic-noise signal. Five of the hearing impaired participants rated the test-retest inconsistently and are therefore excluded from the analysis. All of the normal hearing participants’ test-retest ratings were consistent. This suggests that task understanding may not have been the problem for the five hearing impaired participants who rated inconsistently, but rather that they had difficulty judging the location of the sounds. The ratings are shown in Figure 9. The normal hearing listeners rated stereo most frequently in or between their ears while they rated mono in the center of their heads. The consistent hearing impaired listeners also rated stereo most frequently in or between their ears. However, their mono ratings were less clear, with similar percentages of ‘in the center of their heads’ and ‘in or between their ears’ ratings. For both normal hearing and hearing impaired listeners, spatial enhancement yielded similar position ratings. The percentages of externalized positions (i.e., sounds heard outside of the head) with spatial enhancement were 50% and 49% for the normal hearing and hearing impaired listeners, respectively.
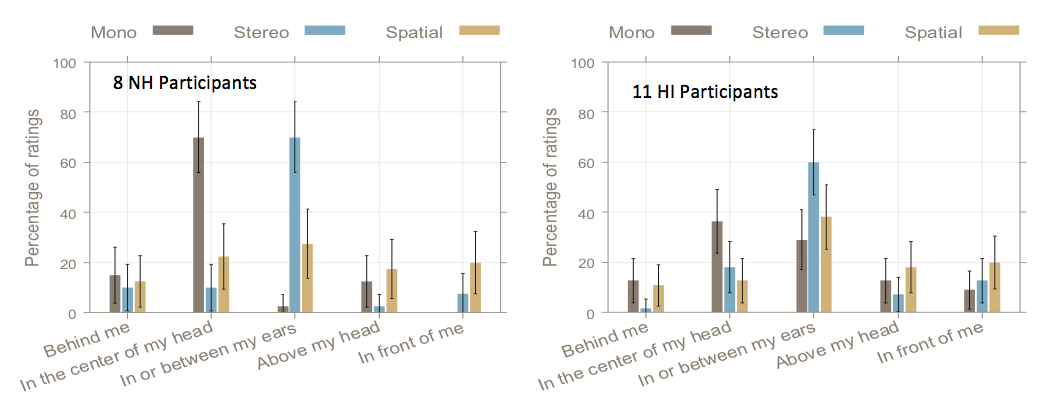
Figure 9. Percentages of position ratings for the eight normal hearing participants and the 11 hearing impaired participants who showed consistent test-retest position ratings. The error bars represent 95%-confidence intervals.
Ease of distinguishing locations. Participants were asked to listen to all sounds, speech, sound effects and music, and to rate how easy it was to distinguish the locations of the sounds. As for the position ratings, a test-retest was performed using band-pass noise stimuli, which changed dynamically in location between left, center, and right. All participants gave consistent test-retest responses. However, five of the hearing impaired listeners and three of the normal hearing listeners rated the ease of distinguishing locations as easy for mono as for stereo presentation, or even easier for mono than for stereo. These ratings were considered not meaningful given that binaural cues were available in stereo but not in mono presentation. Therefore, these listeners were excluded from the analysis. There were significant effects of presentation modes for the remaining normal hearing listeners [F (2, 8) =13.51, p=.003] and hearing impaired listeners [F (2, 18) =8.268, p=.003]. Post hoc Tukey comparisons revealed that the normal hearing listeners found it significantly easier to distinguish locations with stereo than with mono (p=.002) and marginally easier with stereo than with spatial enhancement (p=.05). The hearing impaired listeners found it easier to distinguish locations with stereo than with mono (p=.004) and with spatial enhancement than with mono (p=.013). It remained unclear why both groups of listeners tended to judge the ease of distinguishing locations in mono presentation on average as difficult to moderately difficult while it should have been impossible to distinguish in this mode. They may have been reluctant to admit that it was in fact impossible.
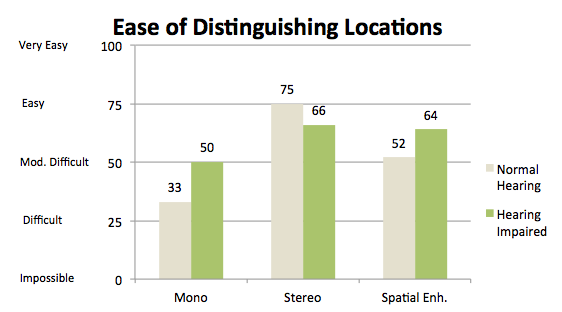
Figure 10. Mean ratings for ease of distinguishing the location of sounds for five of the normal hearing and 10 of the hearing impaired listeners. The numbers from 0 to 100 have been added to the figure to quantify the mean ratings.
Listening comfort. Participants were instructed to imagine that they were going to watch the clips for two hours or more and to rate how comfortable they would be listening for such an extended period with each of the presentation modes. Neither the normal hearing nor the hearing impaired participants showed significant effects of presentation mode on listening comfort. On average, the hearing impaired participants rated all modes very similar in terms of comfort, while the normal hearing participants showed a trend towards higher comfort for stereo and spatial enhancement than mono presentation. However, the lack of an effect of presentation mode on average comfort ratings is only partly representative of the results, as the participants showed a variety of comfort ratings. While four hearing impaired participants rated all modes equally comfortable, five rated mono as less comfortable than stereo and spatial enhancement, four rated mono as more comfortable than stereo and spatial enhancement and three of the hearing impaired participants rated spatial enhancement as least comfortable. Only one of the normal hearing participants rated the spatial enhancement as most comfortable. The observed inter-individual variability can be attributed to the participants rating comfort along different dimensions. Some indicated they rated comfort according to intelligibility, others according to the amount of background noise, or according to realism, spatial separation, timbre, etc.
Discussion and Summary
Hearing impaired people frequently engage in TV and media listening, aided and unaided. Nevertheless, this topic has received only little attention in the research community. To the authors’ knowledge, these are the first studies comparing the benefits of different hearing aid programs for acoustic and streamed TV listening.
From the onset, we decided to use running media clips from films, newscasts, and sports broadcasts so that the studies would reflect real-world listening as closely as possible. Although the clips were chosen to exhibit relatively constant audio contents across their durations, some intrinsic variability remained as these were realistic 60 to 75 second clips. Thus, it was an encouraging outcome that significant differences in the ratings for different hearing aid programs and presentation modes were observed when averaged across participants. This indicates that attribute ratings to running media clips can be used to evaluate assistive processing strategies with hearing impaired participants. The realism of the test paradigm was mirrored by participants’ comments, who pointed out that “this was finally a relevant test” addressing their problems when watching TV.
As a starting point, the first two studies compared three different hearing aid programs using different compression speeds as well as the EchoBlock feature. Speech intelligibility was rated lowest with FastDRC in the first study, in which the clips were presented acoustically, but not in the second study, in which the clips were streamed to the hearing aids. This may reflect the amplification of room reverberation by fast DRC which was not present in the streamed presentation. Of the eight clips used in the intelligibility ratings, the ones featuring British accents, reverberation and whispered dialogue were rated most difficult to understand.
The ratings for dynamics of music and effects in the study with streamed audio presentation revealed an undesirable reduction of dynamics by EchoBlock, with clips sounding more “flat”. On the other hand, the reverberation ratings showed that EchoBlock reduced the amount of reverberation closest to the participants’ average ideal level of reverberation. Furthermore, the source width ratings of the first study indicated a trend for EchoBlock to produce more “pointed” (narrower) sources than the other two hearing aid programs, which was the preferred width for a clip with dialogue. Therefore, EchoBlock may prove beneficial to those who prioritize speech intelligibility but it may not be the optimal choice for those viewers, who, at least sometimes, desire more “powerful” and life-like music or sound effects.
The third study compared different binaural presentation modes; mono, stereo, and spatial enhancement. It was found that speech intelligibility was rated similarly for the three modes, despite the spatial enhancement featuring additional reverberation.
Both the normal hearing and hearing impaired participants rated mono on average as least realistic. There seemed to be a slight trend for the normal hearing participants to rate stereo as more realistic than spatial enhancement. This is consistent with an overall lack of preference of normal hearing listeners for spatial enhancement over stereo in previous studies on spatial enhancement (Lorho & Zacharov, 2004; Lorho, 2005).
With regard to the identification of sound positions as well as ratings of ease of distinguishing locations of the sounds, it proved valuable to include test-retest measurements with artificial noise stimuli, as these localization tasks are very difficult to perform, particularly for naïve listeners. The test-retest measurements allowed us to exclude those participants from the analysis who were not able to give consistent or meaningful ratings of these spatial attributes. Their inability may have been due to difficulties with perceiving sound locations clearly in the first task and a reluctance in the second task to admit that it was in fact difficult or impossible to distinguish locations, for example in mono presentation. However, the sound position ratings by those participants who passed the test-retest were encouraging; both the normal hearing and hearing impaired listeners perceived mono and stereo presentations internalized in their heads (or ears) while spatial enhancement resulted in a considerable percentage of external (outside-of-the-head) locations.
The ratings of listening comfort showed no average effect of presentation mode. An analysis of individual ratings revealed that this was attributable to the participants’ differing interpretations of what constituted comfort, e.g., intelligibility vs. realism, rather than to a general absence of perceived differences between presentation modes. This exemplifies, however, the difficulty of finding a single assistive presentation mode that would suit all viewers and program contents equally well.
There is more work to be done in the area of television and media listening for hearing aid users. These studies have contributed insight into the abilities of hearing aid users to distinguish between different settings and technologies. Knowing the possible benefits or consequences of different settings may help the practitioner when counseling or programming devices for the user. The findings of these studies are just beginning to address the expansive and relatively unexplored territory of television and media listening of the hearing impaired.
References
Bureau of Labor Statistics. (2017, June). American Time Use Summary - 2016 results. Retrieved from: https://www.bls.gov/news.release/pdf/atus.pdf
Dueber, R., & Renken, T. (2014). Survey on wireless technology features and impact on battery use. Hearing Review, 21(3), 42-48.
Hasan, S.S., Chipara, O., Wu, Y-H., & Aksan, N. (2014). Evaluating auditory contexts and their impacts on hearing aid outcomes with mobile phones. Pervasive Health ’14: Proceedings of the 8th International Conference on Pervasive Computing Technologies for Health Care, 126-133.
Lorho, G. (2005, May). Evaluation of spatial enhancement systems for stereo headphone reproduction by preference and attribute rating. Presented at Audio Engineering Society 118th Convention, Barcelona, Spain.
Lorho, G. & Zacharov, N. (2004, May). Subjective evaluation of virtual home theatre sound systems for loudspeakers and headphones. Presented at Audio Engineering Society 116th Convention, Berlin, Germany.
Nielsen. (2017, July). The total audience report: Q1 2017. Available from www.nielsen.com.
Rumsey, F., Zielinski, S., Kassier, R., & Bech, S. (2005). On the relative importance of spatial and timbral fidelities in judgments of degraded multichannel audio quality. J of Acoustical Society of America, 118(2), 968-976.
Strelcyk, O., Singh, G., Standaert, L., Rakita, L., Derleth, P., & Launer, S. (2016, August). TV/media listening and hearing aids. Poster presented at International Hearing Aid Research Conference (IHCON 2016), Lake Tahoe, CA.
Citation
Standaert, S., Rakita, L, & Strelcyk, O. (2017, August). Improving television listening for hearing aid users. AudiologyOnline, Article 20728. Retrieved from www.audiologyonline.com