It is not uncommon for audiologists to encounter patients whose reported hearing difficulties seem misaligned with his or her measured hearing difficulties. For instance, there are those patients who report many problems, despite relatively good speech scores and hearing sensitivity, and there are those who insist their hearing is fine even though their scores and thresholds would suggest otherwise. Generally, we think of these individuals as being "complainers" or "deniers" and likewise tend to assume that it is an attitude issue and that they have the capacity to change. It might, however, be more complex than this. There might be a genuine mismatch between what the patient believes he or she can hear and what he or she can actually hear, i.e. the patient might be misjudging their own hearing ability.
The Performance-Perceptual Test (PPT) was developed specifically to examine this possibility. The PPT is a test of speech in noise which assesses both perceived and actual ability to understand speech in noise by using the same test materials (the Hearing In Noise Test sentences;Nilsson, Soli, & Sullivan, 1994), the same unit of measurement (dB signal-to-noise (S/N)) for both comparisons, and an adaptive testing format,. By comparing measured and perceived ability, we obtain a direct measure of the extent to which individuals misjudge their hearing ability. To assess actual ability, the signal-to-noise ratio (SNR) for 50% correct performance is determined. It is known as the Performance Speech Reception Threshold in Noise (Performance SRTN). The participant listens to the HINT sentences presented at 65 dB SPL in noise and repeats back as much or as little of each sentence as possible. If all keywords in a sentence are repeated correctly, the S/N is made more adverse. If one or more keywords are repeated incorrectly, the S/N is made less adverse. The S/N is altered in 4 dB steps for the first four sentences and in 2 dB steps thereafter. The final Performance SRTN is computed by averaging the S/N for sentences 5 though 20, along with the S/N at which a 21st sentence would have been presented.
To assess perceived ability, the SNR at which participants perceive they can "just understand everything" is obtained, and is known as the Perceptual SRTN. Once again, participants listen to HINT sentences. After hearing each sentence, the participant says either, "Yes, I could understand everything," or, "No, I could not understand everything." If he or she answers "yes," the S/N is made more adverse;if he or she answers "no," the S/N is made less adverse. As for the Performance SRTN, the S/N is altered in 4 dB steps for the first four sentences and in 2 dB steps thereafter. The final Perceptual SRTN is computed by averaging the S/N for sentences 5 though 20 along with the S/N at which a 21st sentence would have been presented. By subtracting the Perceptual SRTN from the Performance SRTN, the Performance-Perceptual Discrepancy (PPDIS) is obtained.
The PPDIS is a measure of the accuracy to which individuals (mis)judge their hearing ability in noise. A negative PPDIS implies the participant selected a less adverse S/N than that at which he or she can actually perform, i.e. the listener underestimates their own hearing ability. A positive PPDIS implies the participant selected a more adverse S/N than that at which he or she can perform, i.e. the listener overestimates their own hearing ability. The definitions of under-, over- and accurate estimation are based on data of Saunders and Forsline (2006b) and Saunders, Forsline, and Fausti (2004) as follows:
- Underestimation: PPDIS
- Accurate: PPDIS between 33rd & 66th percentile of normative data (value> -3 and
- Overestimation: PPDIS> 66th percentile of normative data (value of ≥ +0.2)
Other studies using the PPT have also shown a strong relationship between estimation of hearing ability and reported hearing difficulties. It has been found that individuals who report more handicap than would be expected based upon their audiometric thresholds have a more negative PPDIS than average (i.e. underestimate their hearing), while those who report less handicap than expected based upon their audiometric thresholds have a more positive PPDIS than average (i.e. overestimate their hearing) (Saunders & Forsline, 2006b). Hearing aid satisfaction has also been associated with the PPT. Saunders and Cienkowski (2002) found that the combination of ability to understand speech in noise (Performance SRTN) and accuracy of estimation of hearing ability (PPDIS) explained almost 43% of the variance in subjective ratings of hearing aid satisfaction. Underestimation of hearing ability (negative PPDIS) and poorer ability to understand speech in noise (poorer Performance SRTN) were associated with less hearing aid satisfaction.
How can the PPT be used in the clinic?
In light of the success of counseling individuals with OAD, we hypothesized that similar counseling could be used to help individuals who minimize their difficulties realize they could benefit from assistive devices, as well as improve overall hearing aid satisfaction. To this end, we developed PPT-based counseling designed to take no more than 20 minutes, based on techniques shown to result in positive clinical outcomes. The counseling consists of five components: (1) Provision of information, (2) Suggested Explanations, (3) Subject Exposition, (4) Discussion/Implications and (5) Suggested Solutions. These components were included because studies have shown that patients reporting the greatest satisfaction with their doctor visits were those who were provided with both factual statements from their physician (Provision of Information and Suggested Explanations), along with time during which they could talk with the physician about their illness (Subject Exposition;Gross, Zyzanski, Borawski, Cebul, & Strange, 1998;Jackson, Chamberlain, and Kroenke, 2001;Stiles, Putnam, Wolf, & James, 1979). Consequently, satisfied patients better adhere to treatment plans (Lochman, 1983) and have better overall health-related outcomes (Kaplan, Greenfield, & Ware, 1989) than dissatisfied patients. Further, the Health Belief Model of Rosenstock (1966) has shown that individuals are more likely to take health action if they perceive that the condition has consequences (Discussion/Implications) and that the barriers to taking action can be overcome effectively (Suggested Solutions).
Counseling begins with an explanation of the audiogram and the implications it has for understanding speech. The patient's thresholds are plotted using the speech banana audiogram in Figure 1 and described in detail.
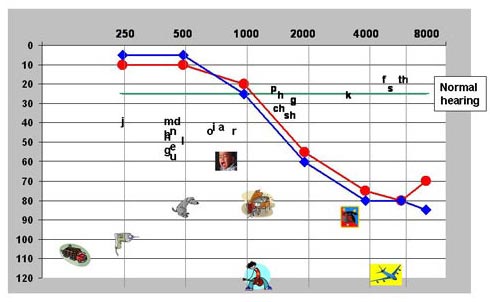
Figure 1. 'Speech banana' audiogram with example thresholds
Second, the patient is shown his or her Performance SRTN scores for unaided and aided listening in relation to those of young and older individuals with normal hearing. We explain to the patient that even normal-hearing older individuals have more difficulty understanding speech in noise than younger people, and we show the patient how much hearing aid benefit they are receiving. Figure 2 is an annotated version of the figure given to patients. The remainder of the counseling is associated with the patient's PPDIS (as shown in Figure 2).
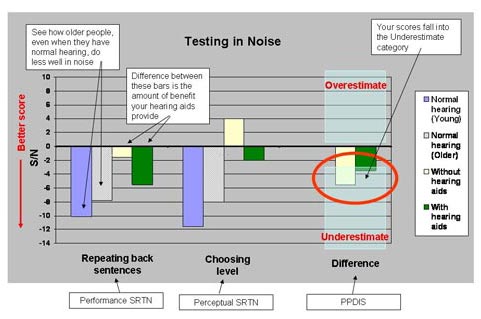
Figure 2. Annotated version of PPT scores graph shown to patients
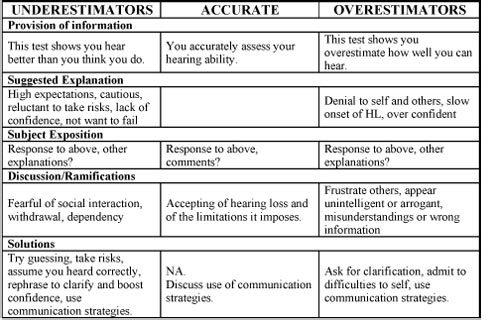
We explain first to patients whether their PPDIS value suggests that they underestimate, overestimate or accurately assess their hearing ability. Second, we provide them with possible explanations as to why they might be doing this. We then ask whether they agree with our interpretation and to offer their own interpretations and explanations. We next point out the possible ramifications of under- or over-estimating, and finally we provide suggestions for how they can address these possible changes. Table 1 shows the counseling content in greater detail.
Click Here to View Larger Version of Table 1 (PDF)
Table 1. Content of the PPDIS counseling for each group.
We have recently completed a study comparing PPT-based counseling with informational counseling only. The informational counseling consists only of the initial steps of the PPT-based counseling. That is, we explain the audiogram and the implications it has for understanding speech using the speech banana audiogram, we show the patient his or her Performance SRTN scores for unaided and aided listening in relation to those of young and older normal-hearing individuals, and then discuss measured hearing aid benefit. Study participants are all experienced hearing aid users who are dissatisfied with their hearing aids. They each attend two study visits. At the initial visit they complete, as appropriate, the Hearing Handicap Inventory for the Elderly (HHIE;Ventry and Weinstein, 1982) or Adults (HHIA;Newman, Weinstein, Jacobson, & Hug, 1990) and the PPT. Participants are then randomly assigned to receive either PPT-based counseling or informational counseling. Following counseling they leave the laboratory. At that time they are instructed to do what they wish with the information we have provided. They are not given guidelines regarding expected hearing aid use. Eight weeks later they return for a follow-up visit. At this time they complete the PPT once again and undergo an exit interview to find out what they thought of the counseling process, their hearing aids, and our interpretation of their PPT scores. Preliminary study findings have been published by Saunders and Forsline (2006a);a manuscript describing the complete data is in preparation. Here we show three case studies that illustrate how counseling can be used effectively in the clinic.
Case 1 is a 61-year old man with moderate, flat sensorineural hearing loss, likely due to military noise exposure over a 20-year period, occupational noise exposure (post office sorting machines) and recreational exposure to loud music (see Figure 3). He reports that he obtained hearing aids about eight years ago and that he currently wears them full time. At his initial study visit he reported finding the hearing aids useful for conversations in quiet, but not when communicating in the car, at restaurants or in his office cubicle at work. He said he became frustrated with the hearing aids at home when he could not hear his wife speaking, even when she was in the same room. He obtained a score of 50 points on the HHIA. According to Newman and colleagues (1990), this is average for people with this individual's pure-tone average.
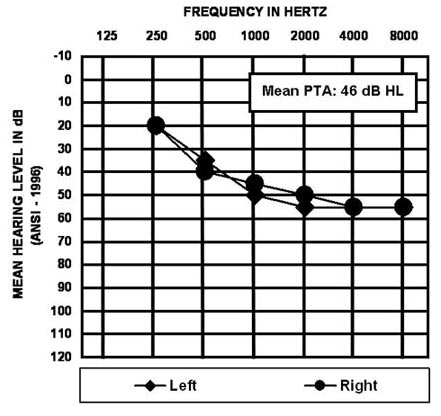
Figure 3. Case 1 audiogram
Figure 4 shows this man's unaided and aided PPT scores (tan bars and green bars, respectively), along with those of young and older normal hearing adults (purple bars and grey bars, respectively). It is seen that his Performance SRTNs are poorer than those of normal hearing individuals. A comparison of his unaided and aided Performance SRTNs shows that he obtains hearing aid benefit resulting in an improvement of approximately 4 dB S/N. According to Nilsson et al (1992), this is equivalent to an increase in score of about 40%. He selected S/Ns for the Perceptual SRTNs that were less adverse than his Performance SRTNs for both unaided and aided listening. This can be seen more easily by examining the PPDIS values on the right-hand side of the figure, both of which fall into the Underestimator category.
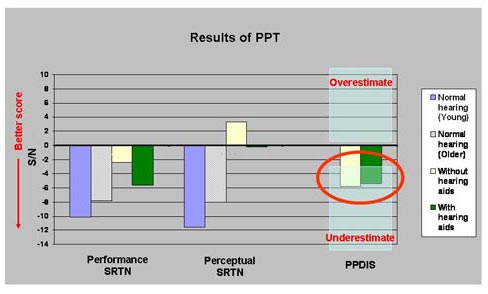
Figure 4. Case 1 PPT scores at initial visit with normative data
This man was counseled using the strategies for underestimators. In addition, we explained that, contrary to his perceptions, he did obtain benefit from his hearing aids when listening in noise. He left the laboratory and returned eight weeks later for his follow up visit.
Figure 5 shows this man's follow up PPT scores (filled tan bars and filled green bars) along with his scores obtained at his initial visit (hatched tan bars and hatched green bars). His Performance SRTNs remained unchanged, while his Perceptual SRTNs changed substantially, such that he now selected S/Ns that were more adverse than before. This is better illustrated by the PPDIS values, which consequently moved from the Underestimator category to the Accurate category.
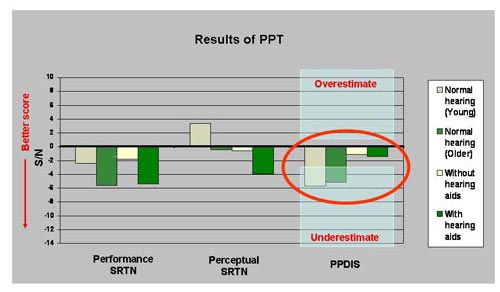
Figure 5. Case 1 unaided and aided PPT results from initial and follow-up visits
During his exit interview, this man reported that he thought his hearing with the hearing aids had improved a little, that the hearing aids were providing more help than he initially thought they were, and that he now valued the hearing aids more. He said that he now paid more attention to hearing and listening, and that he thought his wife had become more communicative because she felt she could talk to him more freely. He reported finding the explanation of his hearing thresholds in relation to the speech banana very useful, both for himself and when explaining his difficulties to his wife, and that he generally agreed with our interpretation of his scores.
Case 1 Interpretation
At the start of the study, this man reported that his hearing aids did not provide help when listening in noise;however, his Performance SRTNs showed this not to be so. In fact, he obtained a 4 dB S/N benefit. This mismatch between his perceived and measured aided performance is in line with the finding that he underestimated his hearing ability. Following PPT-based counseling and eight weeks of additional hearing aid use, this individual reported that he now found the hearing aids helpful when listening in noise and that his ability to hear with them had improved, yet there was no measurable change in his Performance SRTN (nor was a change expected because the hearing aid settings had not been adjusted). Simultaneous with this perceived change in aided ability came a change in his PPDIS, which shifted from the Underestimator category to the Accurate category. Our interpretation of these findings is that this individual internalized the information he was given regarding hearing aid benefit and underestimation of hearing ability, which resulted in his being more accurate at judging his hearing. Furthermore, he was able to become aware of the benefit he was obtaining from his hearing aids.
Case 2 is a 62-year old man with a mild to severe sloping sensorineural hearing loss (see Figure 6). He reports having owned hearing aids since the early 1970's, but wearing them inconsistently, perhaps three to four times a week for a few hours each time. He reasons that he "does just fine" without them and that they are not especially effective. He reports finding the hearing aids useful for meetings and small dinner parties, but not at all useful when in noise, in restaurants and auditoriums. He says he gets frustrated when he doesn't catch the beginning of a sentence, and wishes people would get his attention before starting to speak. His HHIA score was 50, which according to Newman and colleagues (1990), is about average for his PTA. Interestingly, however, he rates his unaided hearing ability as being 72/100 and his aided hearing as 95/100, which, given his pure-tone thresholds, is somewhat surprising.
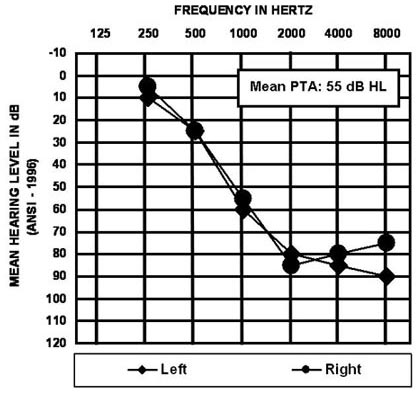
Figure 6. Case 2 audiogram
Figure 7 shows this gentleman's unaided and aided PPT scores for initial testing and at follow-up eight weeks later. At his initial visit (hatched bars) his aided and unaided Performance SRTNs are seen to be considerably poorer than normal (compare with Figure 2), but comparison of his unaided and aided scores shows he obtains about 6 dB of hearing aid benefit. His unaided PPDIS falls into the Overestimator category, while his aided PPDIS falls into the Accurate category.
He was given PPT-based counseling for overestimators and shown his Performance SRTNs, which revealed that his hearing aids were helping him understand speech in background noise. We also mentioned that his hearing in noise was poorer than normal, even with the hearing aids.
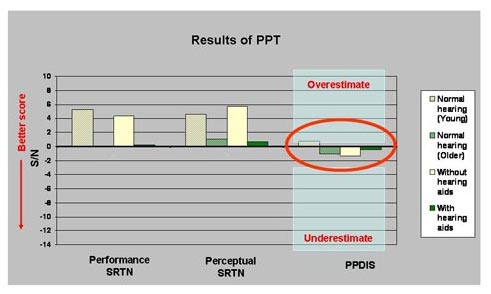
Figure 7. Case 2 unaided and aided PPT results from initial and follow-up visits
At follow-up his Performance SRTNs and aided PPDIS remained unchanged, while his unaided PPDIS moved from the Overestimator category into the Accurate category. During the exit interview, the patient informed us that he had been wearing his hearing aids much more than in the past, and that his ability to hear with them had improved significantly. He said this was because our testing had provided him with evidence that they were indeed effective. He acknowledged feeling that he had more control of his hearing loss when he wore his hearing aids on a regular basis. He also felt wearing the hearing aids had resulted in a more positive attitude towards them. He was now findings the hearing aids quite helpful at work and said that he thought both his wife and boss could communicate better with him now. He added that he had gained confidence in his ability to hear and to respond to others correctly.
Case 2 Interpretation
At the start of the study, this patient rarely used his hearing aids, because he felt they did not help him, and because he believed he "did just fine" without them. This belief is reflected in his unaided hearing rating as 72/100. In light of his hearing sensitivity (PTA = 55 dB HL), and as evidenced from his unaided and aided Performance SRTNs, he in fact performs considerably poorer than normal (his aided Performance SRTN is 8 dB S/N worse than average for older persons with normal hearing). It is not surprising, therefore, to find that his unaided PPDIS shows him to overestimate his hearing ability. Following counseling for overestimators and eight weeks additional hearing aid use, this individual reported at this follow up visit that he was using his hearing aids "a lot more" and "on a steadier basis," and that he thought his ability to hear with his hearing aids had improved. This was not reflected in his Performance SRTNs, but, since the hearing aid settings had not been adjusted, a change in performance was not expected. We propose that this individual perceived his aided hearing had improved because he had seen evidence that his aided Performance SRTNs were better than his unaided Performance SRTNs, and because the counseling for overestimators had prompted him to think about whether he was really hearing "just fine" without hearing aids. It is also likely that through increased hearing aid use he was adjusting to the aided output, where previously he had simply dismissed the aids altogether.
Case 3 is a 58-year old man with mild-to-moderate gradually sloping sensorineural hearing loss (see Figure 8), likely a result of noise exposure following four years of working on an aircraft carrier during military service. He reports having owned hearing aids for the past 10 years, which he says he wears about 3-4 hours a day, 5 days a week. He reports finding the hearing aids helpful in meetings and at small social gatherings, but not when noise is present. He gets frustrated with them in the car, at restaurants and at other social venues. His HHIA score was 96 points. According to Newman et al (1990), the average HHIA score for individuals with his pure-tone average is about 50 points,. Thus, he is reporting considerably more hearing handicap than expected based on his hearing sensitivities.

Figure 8. Case 3 audiogram
Figure 9 shows this gentleman's PPT scores for both his initial visit (hatched bars) and at follow-up eight weeks later (solid bars). At his initial visit, his Performance SRTNs were poorer than those of normal hearing individuals (compare with Figure 2), but he was obtaining hearing aid benefit of approximately 4 dB S/N, or 40%. His initial PPDIS values fell in the Accurate category.
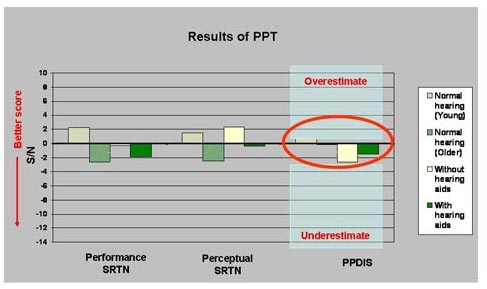
Figure 9. Case 3 unaided and aided PPT results from initial and follow-up visits
This individual was given PPT-based counseling for Accurate assessment of hearing. We also explained that, contrary to his perceptions, he obtained substantial hearing aid benefit for listening in noise;however, it was acknowledged that even in an aided condition, he did not do as well as individuals with normal hearing in noise. He left the laboratory and returned eight weeks later for his follow-up visit.
At follow-up, this individual's unaided Performance SRTN showed an improvement, and his PPDIS values remained within the accurate category. During the exit interview, the patient reported that he had been wearing his hearing aids substantially more during the previous eight weeks than ever before, and that he felt his hearing with the hearing aids had improved. He reported that he had been consciously applying the communication strategies we had described, and that he had asked his family to use them, also. He said this was proving helpful to all. He also mentioned that had become more aware of his abilities and limitations. He reported finding the explanation of his hearing thresholds in relation to the speech banana very useful for himself, and for explaining his difficulties to his wife and daughters.
Case 3 Interpretation
At the start of the study, this man reported that his hearing aids did not provide help when in noise, and his HHIA score was considerably higher than normative data would predict based on his hearing sensitivities. His Performance SRTNs showed that he did indeed perform more poorly in noise than normal hearing individuals, but that he did obtain about 4 dB S/N hearing aid benefit - at least as measured using the Performance SRTN. Following PPT-based counseling and eight additional weeks of hearing aid use, this individual reported voluntary increased hearing aid use, that the aids were proving very helpful in communicating with family, and that communication was enhanced though use of the communication strategies we had described. We suggest that this individual's change in perception was due to the combination of his being made aware of the benefit he was obtaining from his hearing aids along with advantages resulting from his use of communication strategies. His unaided Performance SRTN at follow-up unexpectedly improved. It is unlikely he was able to apply communication strategies during laboratory testing, so this change in score might reflect differences in the HINT lists, or inconsistent test performance on the part of the participant. As desired, his PPDIS values remained unchanged, staying within the Accurate category.
These three case studies illustrate that the PPT can be used successfully as a counseling tool to increase hearing aid use and to help patients understand their hearing abilities and limitations. We do not suggest that PPT-based counseling is universally appropriate or effective. Some of the study participants completely dismissed our interpretation of their scores, while others whose PPDIS values and/or behaviors did not change at the follow-up appointment welcomed our guidance. However, in light of the fact that additional information and education may be advantageous, we suggest that, if time permits, the PPT should be used with all patients. The PPT itself takes approximately 15 minutes in total to administer, and requires a HINT system, a 2-channel amplifier and two loudspeakers. The PPT-based counseling takes about 10 minutes, and requires the clinician to enter the patient's audiogram and PPT scores into an Excel spreadsheet. We also advocate giving patients a hard copy of the speech banana audiogram and the PPT graph for several reasons. First, patients often have difficulty recalling all aspects of the session as they are provided with a wealth of information in a short time. By providing hard copies of the materials, it removes the stress for the patient during the visit of having to remember everything. It also provides patients a reminder of what they were told for when they leave the office, and enables them to more easily share the information with their families and communication partners.
References
Gross, D., Zyzanski, S., Borawski, E., Cebul, R., & Strange, K. (1998). Patient satisfaction with time spent with their physician. The Journal of Family Practice, 47(2), 133-137.
Jackson, J., Chamberlain, J., & Kroenke, K. (2001). Predictors of patient satisfaction. Social Science and Medicine, 52, 609-620.
Kaplan, S., Greenfield, S., & Ware, J. (1989). Assessing the effects of physician-patient interactions on outcomes of chronic disease. Medical Care, 27, S110-127.
Lochman, J. (1983). Factors related to patient satisfaction with their medical care. Journal of Community Health, 9, 91-109.
Newman, C., Weinstein, B., Jacobson, G., & Hug, G. (1990). The Hearing Handicap Inventory for Adults: Psychometric adequacy and audiometric correlates. Ear and Hearing, 11, 430-433.
Nilsson, M., Gelnett, D., Sullivan, J., Soli, S., & Goldberg, R. (1992). Norms for the Hearing in Noise Test: The influence of spatial separation, hearing loss, and English language experience on Speech Reception Thresholds. Journal of the Acoustical Society of America, 94(4, pt. 2), 2291-2385.
Nilsson, M., Soli, S., & Sullivan, J. (1994). Development of the Hearing in Noise Test for the measurement of speech reception thresholds in quiet and in noise. Journal of the Acoustical Society of America, 95(2), 1085-1093.
Rosenstock, I. (1966). Why people use health services. The Milbank Memorial Fund Quarterly, 44 (S3), 94-127.
Saunders, G. (1989). Determinants of Objective and Subjective Auditory Disability in Patients with Normal Hearing. MRC Institute of Hearing Research, University of Nottingham, Nottingham.
Saunders, G., & Cienkowski, K. (2002). A test to measure subjective and objective speech intelligibility. Journal of the American Academy of Audiology, 13, 38-49.
Saunders, G., Field, D., & Haggard, M. (1992). A clinical test battery for Obscure Auditory Dysfunction (OAD): Development, selection and use of tests. British Journal of Audiology, 26 33-42.
Saunders, G., & Forsline, A. (2006a). The Performance-Perceptual Test (PPT) and its application to hearing aid counseling. The Hearing Review, 13(13), 18-25.
Saunders, G., & Forsline, A. (2006b). The Performance-Perceptual Test (PPT) and its relationship to aided reported handicap and hearing aid satisfaction. Ear and Hearing, 27(3), 229-242.
Saunders, G., Forsline, A., & Fausti, S. (2004). The Performance-Perceptual Test (PPT) and its relationship to unaided reported handicap. Ear and Hearing, 25, 117-126.
Saunders, G., & Haggard, M. (1992). The assessment of 'Obscure Auditory Dysfunction' (OAD) - 2. Case-control analysis of determining factors. Ear and Hearing, 13, 241-254.
Stiles, W., Putnam, S., Wolf, M., & James, S.A. (1979). Interaction exchange structure and patient satisfaction with medical interviews. Medical Care, 17, 667.
Ventry, I., & Weinstein, B. (1982). The Hearing Handicap Inventory for the Elderly: A new tool. Ear and Hearing, 3, 40-46.