Understandably, much of the focus related to the fitting of hearing aids centers on the core digital technology and the advanced algorithms for special signal processing. The amplified signal needs to have a pleasant and undistorted reproduction of speech and environmental sounds that vary significantly in input.
The product must also provide noise reduction, feedback suppression, and other signal processing that improves patient benefit. A factor, however, related to patient benefit and satisfaction which is sometimes overlooked, is the gain and output programming of the instrument. That is, how is patient specific information used to program the hearing aids to assure maximum performance? How important is this? It recently has been shown that if programming is conducted in a haphazard manner, today’s modern high-end products may perform significantly worse than old single-channel analog instruments for understanding speech in background noise (Leavitt & Flexer, 2012).
It is possible that, decades ago, an experienced clinician could have set the hearing aid’s gain and output for a given patient fairly appropriately by using the patient’s audiogram, some simple math, and subjective comments from the patient. That was because the hearing aids were linear, did not have special features, and had very few adjustments other than overall gain.
Things are much different with today’s hearing aids, and this was summed up nicely by Johnson (2012) in a recent article. His example is for fitting a 16-channel instrument. He points out that even if you are an experienced clinician and know that the “best” frequency response falls within a 20 dB window for each key frequency, you will still have 1,430 different frequency responses from which to choose! And that is just for one input level—multiply that number by all the input levels important for the patient. Clearly, we need a prescriptive fitting approach as a starting point. While there seems to be considerable focus on smartphone connectivity and other streaming technologies today, we cannot forget that core audiologic properties must continue to receive significant attention in the development of new processing platforms.
History
Determining the best gain and output scheme based on the patient’s hearing loss is not a new consideration in the fitting of amplification. The concept of “selective amplification” dates back to the early days of vacuum tube hearing aids. Watson and Tolan discussed prescriptive fitting methods in their 1949 textbook. As reviewed by Mueller (2005), there have been 30 or more different published prescriptive formulae since then. Some have been named after people (e.g., Berger, Bragg, Libby, Lybarger, Shapiro, Victoreen) and others named after places (e.g., Cambridge, Central Institute for the Deaf [CID], Memphis State University [MSU], and National Acoustic Laboratories [NAL]). The name of a few describe what the method does, or attempts to do: the Desired Sensation Level (DSL), the Prescription Of Gain and Output (POGO), and the method of Robyn Cox that was part of the Independent Hearing Aid Fitting Forum (IHAFF), the Visual Input/Output Locator Algorithm (VIOLA). One method, developed by Mead Killion, was simply named after a figure from a journal article—“FIG6” (Mueller, 2005).
Today in the United States, two methods have emerged as the defaults for clinical use: the NAL-NL2 and the DSLv5. In general, over the years these two methods have considered several factors in their development: appropriate audibility, loudness restoration, loudness equalization, sound quality, listening comfort, and perhaps most importantly, speech intelligibility for both quiet and noisy listening conditions. So while the strategy behind the two methods is somewhat different, what we have today for both algorithms is a reasonable combination of the critical factors for patient benefit, and these methods have been validated.
Manufacturer’s Proprietary Fittings
To this point we have discussed the “generic” prescriptive methods, but it is also possible that hearing aid manufacturers might have a preferred method—either a modification of one of the generic methods, or an algorithm developed with a somewhat different fitting goal in mind. The history of manufacturers having their own prescriptive fittings for hearing aids goes back nearly as far as prescriptive fittings themselves. Consider that Sam Lybarger’s time-honored “1/2 gain rule” was first published by his employer, Radioear Corporation, in 1957. When custom hearing aids became popular in the 1980s, it was common for dispensers to simply mail an audiogram to the manufacturer, and the manufacturer would then select the instrument’s gain and output based on what they thought was best.
Once digitally-programmable hearing aids became common in the early 1990s, it was much easier for manufacturers to provide dispensers the option to program the hearing aids according to the manufacturer’s recommended settings. Today, most manufacturers have their own fitting method, and the manufacturer’s proprietary gain and output algorithm easily can be programmed for the patient with a few simple mouse clicks. In some cases, the instruments are mailed to the dispenser already programmed for the patient-specific settings.
Given the history of success for both the NAL and DSL fitting methods, and the relative ease that hearing aids can be programmed today to one of these settings, one might question why manufacturer’s proprietary prescriptive fittings are needed? There are several reasons. Many of them relate to the specific processing of a given product.
For example, the compression release time for automatic gain control for input (AGCi) can significantly affect the spectrum of the amplified speech signal. When speechmapping is used for verification, what might be a perfect match to the NAL-NL2 ear canal speech-input target (dB SPL) for a hearing instrument with 50 msec release time might not be an acceptable match to these targets if the compression release time was several seconds. The number of channels for AGCi and the interaction of these channels also can impact hearing aid output. Various correction factors, such as microphone location effects and binaural summation, can vary as a function of the instrument and the signal processing. It is much easier for the manufacturer to account for all these processing variables using a proprietary algorithm.
Another reason for developing a proprietary algorithm might be that the general philosophy regarding the desired fitting differs somewhat from the generic algorithms available. Many dispensers have reported that the gain prescribed by both the NAL-NL2 and the DSL5, especially for the high frequencies, is more than preferred by many patients, especially new hearing aid users. The concern is that while the prescribed gain may ultimately provide good speech understanding, if the patient has an initial negative reaction, he or she may not use the hearing aids long enough to realize this benefit. These dispensers prefer to initially start the patient using a fitting method that has good “first acceptance.” Manufacturers, therefore, have tried to accommodate this request from the market, and for this reason, most all proprietary algorithms, regardless of manufacturer, call for less gain than the published generic methods (Mueller, 2014).
Best of Both Worlds?
As mentioned, providing appropriate audibility, which usually leads to improved speech understanding, is an important component of a hearing aid prescription. On the other hand, the fitting must also have good sound quality, and be “acceptable” to the user. Is it possible to accomplish all these goals?
When Siemens introduced the micon platform in 2012, the micon fitting algorithm also was developed. This was a departure from the previous Siemens proprietary fitting, particularly designed to accomplish the goals stated above. An important component of this processing is a unique compression system with several level meters that operate sequentially, resulting in gain and compression time-constants based on the fluctuations detected in the soundscape.
Powers and Beilin (2013) recently reported on research with the new micon fitting algorithm. This was a comparative study focused on preference ratings. The premier hearing aid of the five other major manufacturers was compared to the Siemens micon. All devices were fitted to the given manufacturer’s proprietary fitting for a mild-to-moderate hearing loss (IEC-N3 audiogram; 35 dB in the low frequencies sloping to 65 dB in the high frequencies), with an additional music program added. The hearing aids were rated by the hearing-impaired listeners on a bi-polar “like-least” to “like-most” scale, using a MUSHRA (multiple stimuli with hidden reference and anchor) methodology. Both listening effort and quality ratings were conducted for several conditions including speech in quiet, in noise, in several environmental background scenarios, and also for music. At the conclusion, ratings were averaged among conditions to obtain an overall preference rating. For both listening effort and overall preference, the ratings for the micon fitting were either equal to or superior to the ratings for all the other manufacturers (Powers & Beilin, 2013).
While it was encouraging to see the superior performance for the micon fitting in these comparisons, it is important to point out that the competition was the proprietary fitting of the other manufacturers, not a validated prescriptive method such as the NAL. The next logical step, therefore, was to conduct head-to-head comparisons for the micon fitting to the NAL-NL2 algorithm, and that was the purpose of the present investigation.
Research Methods
The purpose of this study, conducted at an independent research site, Vanderbilt University, was to obtain behavioral comparative judgments from hearing-impaired individuals when they were fitted with hearing aids programmed to two different prescriptive methods. In particular, we were interested in preference judgments based on overall sound quality, speech clarity, and listening comfort.
Participants
Twenty adult (56-80 years; mean=69 years), experienced, hearing aid users participated (10 male/10 female). These individuals had mild to severe bilaterally symmetrical downward-sloping sensorineural hearing loss with pure tone averages (PTAs; 500, 1000, 2000 Hz) ranging from 25-58 dB (mean=44 dB). Hearing aid experience ranged from approximately 8 months to 10 years (median=4 years). Figure 1 shows the average and range of thresholds for each ear.
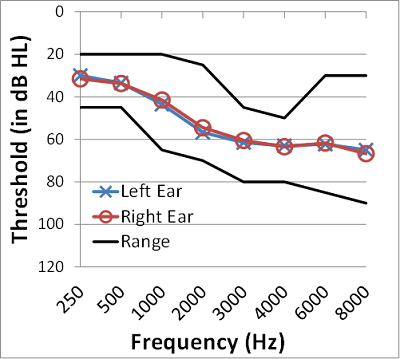
Figure 1. The mean audiogram and the range of hearing loss for the right and left ears for the 20 participants in this study.
Hearing Aid Fitting
Participants were fitted with Siemens Pure 7mi receiver-in-the-canal (RIC) instruments with click-dome coupling in sizes appropriate for each individual’s degree of hearing loss. Probe-microphone measures were obtained using the Verifit system with the male speech signal (commonly referred to as the “carrot passage”) as the stimulus. This stimulus was presented at input levels of 55, 65 and 75 dB SPL.
The hearing instruments were programmed to the micon proprietary processing strategy, and this was stored in Program 1. The real-ear output for the speech signal was recorded, but no modifications to this initial micon fitting were made. Program 2 utilized the same automatic features as Program 1, but the real-ear output settings were adjusted to provide a best match to NAL-NL2 targets for the three speech input levels. This was accomplished by first matching output to prescriptive targets for speech presented at 65 dB SPL. This was followed by checking the fitting for soft (55 dB SPL) and loud (75 dB SPL) speech and modifying the gain/compression parameters to optimize the fit for these inputs while minimally affecting the match to target at 65 dB SPL.
On average, for average speech levels (65 dB SPL), the micon fitting algorithm provided similar output to that prescribed by the NAL-NL2 formula over the frequency range of 250-3000 Hz, and less high-frequency output at 4000 and 6000 Hz. This deviation from high-frequency NAL-NL2 targets increased for softer speech in the 3000-4000 Hz region.
At the higher speech level (75 dB SPL), the Micon fitting provided more output than NAL-NL2 prescription in the mid-frequency region (1000-3000 Hz) and less output than NAL-NL2 prescriptions at higher (6000 Hz) and lower (250 Hz) frequencies.
Procedures
The comparative paradigm was sound-quality judgments of speech and music in six listening conditions. Each condition had 10 trials—that is, the participant would make a forced-choice (A versus B) preference judgment for the same sample 10 consecutive times. In a given listening condition, judgments were made among one to three sound quality characteristics; the specific sound quality characteristic varied depending on the stimulus type (speech, music, or both).
There were three speech conditions: Speech in quiet, speech in a +15 dB SNR and a +5 dB SNR. In each speech condition, participants made preference judgments based on a) overall sound quality, b) speech clarity, and c) listening comfort. This resulted in a total of 90 comparisons (3 listening conditions x 3 qualities x 10 trials).
There were two music conditions: Instrumental music and vocal music. In both music conditions, participants made preference judgments based on a) overall sound quality for music and b) naturalness of the music. This resulted in a total of 40 comparisons (2 listening conditions x 2 qualities x 10 trials).
Finally, the participants made an “All-Day” preference based on sequential presentation of short speech and music audio clips from the prior five listening conditions. Using this combined stimulus, 10 comparisons were made in response to the question, “Which would you prefer to listen to all day- A or B?”
Across all conditions and qualities, a total of 140 comparisons were made with each participant. Further details of the materials used are contained in Appendix A.
In each condition, participants listened to the test stimuli while fitted bilaterally with the hearing aids. Program 1 of the hearing aid contained the micon fitting while Program 2 contained the verified NAL-NL2 fitting. The starting program for testing was randomized across conditions and participants. Participants heard the test stimuli with the hearing aids in either Program 1 or 2. Then the program was changed and they listened to the same stimuli again. After listening to the second presentation, participants were asked if they preferred the first or second trial. Their preference was recorded, and the hearing aids were then reset for the next comparison. This was repeated until 10 preference judgments had been made for a given listening condition.
Data Analysis
Two analysis methods were used. First, to examine the effect of prescriptive fitting (micon fit versus NAL-NL2 fit) on preference for our various sound quality dimensions we used a generalized estimating equation (GEE) approach. This approach allows us to examine the binary preference data across our various quality domains and conditions using a repeated measures approach (similar to an ANOVA but more appropriate given the binary nature of our data and the non-normal distribution of responses). We also used simple binomial analysis to examine preferences at the individual level. That is assuming no difference between the micon (1) and NAL-NL2 (0) fittings in any of our test conditions, so the mean preference rating should be 0.5. We used binomial analysis to test whether individual preferences differed from 0.5.
Results
Overall Findings
The results for the ratings of the two different prescriptive algorithms were analyzed. The GEE analysis showed no main effect of preference for the micon or the NAL-NL2 fitting. Likewise, there were no significant differences in preference judgments across any sound quality dimension (overall speech quality, clarity or comfort; overall music quality or naturalness; all-day preference) or test condition (speech in quiet or noise; vocal or instrumental music; all-day stimulus-combined speech and music). There also was no significant interaction between sound quality and condition.
Individual Participant Analyses
Although, on average, there was no consistent preference for either prescriptive fitting approach, some individual participants had a consistent preference for one fitting strategy over the other. That is, some participants consistently selected the micon fitting while others consistently selected the NAL-NL2 fitting. Recall that there were 10 trials of the same test stimuli—a given participant therefore could possibly prefer one of the fittings 10 out of 10 trials, suggesting a strong preference. In agreement with the overall data, a binomial analysis including preference ratings across all test conditions (140 trials) revealed that four participants did not have significant preferences for one algorithm, and the other 16 were essentially equally divided between the micon fitting and the NAL-NL2 algorithm (7 versus 9 respectively).
Consistency of preference was assessed using a correlational approach. Mean preference ratings (out of 10 trials) for each participant in a given condition were correlated with preference ratings from other test conditions (e.g., speech in quiet-overall quality and speech in +5 dB SNR). Preference ratings across all conditions were significantly correlated (no correction for multiple comparisons was applied).
This suggests that preference for one of the two hearing aid processing algorithms was relatively consistent across multiple listening conditions in this study. In other words, there was not a trend for the listeners to specifically prefer NAL or micon-fit for music, and then the opposite algorithm for understanding speech.
Discussion
The purpose of this research was to determine how the new Siemens micon fitting algorithm would compare to the more established NAL-NL2 for a variety of listening conditions. Overall, average group findings revealed that there were no significant differences between the two fitting strategies. However, this similarity for group data was not because the majority of the participants did not distinguish a difference, but rather because some preferred the NAL-NL2 and an equal number preferred the micon fitting.
In an attempt to identify factors that may influence preference for a given processing strategy the following factors were input as covariates into the GEE analysis: bilateral pure tone average, patient’s age, duration of hearing aid use, and a value representing the difference between the real ear output for the micon NAL-NL2 fittings. These later differences were calculated for two frequency ranges: low (average difference at 500, 1000 and 2000 Hz) and high (average difference at 3000, 4000 and 6000 Hz) frequencies. A correlation analysis of relationships between these deviations (high and low frequencies were analyzed separately) as a function of speech input level (55, 65 or 75 dB SPL) revealed they were highly correlated (correlation coefficients ranged from 0.795 to 0.939, p<0.001). Therefore, we averaged the deviations across input levels to create a single low- and high-frequency deviation (difference) variable to reflect individual differences in the micon and NAL-NL2 fittings.
These preliminary analyses revealed no effect of PTA, age, duration of hearing aid use or difference between high-frequency real-ear output for the micon and NAL-NL2 fittings. One factor, however, did show a significant finding. The difference between low-frequency real-ear output was associated with preference judgments (collapsed across all qualities and conditions). Specifically, individuals for whom the micon fitting provided substantially less low-frequency output than the NAL-NL2 tended to prefer the NAL-NL2 fitting. In contrast, individuals for whom the micon fitting provided substantially more low frequency output than NAL-NL2 tended to prefer the micon fitting. In other words, preferences favored the fitting with the most low-frequency output.
Complicating the interpretation of this finding regarding the significance of low-frequency gain is the fact that the NAL-NL2 method was verified with probe-mic speechmapping, and the hearing aids were then adjusted to match prescriptive targets. No probe-mic verification was conducted for the micon fit, as ear canal SPL speechmapping targets are not available. Then consider that the software-calculated gain applied in the low frequencies is partially determined by the tightness of the earmold coupling used in the fitting.
For example, if the examiner selects “tight dome,” the software will assume minimal venting and apply the appropriate low-frequency gain. However, if the dome fitted truly is not tight in the earcanal, there will be more venting than predicted and less gain than desired. Moreover, it is possible that the probe tube itself might have increased the slit leak for the dome. All this would have been corrected during the verification process with the NAL-NL2, as during speechmapping it would have been apparent that more low-frequency gain was needed.
As we have mentioned, part of the rationale behind the development of the micon algorithm is to have a prescriptive fitting method that has good “first acceptance” to the patient and excellent sound quality, while still maintaining appropriate audibility. When real-ear measures were conducted in this present study, we found that the micon prescriptive method did call for slightly less gain in the higher frequencies than the NAL-NL2. If this were to have a negative effect, we would expect it to be revealed in the speech-in-noise comparisons. While overall findings did not show a significant difference, we wanted to look at this condition on an individual basis. We selected the most difficult listening-in-noise task used in this study, +5 dB SNR; the individual preferences are shown in Figure 2.
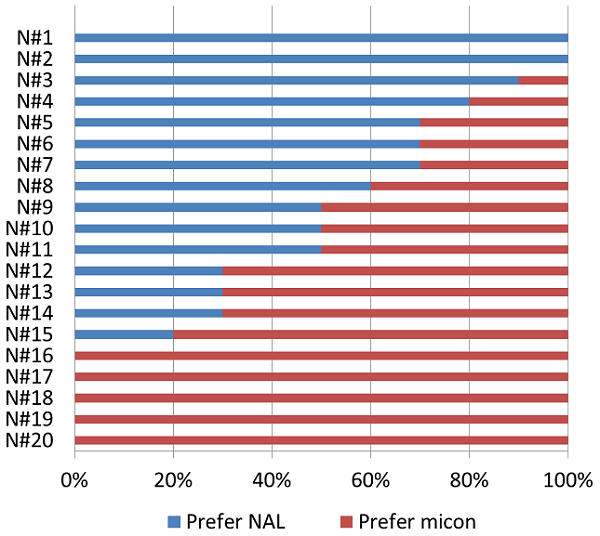
Figure 2. Individual preferences for the 10 trials for the 20 participants for the + 5 dB SNR speech-in-noise listening condition. The blue portion of each horizontal bar represents the percent of preferences for the NAL, the red portion represents the percent of preferences for the micon fitting. Although not significant, these study results suggest a slight preference for micon-fit for this difficult listening situation. (Note: The subject numbers on the chart represent rank ordering, not the order in which the participants were tested).
Shown in Figure 2 are the percent of responses for each participant for the micon versus the NAL-NL2 fitting. The blue portion of each horizontal bar represents NAL and the red portion micon-fit. For example, if the bar is 100% red, this would indicate that for all 10 of the 10 comparisons, the participant picked the micon fitting (e.g., the bottom five participants on the chart).
As shown, and as we discussed earlier, there are substantial individual differences. If we consider 8/10 (80%) as the criterion for “winning,” then the score would be micon=6, NAL=4, and 10 “no difference.” If we use 7/10 as significant (70%), then we have micon=9 and NAL=7, with 4 individuals in the” no difference” category. Given the fairly equal distribution, it appears that the slight reduction in high frequency gain for the micon fitting did not have an overall negative effect on perceived speech understanding. Recall, that there also was not a significant correlation for this variable related to preferences for any of the categories.
Conclusion
The NAL-NL2 is a well-established prescriptive fitting method. There are some concerns, however, that the gain applied is more than some patients consider “acceptable” and that this may lead to hearing aid rejection. We, therefore, have developed the Siemens micon fit as an alternative. Overall, based on the results discussed here, we are encouraged that the micon algorithm provides good “first acceptance” for the patient, is rated highly when compared to the proprietary algorithm of other manufacturers, and for speech understanding in background noise, is no different than the widely-accepted NAL-NL2.
References
Cox, R.M., Alexander, G.C., & Gilmore, C. (1987). Development of the Connected Speech Test (CST). Ear and Hearing, 8(5 Suppl), 119S-126S.
Johnson, E. (2012, April) 20Q: Same or different - Comparing the latest NAL and DSL prescriptive targets. AudiologyOnline, Article 769. Retrieved from https://www.audiologyonline.com/
Leavitt, R., & Flexer, C. (2012). The importance of audibility in successful amplification of hearing loss. Hearing Review, 19(13), 20-23.
Lybarger, S. (1957) Basic fitting procedure (Condensed form for clinical use). Cannonsburg, PA: Radioear Corporation.
Mueller, H. G. (2014, January). 20Q: Real-ear probe-microphone measures - 30 years of progress? AudiologyOnline, Article 12410. Retrieved from https://www.audiologyonline.com
Mueller, H. G. (2005). Fitting hearing aids to adults using prescriptive methods: an evidence-based review of effectiveness. Journal of the American Academy of Audiology, 16(7), 448-460.
Powers, T. A., & Beilin, J. (2013, January 17). True advances in hearing aid technology: What are they and where´s the proof? Hearing Review. Retrieved from www.hearingreview.com
Appendix: Description of Test Stimuli
Stimuli used for paired comparison included sentences from the Connected Speech Test (CST; Cox, Alexander, & Gilmore, 1987). The first three sentences (approximately 7.5 seconds long total) from the “Windows” passage, with silent portions removed, were used as the test speech (“Windows provide light and air to rooms. Windows were once covered with crude shutters. Later, oil and paper were used for window panes.”). The speech was extracted from an original CD recording of the CST materials and was used for all speech paired comparisons. The speech was presented from a 0° azimuth relative to the listener at a level of 60 dBA (quiet and +15 dB SNR conditions) or 65 dBA (+5 dB SNR condition).
The background noise consisted of four uncorrelated segments of multitalker babble also extracted from the CST CD. Babble segments were equated in level when presented in isolation and then the level of each segment was adjusted equally to create the desired overall noise levels used during testing (45 dBA and 60 dBA, for the +15 and +5 dB SNRs, respectively). Noise loudspeakers were situated in the four corners of the test room, approximately at 45°, 135°, 225° and 315° relative to the listener.
Music stimuli included an approximately 9.4 second segment with vocals from the Beach Boys “Good Vibrations” (2006, Good Vibrations 40th Anniversary Album) and an approximately 10.4 second instrumental sample of Big Band music “Sing, Sing, Sing” produced by the BBC Big Band Orchestra (2007, The Best Of Big Band Album).
The “All Day” stimulus consisted of shorter clips of the prior stimuli played sequentially. Specifically, the CST sentence- “Windows provide light and air to rooms” (approximately 2.5 seconds) was presented in quiet, and again in noise at a +15 dB SNR and finally at a +5 dB SNR. Three and half second clips of the Beach Boys and BBC Big Band stimuli followed sequentially. Together these segments created an approximately 14 second “All-Day” stimulus.
Cite this content as:
Powers, T.A., Branda, E., & Beilin, J. (2014, June). Clinical comparison of a manufacturer’s proprietary fitting algorithm to the NAL-NL2 prescriptive method. AudiologyOnline, Article 12708. Retrieved from: https://www.audiologyonline.com