Learning Outcomes
After this course, participants will be able to:
- Describe the audiometric tests included with AMTAS.
- Define 3 quality indicators used for determining the reliability of the AMTAS exam.
- Describe 3 ways AMTAS can be utilized in an audiology practice.
Overview of GSI-AMTAS
AMTAS stands for is the Automated Method for Testing Auditory Sensitivity. AMTAS is a software program that works with a GSI audiometer. There are two different audiometers in the GSI lineup that work with AMTAS: the AudioStar Prom and the GSI Pello.
AMTAS uses a variety of different quality indicators and patented algorithms that ensure quality and reliability of the evaluation. AMTAS provides an automated method for obtaining a diagnostic hearing test, including air conduction and bone conduction thresholds, with masking applied at all times to the non-test ear. It provides an automated test of speech reception and speech recognition scores as well. When you are through with the AMTAS evaluation, the report includes all of the diagnostic hearing information as well as a classification of the audiometric findings. It generates a report for both the audiologist and the patient.
Why Automated Audiometry?
In 2009, Dr. Barry Freeman wrote an article in Audiology Today entitled, "The Coming Crisis in Audiology." He stated, "A shortfall in the number of audiologists is predicted to occur in the not-so-distant future. If we do not address this impending crisis, any gaps in care will be filled by alternatives outside our profession."
Demographics are changing in our industry and we are not necessarily poised to be prepared for all of the people that are going to be requiring audiology care. The World Health Organization (2015) estimates that there are 360 million people worldwide affected by hearing loss. In the United States, approximately 30 million people, age 12 or older, that have a significant hearing loss, according to the US Department of Health and Human Services. Trends show that audiologists are not necessarily in the greatest position to be able to service all these people. According to Windmill and Freeman, in 2013 there were 16,000 licensed audiologists in the United States. Of these, 20% do not necessarily impact or participate in direct patient care. This 20% may be working in industry or other positions not involving patient care. Of the remaining 12,800 licensed audiologists, only 11,200 are in practice full time. University programs are graduating about 600 audiologists per year, and it is estimated that 40% never enter the field. In addition, approximately 400 audiologists retire every year. Therefore, there are fewer audiologists entering the profession than there those retiring, which means that we will have little or no growth in our field. At the same time, there will be an increase in demand for hearing health care services.
Solutions to address the demand for hearing care services including increasing the number of audiologists in the profession, increasing the productivity and efficiency of audiology care so audiologists can see more patients, and increasing access to audiologists.
The American Academy of Audiology (AAA) has a position statement on Audiologists' Assistants (AAA, 2010). The position states that the use of audiologist assistants can improve access to audiologists and increase productivity by moving select tasks typically done by an audiologist to be done by an assistant under the direction of an audiologist. Tasks such as sending in ear mold orders, maintaining inventories, performing hearing aid checks and cleans, prepping patients for certain tests, may allow for audiologists to be more efficient. There are currently about 20 states that regulate audiologists' assistants.
The American Speech-Language-Hearing Association (ASHA) also has a statement about Audiology Assistants website, indicating that the use of assistants can improve access to care, increase productivity and reduce clinic costs. The Veterans' Administration currently uses Teleaudiology Clinical Technicians or TCTs. TCTs provide patient/equipment interface support under the supervision of a licensed audiologist who is delivering audiology services from a site located at a distance from the actual patient testing site.
AMTAS Methodology and Validity
AMTAS has been developed over the past 15 years by Dr. Robert Margolis and every aspect of it has been validated through multiple published studies. It was developed through a partnership between Dr. Margolis' company, Audiology Incorporated, and three research institutions - the University of Minnesota, University of Utah, and the James H. Quillen Veterans Administration Medical Center. AMTAS development was funded by the National Institutes of Health Small Business Technology Transfer Program. In the late 1980s, Dr. Margolis became professor and director of audiology at the University of Minnesota Medical School. In 2000, he established Audiology Incorporated to develop better methods for testing hearing. In 2012, he became Professor Emeritus with the University of Minnesota and he has continued to be an adjunct professor there as well as the Department of Speech and Hearing Science at ASU. He has over 150 publications in journals and textbooks. His research is primarily focused on developing methods for evaluating disorders of hearing. Dr. Margolis has been awarded research grants from The Deafness Research Foundation, the NATO Division of Scientific Affairs, The National Institutes of Health, and the U.S. Department of Veterans Affairs. Much of the research on AMTAS including some of the studies I will review in this course are available on Dr. Margolis' website, audiologyincorporated.com, as well as on the GSI website.
AMTAS Validation Studies (IJA, 2010)
The first AMTAS publication I want to highlight is one that provides results of validation studies and was published in the International Journal of Audiology in 2010. This article details the results of three tests: Inter-tester Differences for Manual Audiometry, AMTAS Manual Threshold Comparison, and Inter-subject Variability with Bone Conductor Placement.
Inter-tester Differences for Manual Audiometry. The purpose of this test was to quantify the differences in manual testing from two expert audiologists. The expert audiologists had at least 10 years of experience each. He wanted to find out the differences that could be expected if these two experts tested the same person in a short time frame. He looked at the results from six patients over three different sites. He found absolute differences in air conduction thresholds ranged from 2.4 dB to 6.3 dB. The overall mean absolute difference was 4.1 dB. For bone conduction thresholds, there was a mean absolute difference for all frequencies testing (excluding 250 Hz) of 5.4 dB, with a 95% confidence interval of 2.9 to 7.9 dB. I think that is what would be expected from expert audiologists - approximately a 5 dB difference between testers at a given frequency for air conduction, with slightly more variability in bone conduction.
AMTAS Manual Threshold Comparison. This test compares the results of AMTAS to the results of testing from expert audiologists for the same patients. There were 30 subjects (5 normal hearing, 25 with hearing impairment) who were tested with both AMTAS and manual audiometry in random order. Both testing methods provided very similar results. The air conduction absolute differences ranged from 3.0 dB to 4.5 dB with a mean absolute difference of 3.6 dB. The bone conduction threshold results had a little bit more variability, with a mean absolute difference of 7.7 dB (range 7.4 dB to 8.1 dB). He attributed those differences to the difference in placement for the bone conductor (forehead placement v. mastoid placement) and calibration.
Intersubject Variability with Bone Conductor Placement. The purpose of this study was to see if there was variability in bone conduction thresholds based on placement of the bone oscillator (mastoid as compared to forehead). There were 5 female and 5 male subjects, all of whom had normal hearing. The study found variability associated with the placement sites.
AMTAS Publications
Figure 1 is a list of AMTAS publications going back to the early 2000s. This list is also in your handout. The validation has been a long process and a variety of different publications and studies were included in the process.

Figure 1. Select AMTAS publications.
How to Implement AMTAS
AMTAS is a software program, so as long as you have a computer that meets the minimum system requirements, you can hook up directly to one of our audiometers. It's relatively simple, with just two connections - a USB connection, and a stereo audio cable that goes from the headphone jack of the computer to the external A/B on the back port of the audiometer. If you have experience with GSI audiometers, this is essentially the same set up you use to transfer data and do reporting with GSI Suite.
Once you have the system setup and have the software installed on the computer, you will have two icons on your desktop: GSI AMTAS and the AMTAS Configuration App. If you have experience with GSI production, you may be familiar with the configuration applications that we have for all of our products that set up the initial parameters and testing preferences for your devices. For example, you can configure an automatic protocol on TympStar Pro using the configuration app, or set up multiple examiners on the AudioStar Pro.
The main Config App contains two main sections, and a menu bar at the bottom: Test Options and General Options. Let's start with Test Options (Figure 2).
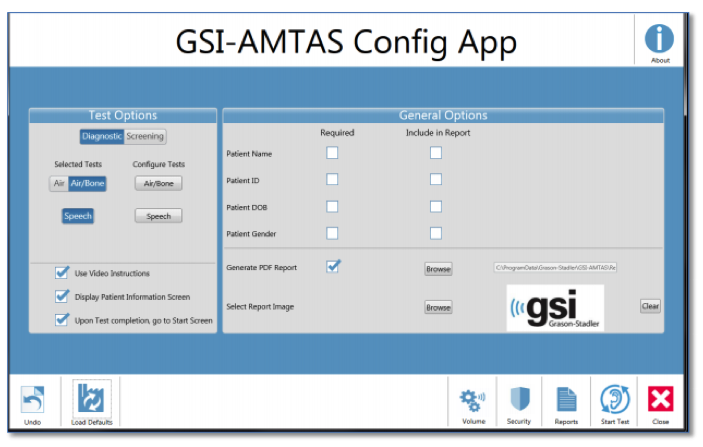
Figure 2. GSI AMTAS Pro Configuration.
Screening Settings
There are two selections for test options - screening configuration and air-bone configuration. You can use AMTAS for hearing screenings, where the criteria are just a simple pass or fail, and this is where you would set that up. You can select which frequencies you want to include (minimum of three), as well as select the intensity (20 or 25 dB HL). You can also select the Pass Criteria - that is, the number of presented frequencies where a response is required in order to pass. The screening only takes a few minutes for the patient, so AMTAS can be used as a quick and effective screening audiometer. The Screening Settings screen is shown in Figure 3.
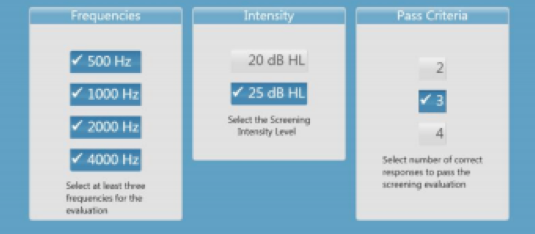
Figure 3. Screening Settings screen in AMTAS software.
Diagnostic Configuration
Most people will use AMTAS with the threshold or diagnostic configuration. Figure 4 shows the test options for air/bone configuration, where you'll configure how the software will find thresholds for all the test frequencies.

Figure 4. Air/Bone Configuration.
The octave frequencies are always tested, and therefore not configurable in the software. You can decide how you want the inter-octaves frequencies to be tested, by checking or not checking the box under Inter-Octaves in the software. When the box is checked, inter-octave frequencies are only tested when the difference between the adjacent octaves is 20 dB or greater. If the box is not checked, the selected inter-octave frequencies will always be tested. When I was working in a dispensing practice, I tested 3000 Hz and 6000 Hz with every patient.
The Speech Settings configuration screen is shown in Figure 5.

Figure 5. Speech Configuration.
The Speech Settings screen is where you will determine whether to include both the speech reception thresholds and then speech discrimination scores. Under speech discrimination, you have the ability to select the reference point for the starting intensity for word recognition testing. There are three options: speech reception threshold, the pure tone average, and a fixed value. I will go into more details about this shortly. Figure 6 shows the General Options screen.
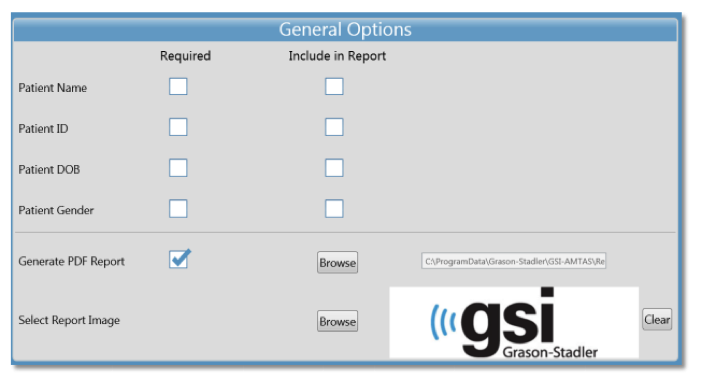
Figure 6. General Options.
In the General Options screen, you can set reporting parameters. On this screen, you select the required fields for the patient information that is needed in order to start the test. You can select demographic information such as name, gender, date of birth, etc. to be captured in the software program. In addition, on this screen you will determine the fields that are included in the report, as well as if and where reports are generated and stored. You also have an option to add your own logo to the reports.
Patient Set Up
I recommend that with AMTAS, as with manual audiometry, you explain to the patient what to expect and how to respond. The program has a video that plays prior to testing that explains this also, but it is better that the video serves as reinforcement rather than the only instruction to the patient.
Next, place the bone conductor on the forehead using an AMBAND. The AMBAND sits on the forehead and holds the bone conductor in place. These bands have been tested and calibrated so that they can fit any size head. They provide an accurate and validated amount of pressure against the forehead so that you get an accurate bone conduction reading.
There is a piece of Velcro that comes with it to stick to the backside of the bone conductor that will help hold it in place underneath the AMBAND. You place the bone conductor underneath the AMBAND in the center of the patient's forehead, making sure that it fits comfortably and is not over the top of the ears. Once you have the bone conductor in place, you move the lead from the oscillator over the top of the patient's head and secure it down with the headphone placement. AMTAS utilizes circumaural headphones that are traditionally used for extended high frequency testing. If you have an AudioStar Pro that is a few years old, you may have the HDA200 headphones. Currently, we ship the DD450 headphones with the AudioStar Pro. The DD450 headphones are included in the purchase of the AMTAS license. They are very comfortable headphones, and you can use them to test the full frequency range, as well.
After you place the headphones, the patient is ready and the testing can be started. You do not need to change transducers at all during the evaluation. Figure 7 shows an illustration of the AMBAND and headphone placement.

Figure 7. Patient set up with bone oscillator and headphones.
Launching AMTAS
Once you launch AMTAS, you do not need to supervise the testing. In fact, the point of AMTAS is to free up the audiologist to do other things. The software program runs your computer in what's called a kiosk mode, which means that in order for the test to be stopped or exited, an administrative password (or username and password) is required. The patient cannot just stop and access the computer during the test. In the upper right-hand corner in the welcome screen, you'll see three horizontal bars, which gives you a menu (Settings, About, Exit); however, even if that were selected, a username and password are required.
Let's say you have configured AMTAS for the full diagnostic evaluation, but now you have a patient coming in for an annual check-up and you just want to run diagnostic air conduction testing. Instead of having to go to the Configuration App and set that all up, you can use this menu to go to Settings. The screen looks exactly like the Configuration App, but it is a temporary Configuration App. In this case, you can use it to turn off the speech testing and bone conduction testing for this patient. As soon as that test is done and saved, it will go back to the original configuration. So, this allows you to change the testing on the fly rather than use the original configuration.
To run the full evaluation, click Get Started. That brings you to the demographic screen, then to the instructions screen. The instructions are very clear and concise. The software gives the patient a brief rundown of what to expect, provides examples of the pure tone stimuli to listen for and tells them to ignore the masking, with examples. AMTAS uses masking during the entire test for air and bone conduction testing, and for speech.
Figure 8 shows the two screens the patient sees during threshold testing for both air and bone conduction.
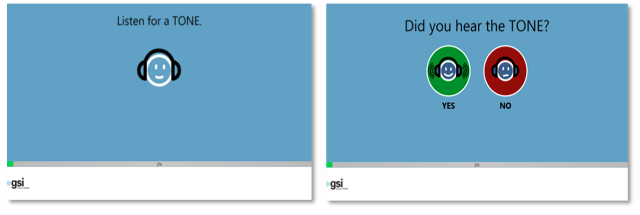
Figure 8. Pure Tone (AMTAS).
AMTAS first prompts them by showing the "Listen for a TONE" screen. There's a tone presentation, and the next screen asks, "Did you hear the TONE?" The patient can reply using a mouse or touchscreen, depending on your setup. In the AMTAS software program, those icons are spread out more than you see in Figure 8, so that is not easy to make a mistake and accidentally press the wrong icon.
Earlier, I stated that you have the ability to select the reference point for the starting intensity for word recognition testing, and one of the options is the Pure Tone Average (PTA). Pure Tone Average is calculated by the software using the average of the thresholds for 500 Hz, 1000 Hz, and 2000 Hz. The PTA is not calculated if more than one of the frequencies is a No Response (NR). If a single frequency is a NR, then the PTA is calculated from the average of the two frequencies with a response. If there is a difference of 20 dB or greater between two of the three frequencies than the PTA is calculated as the average of the best two frequencies.
Speech testing is done similarly to air and bone conduction testing. It prompts the patient to "Listen for a WORD:, and utilizes a forced choice for Speech Reception Threshold (SRT) and Word Recognition Score (WRS) testing. The patient makes a choice from a closed set. It uses Spondee words for SRTs and the NU-6 words for word recognition testing. You can see the speech testing AMTAS screens in Figure 9.

Figure 9. Speech testing utilizes forced choice for SRT and WRS.
Dr. Margolis has a poster, available on his website, that validates the methodology for speech testing. If SRT or PTA is selected as the reference point for WRS testing, the words are presented at a level of SRT or PTA plus 22 dB. This level may be softer than what we would present in the office during manual testing; I think most people use SRT + 40 dB or PTA + 40 dB as the presentation level for WRS testing. AMTAS uses a lower initial presentation level, and if the score drops below 88 %, the level will increase to + 28 dB to compensate. Additionally, WRS testing will not occur if:
- SRT value > 68 dB
- PTA value > 68 dB
- Fixed value > 80 dB
Refer to the poster for more details to understand the methodology and the validation for the speech testing portion of AMTAS.
Figure 10 shows photos of one of our audiologists performing the AMTAS driven by the GSI AudioStar Pro. The photo on the left shows a lock on while AMTAS is being driven. You can't access the audiometer while the AMTAS is in progress. Once the test is completed, it will say Finished. In general, the average person probably takes about 15 to 20 minutes to complete the entire evaluation. Some people can do it faster and some people are slower as it is a self-paced test.
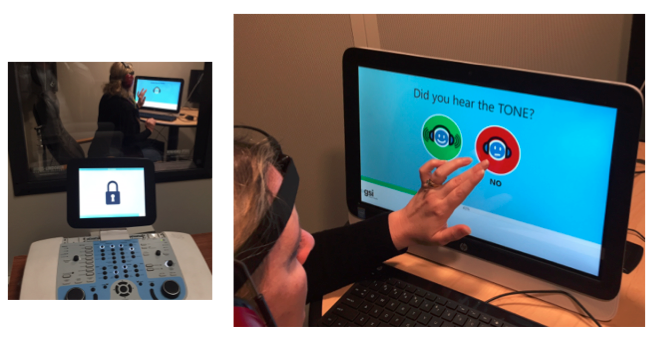
Figure 10. AMTAS driven by the GSI AudioStar Pro.
Masking
As mentioned, AMTAS uses masking the entire time. One of the quality indicators that is used to determine the validity of the test looks at masking. When the test is completed, an analysis is performed of masker levels and thresholds of both ears to determine if overmasking or undermasking may have occurred. If either has occurred, the thresholds are identified with "masking alerts". When masking alerts occur, those thresholds should be retested manually. It is an indication that this patient may have a more complicated hearing loss.
Testing Notes - "Time Out"
If the patient does not respond within 10 seconds during the tone portion of testing, a timeout will occur. The screen will indicate to the patient that they haven't responded. It will ask them to click another box to continue with the test. If three timeouts occur at any time during the pure tone testing, the application will end the test and proceed to the Finish screen. A timeout during speech testing is treated as an incorrect response. For the spondee test, that would result in raising the level which will eventually hit the max and abort if there are no correct responses.
Interpretation
Interpretation is where our expertise as audiologists comes in. This is what we are trained for, and where we are most valuable in the diagnostic process.
Automated Report
Figure 11 has an example of what an AMTAS report looks like. It includes patient information, the classic audiogram, as well as a legend. There is a Masking Level Table that describes how much masking was used at each of the frequencies that were captured. There is a Quality Assessment Table, which has the quality indicators that I've mentioned and will review shortly. The report also includes an Audiogram Classification Table, a Speech Recognition Table and a place for you to add comments as well.
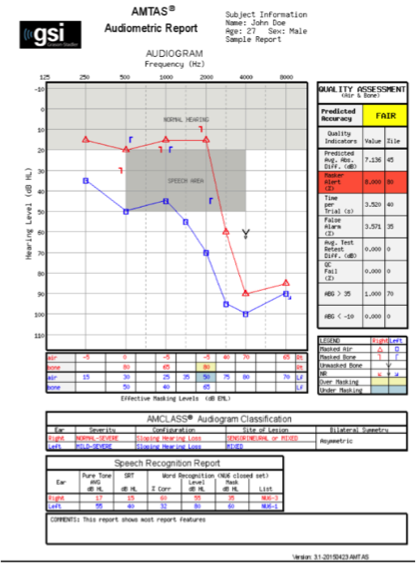
Figure 11. AMTAS report example.
Quality Indicators (Qualind)
The quality indicators for AMTAS were detailed in an article by Margolis and colleagues (2007). For more information about these quality indicators, I would strongly suggest reading this article.
Dr. Margolis used a large sample pool (n = 120). Data were collected at three sites from a wide range of settings, patient demographics, and hearing loss characteristics. They found a very strong relationship between predicted and measured accuracy using the automated system. The conclusion is that AMTAS may be useful for automatic test procedures when skilled professionals are not available to provide quality assurance.
The nine quality indicators (Qualind) are defined as follows:
- Predicted Accuracy: Overall quality - Good, Fair, Poor
- Predicted Average Absolute Difference: Difference between automated and manual thresholds
- Masker Alerts: Thresholds where masking may have been too high or low
- Time per Trial: Average time from stimulus to patient response
- False Alarm Rate: Number of times the patient responded with no stimulus presented divided by the number of trials when no stimulus present
- Average Test-Retest Difference: Average difference between 1 kHz test and retest in right and left ear
- Quality Check Fail Rate: Number of times patient did not respond to stimulus above threshold divided by the number of measured thresholds.
- Number of Air/Bone Gap > 35 dB: Number of air-bone gaps that exceed 35 dB
- Number of Air/Bone Gap < -10 dB: Number of air-bone gaps that are less than 10 dB
In terms of Predicted Accuracy, reliability judgment found on audiogram form assumes that a skilled audiologist can observe certain patient behaviors and characteristics that predict accuracy. This is something that is not necessarily taught in schools but rather gained through professional experience. Reliability is a judgment based on patient behaviors we observe during a test, such as timing - how long did it take to respond to the stimulus? The number of false positives may also be a factor, that is, how many times did the patient respond when there was no stimulus or the stimulus was well below the threshold? Margolis quantified those types of factors and included them in the assessment. The Predicted Average Absolute Difference is the difference between automated and manual thresholds. If you have a mark next to this indicator, it helps establish the accuracy and confidence in the patient responses. If this is elevated, it's an indication to do manual testing. Another one of the quality indicators is the False Alarm Rate. There are catch trials that are presented randomly through the test. Every once in a while, peppered through the evaluation, there will be a presentation with just the masking noise without any stimulus. If a patient responds, the software delivers a message letting the patient know that they responded when there was no stimulus present, and to only respond yes when they are sure they hear the stimulus. Similarly, in manual testing, it is recommended to reinstruct the patient who is giving false responses. The Quality Check Fail Rate is the number of times the patient did not respond to a stimulus above their established threshold. For every single threshold that AMTAS establishes, it will do a quality control fail check by re-testing that level and at a level 5 dB higher, just as we would do in manual testing. Whe= establishing a threshold with a patient, if we were to go up five dB, we should expect that that patient would respond. The software system tracks these nine quality indicators as they will all contribute to the overall predicted accuracy of the test. These are shown in Figure 12.
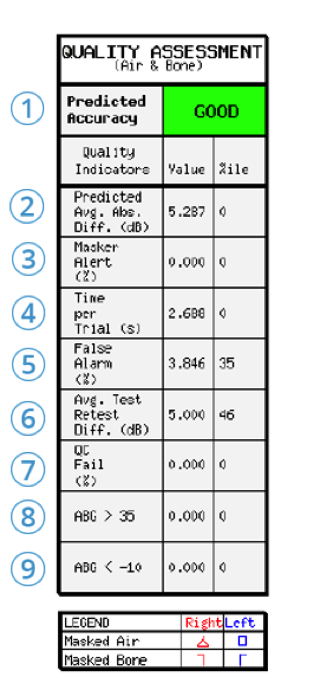
Figure 12. Quality Assessment example.
Audiogram Classification (AMCLASS)
The audiogram classification uses terms that audiologists use to describe hearing loss. I might describe a hearing loss as a mild to moderate, high frequency, sensorineural hearing loss. Another audiologist may have a similar but not exact description for the same hearing loss. Margolis gave expert audiologists 265 different audiograms and asked the audiologists to classify them. He analyzed the differences in how audiologists classified the audiograms. His analysis showed that there was something like 376 billion different possible combinations of descriptions, which shocked him. You would expect more uniformity. He made categories based on all the input from these expert audiologists and all the audiograms that they reviewed. He then had the audiologists look at how AMTAS then classified the loss. When those experts compared their classifications with one another, they were more likely to agree with the way that AMTAS described the loss versus the way another expert described the loss.
In AMTAS, the audiogram for each ear is given three descriptive categories based on:
- Configuration: Normal, Flat, Sloping Hearing Loss, Rising, Trough, Peaked, and other
- Severity: Normal, Mild, Moderate, Severe, Profound
- Site of Lesion: Conductive, Sensory, Mixed
The audiogram is also analyzed for interaural asymmetry.
The interpretation must be done by audiologists. What will make the difference for patient care and determine the next steps, is an audiologist's interpretation after review of the quality indicators, the classification, and the audiogram. The next step may be middle ear analysis, OAEs, Speech-In-Noise testing using the QuickSIN or BKB-SIN, a hearing aid evaluation, and/or counseling.
Data Management
You can manage the data and reporting through GSI Suite and Noah. There are two different report formats - Audiometric and Patient.
The Patient Report is based on the patient's classification and on the audiogram. The report will describe their loss and that is something you can choose to give to your patient or include with their patient file at your discretion. We use the audiometer to drive the test and the software will generate a couple of PDFs reports and put them in a folder for you. You can attach the report to an electronic medical record or print it. If you use GSI devices, you can transfer that audiometric data over into GSI Suite, as it is in Noah, and then you can use that for things like hearing aid fittings. To transfer the test from the audiometer into GSI Suite, go to the patient tab on the audiometer, and then click Transfer Sessions. You will see all of the sessions that have been saved by the audiometer. The AudioStar Pro and the Pello both save the most previous one under Tests. Each session has a date and time stamp, starting either an A or a D. "A" stands for is that the test was captured via AMTAS if there is a "D", it means that it was captured by the device manually. Knowing the time of the appointment can also help you select the session to transfer for the appropriate patient. Simply click Transfer to bring it over into GSI Suite. If you're using GSI Suite, you may have seen a tab called Audiogram Classification, and that is specifically for AMTAS. That will bring all the classification information over from the report, along with the hearing test information including speech. From there, you can format your reports to your preference.
How Does AMTAS Fit With Current Practice?
What are some ways that we can utilize AMTAS in audiology practices? First, AMTAS is just a hearing test and does not replace audiologists. For example, TympStar Pro has protocols you can program and then run through by simply placing the probe in the ear. The protocol may include diagnostic tympanometry and whatever acoustic reflexes you have set up in the program. AMTAS essentially does the same type of thing - it runs a protocol that you have configured. It makes the testing piece automated so that we can interpret, counsel, test difficult-to-test patients or complicated hearing losses, make recommendations, coordinate care, and all of the other things we do that require audiology know-how and expertise.
Advantages of Automation
There are many advantages to automation, including:
- Optimize use of audiologists' time
- Standardization
- Quantitative quality assessment
- Decrease errors
- Decrease cost
- Increase access
- Telemedicine
Automation, first and foremost, optimizes the audiologist's time. It's a way to reach more people by increasing access for patients.
As I mentioned, AMTAS was developed for the Veterans Administration (VA). The Department of Veterans Affair funded a clinical trial designed to evaluate automated audiometry in three different modalities: clinical video telehealth, home telehealth, and what's called a store and forward paradigm. The VA uses AMTAS with a software program developed by a company called Global Med. They use a video endoscope to take a picture of the outside of the ear. They use a camera with a probe on the end of it so it stays at a set distance from the side of the head, which allows you to measure on the photograph. Figure 14 shows a photograph taken with this equipment and an example of a measurement (the green bar superimposed on the photo) that you could take. For example, you may want a measurement to select the appropriate size for a receiver for this patient. There is also an otoscope that a TCT (telehealth clinical technician) can use for otoscopy and the software will store the results. The patient then does AMTAS and all of the data is saved and forwarded to an audiologist in the audiology department for review.
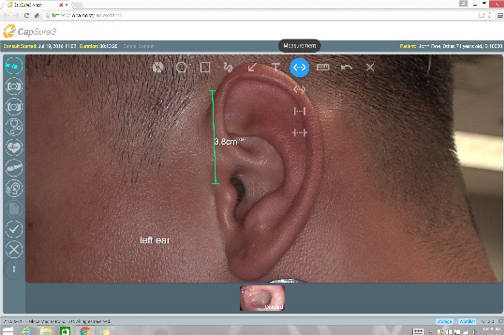
Figure 14. ATMAS video endoscope.
If a veteran visits a VA remote center, that facility may not have full-time audiology services. With AMTAS and this telehealth program, the first time the veteran actually gets in front of the audiologist might be for a hearing aid fitting. The audiologists will have the hearing test, the measurements, and they know there is a clear ear canal from the otoscopy results. The VA is looking to expand the program over the next few years.
AMTAS can also be used outside of the VA in a variety of different practices, from busy ENT clinics to universities to free up more time. It can be used in school systems, satellite clinics, and for community outreach. In a busy practice, while a patient is sitting down with AMTAS, the audiologist could see walk-ins, perform check and cleans, or conduct counseling. While you are doing a check and clean of a patient's hearing aid for an annual routine visit, you could set up that patient with AMTAS to do pure tone thresholds. That way, you are ready for programming changes, if needed. There are many ways that AMTAS can benefit audiologists in a variety of settings. The way that you use it in your practice is entirely up to you.
AAA Survey
At the AAA conference in 2017, AMTAS was introduced, and we took the opportunity to survey conference attendees. We showed a video about AMTAS and then asked the audiologists where they could imagine it being used in their current positions. Of the 263 that answered this question, 125 thought it would be great for annual hearing evaluations, 64 indicated initial hearing tests were appropriate, 53 stated all basic diagnostic hearing evaluations, and 21 said they would never use automated testing.
We also asked, "What do you think are the benefits to implementing AMTAS in your facility?" This question received 351 responses. Of these, 79 responded more time for reporting; 131 thought that would give them the ability to see more patients, 122 thought more time for other audiological tests, and only 19 said they would not use automated tests. The people that viewed AMTAS most favorably were students, audiologists early on in their audiology careers, or within 5 - 10 years of retirement. Audiologists in the middle of their career showed the most resistance to the concepts and products.
Summary
I invite you again to review the long list of AMTAS publications in your handout. At GSI, we have a legacy of building audiometers for 65 years. Our products are of the highest quality, with proven validity. When we launched the GSI AMTAS in partnership with Dr. Margolis, we wanted to highlight all the work that has gone into the validation. We believe AMTAS supports the audiology profession in many different areas and will help the profession as it moves into the future. While this course has focused primarily on how AMTAS fits within the US audiology market, Dr. Margolis has a wider view encompassing regions of the world that do not have good access to audiologists and testing. AMTAS provides a means for people in many different parts of the world to have access to an accurate hearing test, which is the first step in quality care for hearing conditions. For more information about AMTAS, please visit https://grason-stadler.com
References
Duran, J.K. (2002). The role of audiology assistants in a clinical setting. Doctoral Thesis, University of South Florida. Retrieved from https://scholarcommons.usf.edu
Freeman, B. (2009) The coming crisis in audiology. Audiology Today, 21(6), 46-52.
American Academy of Audiology. (2010). Position Statement - Audiology Assistants. Retrieved from www.audiology.org
American Speech Language Hearing Association. (n.d.). Audiology Assistants - Overview. Retrieved from www.asha.org
Margolis, R.H., Saly, G.L., Le, C., & Laurence, J. (2007). QualindTM: A method for assessing the accuracy of automated tests. JAAA, 18(12), 78-89.
Margolis, R.H., Glasberg, B.R., Creeke, S., & Moore, B.C. (2010). AMTAS: Automated method for testing auditory sensitivity: validation studies. IJA, 49(3), 185-94. doi:10.3109/14992020903092608
Lombardo, T. (2018). GSI AMTAS: Automated hearing assessment. AudiologyOnline, Article 24086. Retrieved from www.audiologyonline.com

