Regular readers of our Research QuickTakes series will recall that in 2024, Volume 7, was dedicated to a handful of key clinical tips that we extracted from recently published articles related to hearing aid selection and fitting. That report was two years ago, and believe it or not, there have been 400 or more hearing-aid-related articles published since then! We’d hate for you to fall behind, so it seems only appropriate to come back with an update. Again, we will call out articles that we believe could have an immediate impact on your direct patient care and counseling; something that might be worth thinking about on Monday morning.
We recognize that you might question whether these somewhat esoteric articles will really make a difference in your clinical life. We agree, yes, some probably won’t—but some certainly will. For example . . . consider these publications from 20 or more years ago:
- Hearing aid software predictive gain values: How accurate are they? (Hawkins & Cook, 2003). One of the first articles to point out that what you see on the manufacturer’s fitting screen is a poor representation of what is happening in the real ears, something that has been shown again year after year, but unfortunately, is still misunderstood by many.
- Development of a quick speech-in-noise test for measuring signal-to-noise ratio loss in normal-hearing and hearing-impaired listeners. (Killion et al, 2004). An intriguing test with a clever title, but it didn’t receive much attention in the initial years following its release. Today, it’s the #1 speech-in-noise test used by audiologists in the fitting of hearing aids.
- Client Oriented Scale of Improvement (COSI) and its relationship to several other measures of benefit and satisfaction provided by hearing aids (Dillon et al, 1997). Not a lot of fanfare when this was published in 1997 in JAAA. Our bet was that it would never fly, as didn’t we already have enough outcome measures? Even the title seemed a bit strange, as few audiologists in the U.S. refer to their patients as clients. Today, the COSI overwhelmingly is the #1 outcome measure used when hearing aids are fitted.
- Compression? Yes, but for low or high frequencies, for low or high intensities, and with what response times? (Dillon,1996). While some things change, other things stay somewhat the same. This article was written 30 years ago, when it was starting to become common for nearly all hearing aids to have wide dynamic range compression (WDRC). As the title of the article suggests, clinicians programming these hearing aids had many, many questions regarding where to set the kneepoints and what compression ratios to use. The question generating the most controversial answers was whether the compression release time should be fast or slow. A quick note, back then . . .gasp . . . audiologists did the compression programming themselves, rather than rely on a manufacturer to do it for them. Anyway, what you will find us discussing later in our review is an article from Windle et al (2026). The topic is, you guessed it, preferences for fast versus slow WDRC release times. And the second author of this paper? None other than Harvey Dillon!
What we will do in this Volume of QuickTakes is organize the key articles that we select relative to how they fit into the overall hearing aid fitting protocol:
- 11.1: Pre-Fitting Considerations
- 11.2: Pre-Fitting Testing
- 11.3: Signal Processing and Features
- 11.4: Selection and Fitting
- 11.5: Outcome Measures
11.1: Pre-Fitting Considerations
Certainly, one of the most important pre-fitting considerations is the overall uptake of hearing aids—this, of course, was one of the major issues surrounding the OTC hearing aid category. It was believed by many that uptake would increase significantly if hearing aids were more accessible and affordable. Now, three years after the introduction of this product category, the most recent MarkeTrak 2025 survey suggests only a minimal increase in hearing aid adoption.
So, why aren’t more people with hearing loss obtaining hearing aids? This was something asked on a recent EuroTrak survey. The top ten reasons are given below:
- I hear well enough in most situations.
- They are uncomfortable.
- My hearing loss is not severe enough.
- They do not work well in noisy situations.
- They do not restore hearing to normal.
- I have more serious priorities.
- I cannot afford a hearing aid.
- I would be embarrassed to wear a hearing aid.
- They are bad designs.
- I do not admit to having a hearing loss in public.
Notice that we must go down to #8 on the list before we have a response related to stigma. Yet most experts conclude that, for many, reluctance to use hearing aids is driven by stigma, even though survey respondents do not admit it. When we carefully compare hearing aid “adopters” to “non-adopters”, a few reasons are easy to explain, but most of the factors are difficult to pigeonhole—they often appear to be very similar people. The best source of this information is, of course, the MarkeTrak surveys, which have been conducted under the guidance of the Hearing Industries Association (HIA) since 1989. Regarding stigma and hearing aid adoption, one of the more memorable MarkeTrak findings from the 1990s was that only 35% of hearing-impaired non-adopters stated they would wear hearing aids, even if they were free and invisible!
Stigma, Hearing Loss, and Hearing Aids
As reviewed by Mueller et al (2013), stigma related to the use of hearing aids often is categorized as an identity threat, which refers to situations in which individuals feel they might be judged negatively because of a stereotype (e.g., people who wear hearing aids look old, not as intelligent, etc.). Identity threat can lead to self-handicapping strategies and a reduced sense of belonging to the stereotyped domain, or their value of the domain in question.
The stigma related to hearing loss and hearing aid use can put a person at risk for identity threat. The demands imposed by a stigma-relevant event are potentially harmful to his or her social identity. We see evidence of this when we examine the adoption of hearing aids for different age groups: surveys have shown that for self-reported moderate hearing loss, adoption rates are ~60% for those >75 years old, compared to only a ~20% rate for those in the 55-65 age group.
While some might think of the “hearing aid effect” as old news, after all, it has existed since the ear trumpet, that certainly isn’t the case, as a recent Special Issue of the International Journal of Audiology was devoted to this topic, with the catchy title: “To Tell or Not To Tell? The Stigma Experiences of Adults with Hearing Impairment and Their Families.” What you’ll find in this special issue is seven articles, all related to the relationships among stigma, hearing loss, and hearing aid use.
In an introductory article by Ekberg and Hickson (2023), the authors state that the purpose of these articles is to present a theory-driven understanding of the stigma issue. More specifically, they go on to say that current research thinking prompts us to examine stigma as “ultimately a combination of group, personal, and situational factors that determine whether an individual perceives stigma in a given situation, whether stigma serves to erode or enhance their social identity, and whether it is implicated in the recovery/management of their health condition.”
Ekberg and Hickson (2023) state that the series of papers in the Special Issue address the following two key research questions: When and how is stigma-induced identity threat experienced by older adults with hearing loss, and what are the associations between adults with hearing aids and their families’ experiences of stigma-induced identity threat?
We’ll let you pick and choose which one of these articles to dive into, but to get you started, here is a quick review of some of the findings/conclusions:
- This study was a large sample of 331 adults with self-reported hearing loss, living in Australia, the United Kingdom, and the United States. A fairly large portion of this group (25%) did not disclose their hearing loss to anyone or in any situation. The authors suggest that we might be able to increase hearing aid adoption by asking about and addressing the patients’ experiences of hearing loss stigma.
- The findings of one study supported the view of stigma being context and relationship-specific. “Not telling” was found to be a key way that stigma of hearing loss was dealt with. Attitudes towards hearing aids and personal characteristics were associated with hearing aid use.
- In a study of three different groups, adults with acquired hearing loss, their family members, and their hearing care professionals, it was found that hearing care professionals focused on the stigma of hearing aids more than on hearing loss. On the other hand, the adult participants focused more on the stigma of the hearing loss itself. Family member data indicated that they experienced little affiliate stigma (note: “affiliate stigma” is the term used to describe internalized stigma among family members of stigmatized individuals).
- Video-recordings in various social settings were analyzed for 20 adults with hearing loss, having conversations with their families/friends. Hearing loss was not specifically mentioned often, but when it did come up, it was typically related to humor, most frequently by someone other than the hearing loss patient. The authors suggest that these findings display the management of the “to tell or not to tell” dilemma in practice.
- Ecological Momentary Assessment (EMA) was used as a unique method to study stigma. The number of individual stigma experiences captured by EMA was low when viewed across a large number of social interactions. However, as a group, a quarter of the participants in this study experienced stigma over a two-week period, typically from others close to them. This suggests that stigma experiences may be a regular occurrence for some adults with hearing loss.
Stigma and Other Social Factors
Another recent publication that addressed the issue of stigma was that of Singh et al (2025). In addition to stigma, they also looked at other social factors such as social network composition, social support, and loneliness. Data collection took place across 130 different hearing care clinics in Canada; the final sample was 753 adults who were all recommended to try hearing aids for the first time. (mean age = 69.2 years; SD = 9.0; 57.4% male). Key factors assessed by a pre-fitting questionnaire included stigma related to age, stigma related to hearing aids, social network composition, perceived levels of social support, loneliness, self-reported hearing disability, and demographic information.
Not surprisingly, data analysis found that hearing aid adoption was best predicted by being older and having greater self-reported hearing disability. Additionally, the authors report that participants were more likely to adopt hearing aids if they reported less hearing aid stigma and had a social network that included at least one person with a suspected hearing loss. Although we would have expected a different result, it was found that loneliness and social support did not predict hearing aid adoption.
To Bundle or Not To Bundle?
“Selling” hearing aids. What approach? Bundled? Unbundled? Or something in-between? Let’s take a quick trip to 50 years ago. For most audiology clinics, the way the “pre-fitting” hearing aid evaluation worked is that three hearing aids from the clinic's stock inventory would be selected, which, from an electroacoustic standpoint, seemed appropriate for the patient. Extensive aided repeated-speech recognition testing with each of these three hearing aids would be conducted, sometimes even speech-in-noise, and based on these test results, the “best” product for the patient was selected. And yes, there was a charge for this testing.
The patient (or “client,” as they were called at the time) would then be referred to a “dispenser,” who would “sell” the patient the product that had been recommended. The patient would then return to the audiology clinic, and repeat aided speech testing would be conducted with the hearing aid that was purchased. And yes, there was a charge for this testing too. Some strange form of an unbundled fitting approach?
All this changed in 1977, when selling hearing aids became ethical for audiologists. Initially, many audiologists going into private practice at this time dabbled with an unbundled approach; but, within a decade or so, the bundled method was used by most... and it still is! While there seem to be several practical and maybe even financial reasons for using a bundled approach, it has often been suggested that an unbundled model would be more fitting for our profession. The recent introduction of the OTC category of hearing aids, as well as matters related to third-party insurance reimbursement, has added some new issues to the discussion.
While the bundled vs. unbundled debate has gone on for decades, there really hasn’t been much research on the topic. An exception is the recent work of Picou and colleagues from Vanderbilt Medical Center (Picou et al, 2024). These authors conducted a retrospective review of hearing aid consultation appointments at the Vanderbilt audiology clinic, a total of 5186 adults who would be purchasing their first set of hearing aids. Data analysis was conducted for four years when these services were bundled (2019-2022) and for 2023 when they were unbundled. In the unbundled model, a separate fee was charged for the consultation appointment.
The results of their review showed that after unbundling, even though there was a reduction in consultation appointments, a higher percentage of these appointments resulted in hearing aid adoptions (increased from 53% to 65%). The number of hearing aid adoptions per provider did not change over time. Picou et al (2024) conclude that by unbundling, “hearing aid consultations can be made more efficient, decreasing time spent with patients who do not need consultation services, without negatively impacting revenue.”
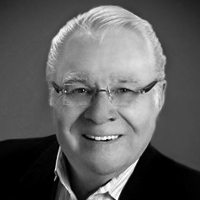
Some interesting additional information, if for no other reason than the names given to each category by the researchers, is the reasons that the non-adopters gave for not purchasing hearing aids when the different bundling procedures were used. The five categories are:
- No Hurry (patient believed they could wait)
- No Worry (patient not bothered by hearing loss)
- No Money (patient could not afford hearing aids)
- No Honey (patient needed approval from their partner)
- No Value (patient did not believe hearing aids had value)
The percentage for each category is shown in Figure 1 below. Some interesting differences do appear for the two procedures.
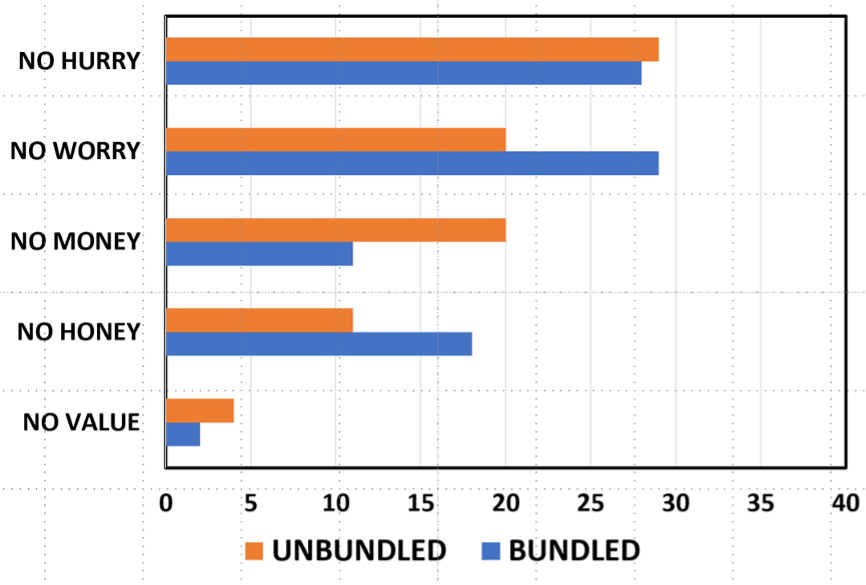
Figure 1. Reasons given by non-adopters for not purchasing hearing aids (percentage of total responses) for both the unbundled and bundled approaches.
Physician Recommendation and Hearing Aid Adoption: Does It Really Matter?
Another study that investigated hearing aid adoption rates was conducted by researchers at Thomas Jefferson University in Philadelphia. The objective of this study was to identify the motivating factors of individuals considering hearing aids, with a specific focus on whether physician recommendations influenced their decision to adopt hearing aids. We believe this is a valuable study because many audiologists, at least historically, believe there is a halo effect associated with the otolaryngologist encouraging patients to acquire hearing aids. On the other hand, since many patients most probably don’t know (or care) about the difference between an otolaryngologist and an audiologist, perhaps physician encouragement doesn’t make any difference in the hearing aid adoption rate. Interestingly, 42% of otolaryngology residents are now female (DeSisito et al 2024), which indicates a rising number of practicing female otolaryngologists. Combine this with the fact that about 80% of audiologists are female, and it’s getting tougher for laypeople to tell one profession from the other based on gender stereotypes.
To better understand whether physician involvement affected adoption rates, Snyder et al (2025) surveyed 321 adults (45% were older than 75 years of age) who underwent a hearing aid evaluation at a multi-site academic medical center between January 2018 and December 2022. They found that 80% of respondents chose to adopt hearing aids after their evaluation, considerably higher than many other studies that examined adoption rates. The most commonly cited motivating factors that led to adopting or not adopting hearing aids were the cost of hearing aids, insurance coverage, and physician recommendations. According to their analysis, knowledge that the institution offers hearing services at multiple locations, as well as knowledge that they could acquire hearing aids from the specific clinic where the evaluation occurred, were significant predictors.
Surprisingly, physician recommendation—although frequently reported as influential—was not a statistically significant predictor in their multivariable model. These findings suggest that the simple act of raising awareness in the community that you offer convenient locations and personalized high-quality service can have a positive impact on hearing aid adoption rates, and, according to this study, matters more than a recommendation from the ENT physician.
11.2: Pre-Fitting Testing
Pre-fitting testing is a vital part of every hearing aid fitting procedure. Obviously, the pure-tone audiogram is the cornerstone, but that’s just the beginning. A needs assessment provides a roadmap for the fitting process. Knowing the patient’s ability to understand speech in background noise is critical for counseling, programming the hearing aids, and comparative aided testing. Adjusting the MPO at the time of the fitting is a shot in the dark without frequency-specific loudness measures. For most self-assessment measures, a baseline is needed to allow for assessment of benefit later in the process. We have a standard for all this from the APSO—the two items related to pre-fitting testing are below:
- A needs assessment is conducted in determining candidacy and in making individualized amplification recommendations. A needs assessment includes audiologic, physical, communication, listening, self-assessment, and other pertinent factors affecting patient outcomes.
- Pre-fitting testing includes assessment of speech recognition in noise, unless clinically inappropriate, and frequency-specific loudness discomfort levels. Other validated measures of auditory and non-auditory abilities are considered appropriate for the individual patient.
Speech-in-Noise Measures
Speech-in-noise testing has been recommended as a hearing aid fitting pre-test since at least the 1960s. Unfortunately, many clinicians do not include this in their fitting protocol, despite that it’s part of all hearing aid fitting guidelines and the APSO standard (see above). In recent years, we’ve seen a few articles on this topic, again emphasizing the value. Considerable new information has been provided by audiologist Matt Fitzgerald from Standford University, who has shown convincing data why speech-in-noise testing should not only be conducted in addition to monosyllabic word recognition, but that for most patients, it should replace monosyllabic word recognition testing (see our reviews in QuickTakes Volume 6, Taylor and Mueller, 2023; Volume 7; Taylor and Mueller, 2024).
To add to the interest in speech-in-noise testing, we need to look at the recent recommendations from the NASEM committee on “meaningful outcome measures”—something we’ll discuss in the final section of this Volume. A brief spoiler alert: One of the three outcome measures that they recommend is speech-in-noise testing. As mentioned earlier, speech recognition testing was a popular outcome measure in the 1960s-1970s, but since the emergence of prescriptive methods, probe-mic verification, and self-assessment scales, speech testing is seldom used for this purpose.
It’s important to point out that the NASEM group specifically recommended the use of the words-in-noise (WIN) test for this purpose, as there is research showing that it is best qualified to detect small differences in performance. Our best guess, however, is that most of you do not have the WIN test and very likely have never used it. The speech-in-noise test that you are probably familiar with is the QuickSIN, and while not the first choice of the NASEM group, it was considered.
Our thoughts are that the QuickSIN could be used as a reasonable substitute for the WIN for outcome measures, especially if it has already been used as a pre-test. With that in mind, you might want to check out the recent article by Mueller, Ricketts, and Hornsby (2023), who reviewed the concept of speech in noise testing and then provided specific clinical guidance for using the QuickSIN for both a pre-test and an outcome measure. Now, you regular readers might say: Didn’t you talk about this article in QuickTakes Volume 7? We did, but we’re going to give it a different focus here, given the recent NASEM recommendations.
First, it’s important to decide what specific outcome you want to measure. Two choices immediately come to mind:
- Are the aided QuickSIN scores equal to (or better) than the best earphone scores when audibility was maximized (to the best possible, e.g., presentation level at 5 dB below the LDL), for both measures? The point here is that each patient has a “QuickSIN Max.” Some patients will never do better than an SNR Loss of 6 dB, no matter what technology they are fitted with.
- A different, but also valuable outcome, is to determine if aided performance is significantly better than unaided for the same test condition. In this case, we do the testing in the soundfield, using an ecologically valid presentation level (e.g., 40 dB HL, which will be ~53 dB SPL for most calibrated equipment).
Mueller and colleagues (2023) provide step-by-step procedural guidelines for both outcome measure goals:
Reason for doing test: Estimate optimum QuickSIN performance
- Seat the patient, give instructions, and fit with insert earphones.
- Use the standard QuickSIN recording. Only use the seven lists that are equivalent: 1, 2, 6, 8, 10, 11, and 12.
- Select a presentation level of 70 dB HL, or if PTA >45 dB, use patient rating of “Loud, But Okay” (just below the LDL).
- Select appropriate masking (speech noise) for the non-test ear.
- Test each ear independently. Present two QuickSIN lists to each ear. Take the average of these two scores to derive SNR-Loss for each ear.
- Use the critical difference chart to determine if the right and left ear scores are significantly different, if the scores obtained are different from previous testing, or if aided scores are equal (or better) than earphone scores.
These procedures will provide QuickSIN-Max for earphone testing. If QuickSIN-Max is used as an outcome measure, we suggest that you add bilateral testing as an additional measure to the guidelines above. You would then also conduct aided testing bilaterally, using a presentation level that is 5 dB below the aided LDL, considered to be “Loud, But Okay” for the patient.
Reason for doing test: Demonstration of the aided benefit
- Establish HL to SPL difference for calibrated location in soundfield where patient will be sitting; loudspeaker at 0 degree azimuth.
- Seat patient in soundfield calibrated position and give instructions. Fit the patient with hearing aids programmed to use settings (e.g., real-ear verified NAL-NL2)
- Use the standard QuickSIN recording. Only use the seven lists that are equivalent: 1, 2, 6, 8, 10, 11, and 12.
- Select a presentation level that will result in 53-55 dB SPL at the calibrated soundfield location (this will be around 40 dB HL, but will vary with equipment/setting).
- Testing first conducted bilaterally unaided. Two QuickSIN lists. Take the average of these two scores for the SNR-Loss. Note: If the patient’s loss is so severe that they do not understand any of the words at the +25 dB SNR in the unaided condition, increase presentation level accordingly—raise to average-level speech (~63 dB SPL).
- Patient is then fitted bilaterally to appropriate use setting (e.g., NAL-NL2 real ear verified), and aided bilateral testing is conducted. Two QuickSIN lists. Take the average of these two scores for the SNR-Loss.
- Use the critical difference chart to determine if the aided scores are better than the unaided scores.
- Use the SNR-Loss results to counsel the patient regarding the aided hearing aid benefit. Convert the percent of words correct for each of the six SNR ratios to compare aided to aided (for two lists, there are ten key words for each SNR). It is helpful to graph them on a chart for the patient (See Figure 2 below).
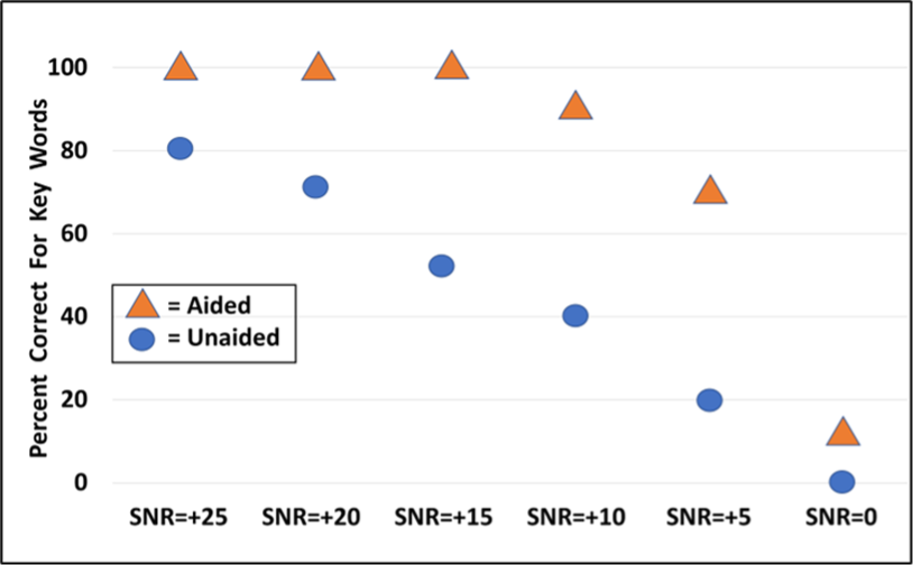
Figure 2. Example of using the QuickSIN for bilateral aided vs. unaided testing. Two lists were presented at each SNR for each condition. The values shown represent the percent correct for the 10 key words for each SNR, for the two different test conditions. Presentation level for this testing is 40 dB HL for both unaided and aided.
The Audible Contrast Threshold Test?
Just when you thought there couldn’t possibly be another speech in noise test, a new kid on the block arrives. The Audible Contrast Threshold (ACT) test is a spectro-temporal modulation detection test designed to estimate a person’s ability to hear speech in noise by measuring how much contrast (modulation depth) a listener needs to detect a signal embedded in noise. The ACT results are given using a normalized contrast level (dB nCL) scale where 0 dB nCL corresponds to normal performance, and higher nCL values indicate greater difficulty with modulation/speech-in-noise perception.
Performance on the ACT has been shown to predict speech understanding in noise, including among hearing-aid users and in realistic listening conditions (Eriksholm Research Center, 2024). There are several advantages to a speech-in-noise test that doesn’t require the patient to repeat sentences or words:
- The ACT is language-independent (no speech stimuli required) and suitable across languages and ages.
- It is quick to administer (about 2–3 minutes) with standard audiometric equipment and a patient response button that is pressed when the patient detects modulation, using a Hughson-Westlake test method.
- It is conducted immediately after pure-tone audiometry, so it is easy to administer.
- At least one manufacturer allows the audiologist to enter the ACT scores into the fitting software, and that score is used in the setting of certain hearing aid features (Martin, 2024)
The ACT has been clinically validated. According to Zaar et al (2024), the ACT thresholds showed excellent test-retest reliability and good agreement with other established non-speech modulation tests. Given that some patients are unable to complete words or sentence-length tests in noise, it’s good to know the ACT is a valid alternative.
Adding a Pre-Fitting Self-Assessment Scale
If we widen our definition of “pre-fitting” a little, it is reasonable to go back to the first patient encounter. Previously, we talked about self-assessment scales like the RHHI (the combination of the HHIE and the HHIA) and how they can be used to predict candidacy. In general, we like to use tools that are efficient for a busy clinic, so we thought you might like the article by Sherlock et al (2024), who provide an example of a 4-Question screening test.
For those of you who work with tinnitus patients, you might be familiar with the fairly common Tinnitus and Hearing Survey (THS). As the name suggests, this scale asks the patient questions regarding both their hearing ability and tinnitus. Researchers at Walter Reed Medical Center, however, have conducted research studies only using the four questions on the THS about hearing (Ellis et al, 2025; see review by Davidson, 2025). They refer to this modified version as the THS-H, and they modified the scoring so that the THS-H uses an 11-point scale ranging from 0 (not a problem) to 10 (a very big problem). The 4 questions on the THS-H that they asked this group were:
- Over the last week, I couldn’t understand what others were saying in noisy or crowded places.
- Over the last week, I couldn’t understand what people were saying on TV or in movies.
- Over the last week, I couldn’t understand people with soft voices.
- Over the last week, I couldn’t understand what was being said in group conversations.
In a large study of military personnel, the responses to the four items were summed to produce values between 0 and 40. Their research showed that only 5% of respondents with clinically normal hearing scored above 27, so this score was selected as a cutoff for “clinically significant hearing problems.” It seems that the THS-H could be used as an effective tool for assessing subjective hearing difficulties during the initial consultation. If the patient proceeds with the fitting of hearing aids, these baseline data could be used for counseling and as a casual measure of benefit.
Since we’re on the topic of easy-to-use self-assessment scales as a pre-fitting tool, it’s worthwhile mentioning a recent study that compared SSQ findings to hearing loss, speech-in-quiet, and speech-in-noise word recognition scores (Fitzgerald et al, 2024). These researchers used the five SSQ questions from the “speech hearing” section of the SSQ12, which they labeled the Speech5—not to be confused with the SSQ5 scale, which, as you might guess, is also 5 questions taken from the original SSQ.
Going back to our previous discussion of the QuickSIN, these researchers found that the degree of hearing loss (i.e., HFPTA) and the QuickSIN SNR loss were predictive of SSQ12-Speech5 scores. They also noted that the QuickSIN SNR loss (but not words-in-quiet testing) accounted for a significant amount of variance in their Speech5 scores and was largely effective at predicting which patients are likely to report greater perceived auditory disability (Fitzgerald et al, 2024).
11.3: Signal Processing and Features
In this section, we review research that has studied recent developments in hearing aid technology or examined specific hearing aid features. You’re probably familiar with the rhyme that originated in Lancashire, England, during the Victorian era that reads: “Something Old, Something New, Something Borrowed, Something Bluetooth, A Sixpence in your Shoe.” We couldn’t find any data on sixpence or shoes, but we’ll cover the other four areas, starting with something old.
Something Old: What is the “Best” WDRC Release Time?
This has been a common question since the introduction of WDRC processing, led by the introduction of ReSound hearing aids and the K-AMP chip, both birthed ~35 years ago, which makes this topic “old” in the world of hearing aids. Before these products, most hearing aids were linear, with peak-clipping used to limit the output at high levels. Even if the hearing aid had AGCi, the kneepoints were high, and the hearing aids were still operating in the linear mode for most inputs. But when we started using hearing aids with compression kneepoints of 40-45 dB SPL, compression release time became an issue to consider.
Many of you probably haven’t thought much about compression release times since your last hearing aid class, so here is a short tutorial. The terms attack and release times are used to describe compression speed. Attack times refer to how quickly the signal is compressed (i.e., the gain is reduced) when a sound increases in level. On the other hand, release times describe how quickly the gain then readjusts (increases), when a sound falls to a lower level. Older articles on this topic would use the term “go out of compression,” but today, most products default to very low kneepoints, so the hearing aid never really “goes out” of compression.
Most hearing aids have similar, fast attack times in that they are designed to protect the wearer from abrupt, loud sounds. Attack times, regardless of the specific manufacturer, typically range between 2 and 12 milliseconds (ms). When it comes to release times, however, there are considerable differences among manufacturers. Some devices have fast-acting compression, which has release times that range between 5-200 ms. This is sometimes referred to as syllabic compression, as a syllable is ~150-200 ms. Other devices have slower release times, or slow-acting compression with a range from 250-500 msec, to 2 seconds to several seconds.
Is one release time better than another? It depends on who you ask. Some experts believe that syllabic compression restores normal loudness perception and enhances audibility, particularly of high-pitched fricatives for those with a high-frequency hearing loss. Conversely, because slow-acting compression doesn’t change the gain as quickly, it is generally known to sound more natural and create less distortion to speech compared to fast-acting compression, which tends to flatten the speech spectrum. Given that, at least theoretically, one could argue that there is an advantage for either fast or slow compression release times, some manufacturers allow the HCP to select their favorite speed, or what they believe is best based on specific patient characteristics (e.g., degree of hearing loss, listening needs, hearing aid experience, cognitive status, etc)
Shown in Figure 3 are two screenshot examples from the compression adjustment page for a Signia product. This is where the HCP would adjust kneepoints and ratios to obtain the best fit for the patient—this product has two kneepoints as part of the WDRC processing, which then allows for applying curvilinear compression when needed. Observe, for the top example, the release time is syllabic (fast). In the bottom panel, you see that “dual” has been selected. For this product, the term dual means that there is a “fast” component, which only activates with a loud, abrupt sound that occurs; all other times, the release time is “slow” (e.g., ~1800 ms).
Figure 3. Shown are two different screenshots from the programming page of Signia software. Compression times are highlighted by the red boxes. The upper is “fast” (termed Syllabic), and the lower is “slow” (termed Dual).
This takes us to an article by Windle et al (2023) that we reviewed two years ago in Research Quick Takes Volume 7 (Taylor and Mueller, 2024). The focus of the review was on patients with age-related hearing loss, as the authors state that they believe that it is important to recognize that these patients have a combination of peripheral and central, auditory and cognitive decline, and that they should not be treated as “standard.”
Based on their review of ~200 articles on the topic, they proposed a pragmatic approach to hearing aid programming for older adults (over 55 years of age) that could be implemented within typical current fitting appointments. Here is a summary of three of their recommendations that relate directly to compression time constants:
- Slow-acting compression should be considered as the default setting for older adults and should be employed in noisy environments for all hearing aid users.
- There is no good reason that hearing aids should default to fast-acting compression for older adults.
- If fast-acting compression is used, the compression ratio should be reduced to levels that avoid distortion, a value as low as 1.5.
Recall that the recommendations above were based on a systematic review of the published literature. Now, the authors are back in 2026, with the results of a single-blinded, crossover randomized control trial (n=56). The primary purpose of the research was to determine whether normally aging older adults, fitted with hearing aids, report a benefit from, or a preference for, slow or fast-acting compression, and whether this relationship is influenced by cognitive ability, hearing loss, or previous experience with hearing aids (Windle et al, 2026).
Participants were both new and experienced hearing aid wearers, aged 56 to 85 years, with symmetrical mild-to-moderate hearing loss. They trialed hearing aids for 2 months in each of two settings, slow or fast-acting compression. Speech recognition in quiet and in noise was measured, unaided and aided, after fitting with each compression setting. Also conducted were cognitive tests, self-reported hearing aid outcomes, and the participant's preference for the first or second fitting.
The authors summarize their findings as follows (Windle et al, 2026):
- Participants with a greater degree of hearing loss tended to prefer slow-acting compression. The optimum boundary between the preference for "fast" versus "slow" compression speed was a four-frequency average hearing threshold of 35 dB HL in the better ear.
- Neither compression speed offered a significant benefit over the other for speech recognition in noise or quiet.
- Neither cognitive performance nor previous experience with hearing aids predicted the amount of reported benefit or the preference for a compression speed.
The finding that cognitive performance did not predict preferred compression speed somewhat goes against the earlier recommendations from this group (Windle et al, 2023). However, it is consistent with the results of a similar study from Cox and Zu (2010). These authors also found a fairly even distribution between the long and short release time preferences, although nearly all participants had a strong preference, e.g., a 3 or 4 rating on a 4-point scale. And interestingly, if we look at the ½ of their group of participants with the lowest cognitive performance, 45% of these individuals had a strong preference for a short release time. While these are only two studies, it certainly tells us that taking a “one-size-fits-all” approach when selecting compression release times could be risky. See Taylor and Mueller (2024) for some clinical tips and further discussion of this topic.
Something New: DNN-Based Denoising
We promised you something new. Step aside, Bluetooth streaming and rechargeable batteries; the hot new hearing aid feature du jour is DNN-based denoising. As you probably know, DNN stands for deep neural network, and it’s a term closely associated with machine learning and artificial intelligence (AI). Generally, a DNN is a computational model that learns complex patterns from data. We’ll discuss how DNNs work to reduce background noise later, but first, let’s focus on the other term, denoising. It might be a hot term, but it’s not so new.
Denoising is a familiar term in the audio world. Bose and other high-end consumer headphone manufacturers have been using the term denoising for more than twenty years. What is new, however, is that the term denoising is now being used to describe noise reduction in hearing aids. In reality, denoising is just another term that describes noise cleaning or noise cancellation – features that have been employed in hearing aids for decades. What is different, though, is that these new versions of denoising use DNNs, which add a level of complexity to current noise cancellation systems.
To better understand DNN-based denoisers, it helps to briefly review the evolution of noise reduction technology in hearing aids. As readers know, there are two primary ways to reduce unwanted background noise in hearing aids: directional microphones and filtering. The goal for each noise reduction approach is to remove as much unwanted noise as possible with minimal attenuation of the speech signal; however, they accomplish this in very different ways. Directional microphones do this by relying on the spatial separation of speech and noise – sometimes called spatially based noise reduction. They accomplish this by reducing sounds in specific areas around the listener, depending on the design of the directional microphone system.
In contrast, filters – also called processed-based noise reduction - use sophisticated calculations to reduce noise confined to a specific spectrum. There is a long history of different approaches to noise reduction filtering that goes back to the analog days of the 1980’s, including such features as the Zeta NoiseBlocker, Manhattan II circuit, and Wiener filters. All the earlier versions of noise reduction took the same basic approach: analyze incoming sounds, identify speech patterns from background noise, and selectively reduce unwanted noise using filters. They all had one major limitation: if the filtering was too aggressive, some of the important speech energy, embedded in the same part of the sound spectrum as the noise, was also attenuated—hence, the strength was limited. This issue was evident in dozens of studies that showed, unlike directional microphones, process-based noise reduction (filtering) did not improve the signal-to-noise ratio of the listening environment of the hearing aid wearer. Many of these noise reduction filtering techniques, however, were proven to improve the overall listening comfort and effort of the wearer.
An important question for clinicians is how DNN–based denoisers differ from traditional, process-based noise reduction or filtering. To address this, it is helpful to briefly review how machine learning and artificial intelligence are applied to noise reduction. The following description intentionally simplifies the process (We are guessing that none of our readers are data scientists!), but it captures the core concepts. Most DNN-based denoising systems involve four essential steps that are illustrated in Figure 4.
- Defining the “ideal” signal. Data scientists or audio engineers first define what the system should amplify. These “target” sounds are typically clean speech signals, as speech is the most important and desired signal for most hearing aid wearers. However, the target could be any sound of interest, depending on the design goal of the engineers
- Presenting real-world inputs. The system is then exposed to large numbers of real-world audio samples that contain speech mixed with many different types of noise. These noisy inputs are paired with their corresponding target (clean) signals.
- Training the neural network. Through repeated mathematical adjustments across multiple layers of the neural network, the system learns how to transform the noisy input so that it more closely resembles the target signal. In effect, the DNN learns patterns that distinguish speech from noise.
- Improving with experience. As the system is trained on more diverse acoustic scenes, its ability to generalize improves. With sufficient training, the DNN becomes increasingly effective at adjusting incoming sounds to better match the defined “ideal,” even in listening environments it has not encountered before. It is important to note that this training and the DNN’s improvement with experience occur before the hearing aid is fitted and cannot be adjusted or fine-tuned unless there is a firmware update.
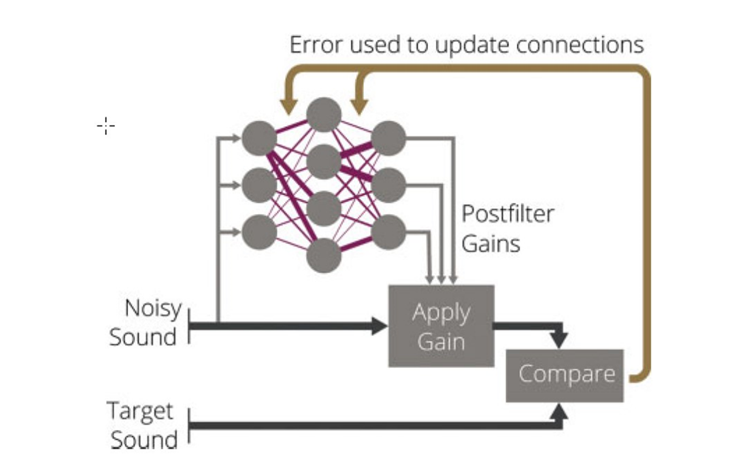
Figure 4. The essential features of a DNN-based denoiser. The circles in the illustration represent the multiple layers of the DNN that are trained and improve with experience.
Compared to traditional static or fixed noise reduction filters, DNN-based denoisers represent a fundamental shift in how unwanted noise is processed by hearing aids. Conventional noise reduction algorithms are rule-based. This means they rely on predefined rules or signal characteristics—such as modulation rates or sound energy peaks—to estimate and reduce noise. As a result, their effectiveness is often limited in complex or rapidly changing listening environments. In contrast, DNN-based denoisers are data-driven rather than rule-based. They learn directly from large collections of real-world acoustic scenes how speech and noise differ across time and frequency. This allows them to adapt more flexibly to diverse listening situations, better preserve speech details, and reduce noise in ways that more closely align with how listeners perceive meaningful sound. For hearing aid wearers, this means the potential for improved speech clarity and listening comfort, particularly in challenging environments where traditional noise reduction has been historically limited.
Here is a little more detail on this difference between the two noise reduction approaches: Rules-based systems (filtering) apply human-designed logic to decide when and how much noise reduction to apply. The filters are fixed or static as per the decision of the engineers. On the other hand, data-driven (DNN-based) systems learn the mapping from noisy input to desired output from large datasets, without explicit signal-processing rules for every condition. These datasets and training protocols are also based on the decisions of engineers.
Before you get too excited about the potential performance improvements associated with DNN-based denoisers, it is important to acknowledge their limitations. The most notorious drawback is their power consumption requirements. The sheer number of mathematical calculations requires an enormous amount of electrical power, which shortens the number of hours the hearing aids can be worn before a recharge is needed. Today, DNN-based denoisers require ~200% more power than other types of noise reduction processing, so manufacturers must be very selective when the denoiser is activated.
Another limitation is artifacts, unwanted or unintended sound from the amplification process, audible to the wearer. Artifacts or distortions can be highly annoying and distracting, and can lead to poor outcomes and even non-use. Unlike traditional filters that apply relatively smooth, predictable processing, DNN-based denoisers make highly specific, data-driven adjustments that can sometimes overshoot or misfire. This is primarily related to the assumptions embedded in their training. Recall that DNNs are trained to make incoming sounds resemble an “ideal” target signal. When the input does not closely match patterns the network has seen during training—such as unusual voices, accents, music, or novel noise types—the DNN denoiser must guess. When the DNN denoiser is trained to optimize speech, it may incorrectly suppress or alter parts of the speech signal. This can produce distortions such as musical noise, speech distortion, or a “warbling” quality. On the other hand, when the DNN denoiser is optimized to strongly reduce noise, it may partially remove low-energy speech components, leading to speech sounding thin or unnatural. This tradeoff between noise suppression and speech preservation is inherent in all denoising systems, and each manufacturer has their own unique approach to DNN-based denoising, as discussed below.
Finally, artifacts in DNN denoisers can arise from mismatches between what sound inputs they were trained on and the real-world input sounds they attempt to process. For example, differences in how the incoming sounds are captured (microphone characteristics), compression/gain settings in the hearing aid, and the effects of room reverberation can cause the DNN denoiser to apply inappropriate corrections. This is a big reason why DNN-based denoisers may sound impressive in some environments yet produce noticeable artifacts in others, particularly when listening conditions deviate from those represented in the training data. For clinicians, the key takeaway is that DNN-based denoisers work best when the acoustic input that is processed with the hearing aid’s maximum output, compression, and directional microphones parameters closely match the conditions the system was trained on. When there is a mismatch, the risk of artifact increases, even if the noise reduction is aggressive.
Although artifacts in current DNN-based denoisers should be a concern, it certainly looks like they are replacing traditional static filtering methods. However, it also appears that DNN-based denoisers will augment, and not replace, directional microphone systems. Eventually, hearing aid wearers might benefit from both types of noise reduction technologies, directional microphone systems and DNN-based denoisers, working together to maximize speech understanding and listening comfort in noise.
As of February 2026, there are four hearing aid brands (Oticon, Phonak, ReSound, and Starkey) with DNN-denoisers in their latest platform—we’ll review recent studies from three of these manufacturers. Each study we review represents the first iteration of that company’s denoiser. Consequently, it is important to note that since these studies were published, their latest DNN-based denoiser might result in slightly different outcomes than we report on here. Nevertheless, the findings we report illustrate some interesting differences between their approaches to denoising.
The first study comes from Oticon. It is an evaluation of their denoiser that was commercially launched a few years ago. Christensen et al (2024) used a real-world, within-subjects ecological momentary assessment (EMA) design to compare listening experiences with two premium hearing aid models that differed primarily in noise-reduction approach. One model (HA1) used traditional statistical noise-reduction processing, and the other (HA2) used a deep neural network DNN–based noise reduction. Forty experienced hearing aid wearers completed repeated EMAs several times per day across two separate 14-day wear periods, yielding 3,614 individual assessments and over 6,800 hours of logged sound data. At each prompt, participants used EMA to report on perceived noisiness and listening satisfaction while ambient sound pressure levels (SPL), signal-to-noise ratios (SNR), and hearing aid volume adjustments were recorded.
Mean satisfaction ratings did not differ significantly between traditional and DNN-based noise reduction. The researchers also found no difference between the two noise reduction approaches on measures of perceived noisiness. Notably, satisfaction with the traditional noise-reduction model (HA1) varied with the SNR of the listening situation — wearers reported lower satisfaction in poorer SNRs. In contrast, satisfaction with the DNN-based model (HA2) was consistent across SNR levels, suggesting that DNN processing may buffer the impact of background noise on the wearer’s experience. Results of this study suggest that hearing aids with DNN-based noise reduction appear to deliver more consistent real-world satisfaction in a wider range of noise environments compared to traditional systems, even though average satisfaction scores were similar between the two noise reduction approaches.
Our second study involves Phonak’s DNN-based denoiser, also launched in 2024. This study was conducted at Mayo Clinic in Rochester, MN. Saoji et al (2024) evaluated how a DNN-based denoiser affected speech perception outcomes that are commonly used in cochlear implant (CI) candidacy evaluations. Ten adults with severe hearing loss completed speech recognition testing using AZ Bio sentences in both quiet and multi-talker babble noise at 5 dB and 10 dB signal-to-noise ratios (SNRs). The test was completed with speech presented at a fixed 60 dB SPL and speech and noise presented from 0 degrees azimuth, a common method to conduct speech audiometry during cochlear implant evaluations. Three hearing aid programs were compared: a calm listening program, a speech-in-noise program, and a DNN-based noise reduction program. In addition to aided AZ Bio scores, the study used the Hagerman phase inversion technique to estimate SNR improvement and the Hearing-Aid Speech Perception Index (HASPI v2) to predict speech intelligibility outcomes.
Benchtop measures of objective SNR improvement using the Hagerman technique showed an estimated 4–5 dB SNR improvement with the DNN program versus the other two programs, suggesting that the DNN-based denoiser more effectively enhances the speech signal relative to background noise. On the AZ Bio, the DNN-based denoiser yielded 20 to 32% better sentence recognition in noise compared to the calm listening program, indicating a significant benefit in challenging environments. However, note that the testing was conducted at 60 dB SPL and that the hearing aids were manually activated to be in the three hearing aid programs. The DNN-based denoiser would not be automatically activated in a real-world listening situation that was this quiet. Therefore, even though the results of this study show good efficacy (the denoiser works), it has relatively poor effectiveness (it is unlikely to work this well in the real-world under typical wearing conditions).
One noteworthy finding of this study involves its target population: adults with severe hearing loss who undergo a cochlear implant evaluation. Because many CI candidacy guidelines use speech recognition performance (e.g., <60% in the best aided condition per the 60-60 guidelines) to determine eligibility, the improved aided performance with DNN-based denoisers could elevate scores above candidacy cutoffs for some patients, potentially delaying or precluding the need for cochlear implants in some cases.
The final study we review examines Starkey’s first iteration of DNN-based denoising, found in their Edge Mode feature. Like the previous study, Fitzgerald et al (2025) used the Hagerman technique to objectively measure SNR improvements on the KEMAR in the lab. Additionally, they conducted several speech-in-noise tests (CNC +5 dB SNR, QuickSIN, WIN, and NST +5 dB SNR) on 20 adult hearing aid wearers, comparing performance with and without the DNN-based denoiser activated.
On the objective benchtop test, like the previous study, the Edge Mode denoiser resulted in greater SNR enhancement in noisy environments than the default program, with up to ~13 dB predicted SNR improvement in some conditions relative to traditional noise reduction conditions. Results of the lab-based speech in noise testing (CNC +5 dB SNR, QuickSIN, and WIN) showed that the DNN-based denoiser yielded small but significant improvements compared to the default processing. However, no significant benefit was seen on the NST +5 dB SNR test, likely because that test used speech-shaped noise rather than multi-talker babble. Given that there was no improvement in aided scores between the DNN-based denoiser and traditional noise reduction, this version of denoising was not trained on speech-shaped noise. This illustrates one of the limitations of DNN-based denoisers: if the DNN system is not trained in a specific type of noise, the DNN system is likely to be no better, or less effective, than traditional fixed filters.
As we previously stated, DNN-based denoisers represent the future, and they are likely to only improve over the next several years. Based on the research to date, however, we conclude this section with some final thoughts on DNN-based denoisers: When DNN-based denoisers are used in combination with beamforming technology, they provide an added layer of noise reduction benefit in adverse listening situations (<80 dB SPL, 0 dB SNR or worse), but given their current power consumption requirements and susceptibility to artifact, for most wearers, and in most listening environments, they currently do not outperform traditional process-based noise reduction algorithms. Stay tuned, though, as these findings are likely to change as DNN-based denoisers become more sophisticated and as manufacturers incrementally improve some of the current limitations.
Something Borrowed: Are There Good, Better, and Best Hearing Aid Categories?
The good, better, best tiered pricing strategy has been around since at least the early 1900s, when it was used in the automotive industry. The reason it is used is quite obvious—in most cases it increases sales and profits. We are not certain when this approach was first used with hearing aids, but certainly, it was fueled by the introduction of programmable products in the late 1980s. When companies first introduced their programmable product, the HCP now had two choices for their patients: programmable (Best) or the old-fashioned non-programmable (Good). Within a few years, most companies had introduced a two or three-channel programmable (Best), and as a result, the single-channel programmable slid down a notch (Better), and we still had our entry-level non-programmable (Good).
Today, a tiered product pricing structure is used by most hearing care professionals selling hearing aids, and in fact, in some offices, the introduction of OTCs has added a 4th level (see Mueller and Taylor, 2025 OTC review). Whether you’re buying a television, dishwasher, mattress, or bread-making machine (all with tiered pricing), it is only reasonable to question: Is there really a significant difference among the products in the tiers? Can I really see a difference between 2.1 vs 8.3 million pixels? To no one’s surprise, researchers have understandably also questioned this relative to the tiers of hearing aids.
Much of the well-designed research comparing the products from different tiers within the same company has come up with only a marginal benefit for the Tier 1 product. The research is difficult to interpret for real-world practice, however, as by the time the data are published, the product that was once Tier 1, has been replaced by a “better” product, and the previous Tier 1 product is now Tier 2, or entry level. Additionally, the tier portfolio (regarding features) from one company might be very different than that of another.
Another issue regarding much of the published comparative testing is that many of the objective test conditions do not represent real-world hearing aid use—repeating back QuickSIN sentences presented from a loudspeaker at 0 degree azimuth is quite different than engaging in a conversation at a noisy cocktail party. As hearing aids become more sophisticated in their ability to detect azimuth-specific speech and/or noise and alter processing accordingly, the need for real-world scenarios becomes even greater. To address this issue, we have the findings from the Western University research group.
Glista et al (2024) assessed the relationship between subjective preference ratings for different hearing aid technology levels using Ecological Momentary Assessment (EMA). In addition, they examined whether preferences were associated with participation in socially involved situations. Rather than use different models of hearing aids representing different tier levels, they utilized a “master hearing aid” product from one manufacturer that could be programmed to simulate the traditional good, better, and best processing. The three programs under investigation were configured to offer the maximum signal processing of each feature for that level of technology. These features included: beamformer, noise canceller, speech enhancement, and speech target location. Over a two-week collection period, EMA surveying was completed indoors (at home), indoors (away from home), outdoors, and while in a listening situation with at least one communication partner.
Survey data captured in-the-moment details surrounding the environment, activity, and listening preference of the study participant. When compared to entry-level technology, participants reported a preference for both premium and mid-level technology levels. These findings were found for: a) indoor listening environments (at home and away from home), and b) in environments that included background noise categorized as quiet, non-speech, and speech. A preference for the premium-level technology over the mid-level technology occurred when the hearing aid users were located indoors or outdoors the home, and the background noise was specific to speech. In general, at least to some degree, technology preference varied according to reported activity location.
In our opinion, the use of EMA makes the findings from this study a little more meaningful than some of the other published data. It’s important to note that for some of the features that were involved, the Tier-to-Tier differences were so small that we wouldn’t expect the participants to have a preference (e.g., max noise reduction 4 dB for Basic, 6.4 dB for Premier). Is there a takeaway from this research for the average HCP? Maybe. If a patient asks if there really is independent research showing an advantage for mid-level or premier vs. entry-level, you can say “yes.” But, as we mentioned earlier, by the time you read this, the entry and mid-level products from this company might be quite different than when the study was conducted. And, we really don’t know if entry-level from one manufacturer isn’t superior to premier from another.
Does Research Support New Technology?
If you follow the promotional literature from hearing aid companies, you know that “something new and better” is introduced every year, or at least, every two years (A good example of this is the various types of DNN-based noise reduction that we reviewed earlier). It’s reasonable to ask, is what is new really better, or just different, or something old given a new spin? If you ask to see research data showing that it’s really “better,” there is a good chance you’ll be referred to a company's “White Paper.” This sounds impressive, but consider the definition of a white paper: “the main purpose of a white paper is to act as a persuasive report; to advocate for a specific position or solution on a particular issue.”
There was a time when new technology was introduced, and it would go through a rigorous experimental evaluation by noted researchers from established audiologic research centers. For example, back in 1999, to see what products were the best when we combined directional processing with DNR, we looked at the work of Todd Ricketts and Sumit Dhar (Ricketts and Dhar, 1999). Todd and Ben Hornsby provided us with data showing the benefits of combining modulation-based DNR with Wiener filtering (Ricketts and Hornsby, 2005). And it was Ruth Bentler, Catherine Palmer, and Andrew Dittberner (Bentler et al, 2004) who reported that with the new directional processing of Siemens, individuals with moderate hearing loss could understand speech in background noise as well as someone with normal hearing. These were not White or Gray Papers; they were peer-reviewed articles published in highly respected audiology journals. So, what’s our point? The next article we’ll review, which examined new hearing aid technology, was published in a peer-reviewed journal and conducted by independent researchers from Western University (Folkeard et al, 2024).
Experienced hearing aid wearers were fitted bilaterally with products with two different programs (see processing difference explained below). A unique feature of the study is that data collection occurred in a moderately noisy food court at a local mall—see photo of actual test condition below in Figure 5.

Figure 5. Photo of actual ongoing data collection for this research.
Participants were asked to listen to a conversation between two researchers and rate the extent of their agreement with 10 positively worded statements specific to the conversation (using a 7-point Likert scale). This rating was conducted once for each program. Participants also provided program-preference ratings for seven different aspects of a conversation during which the programs were switched back and forth by the researcher.
The following are the ten statements rated during the single-program absolute rating task:
1. I can understand what is being said in the conversation.
2. I hear my conversation partners clearly.
3. The volume of my conversation partners is just right.
4. I don't have to work hard to follow the conversation.
5. I can focus on the conversation in front of me.
6. I find the sound of my conversation partners pleasant.
7. The voices I am listening to are coming from the correct direction.
8. The background noise I hear is at an appropriate level for communicating.
9. The overall loudness is just right.
10. I am satisfied with the overall sound.
The hearing aids were verified and adjusted to be within +/- 5 dB from NAL-NL2 targets—RMS error was calculated. All programming was the same for both products, except for a new feature, described below for Processing B.
Processing A: Used as the comparison. This technology has adaptive monaural beamformers pointing in the front and back directions to enable speech from the front to be processed differently than noise from the back, allowing for greater noise reduction to be applied for these signals.
Processing B: This processing has the commercial name RealTime Conversation Enhancement. It includes the same split processing as described above, but additionally, an acoustic scene analysis estimates the locations of nearby talkers. That is, signals are analyzed continuously to detect whether relevant speech is present in front of the wearer's area. The detector is designed to differentiate between relevant speech coming from conversation partners in proximity to the wearer and irrelevant speech (e.g., random and distant voices). A localization feature is also enabled, where each relevant talker position is determined.
Results revealed that the participants' ratings for all domains resulted in positive average values for both types of processing. Data analysis, however, indicated that the new algorithm (Processing B) had higher absolute ratings on five of the 10 criteria, including understanding, clarity, focus, listening effort, and background noise. Ratings for preference between programs also indicated a significant preference for the new algorithm for all seven criteria.
The OTC Hearing Aid World
When we look at the recent hearing aid literature, it’s very obvious that writing about the OTC product has become fashionable. We now have 6 different FDA classifications of hearing aids. A summary of the 6 is shown below (adapted from Bailey, Updated February 9th, 2025). To put this into perspective, when Bailey published the summary below in February, 2025, there were 142 OTC products available—that number has most probably increased at this reading.
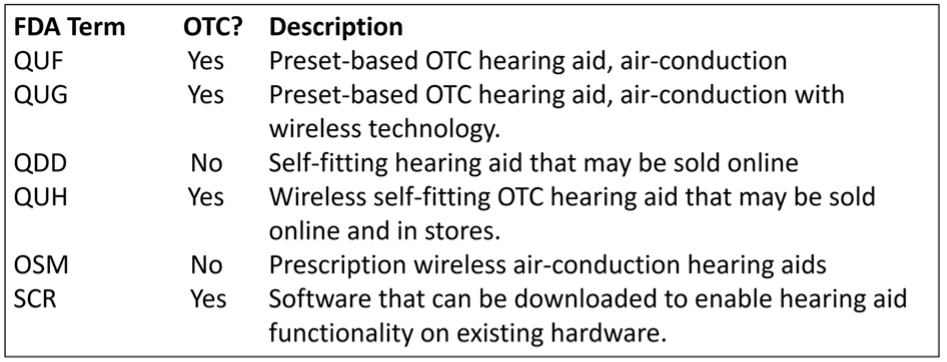
With the nearly 200 new OTC products, and all the recent research with these instruments, you’re probably thinking—if only I could simply read a review article that summarized all the findings? We can take care of that! So yes, a total shameless plug . . . we just published an extensive review, worthy of 4 CEUs, in AudiologyOnline (Mueller and Taylor, 2025; Course 41370.
11.4: Selection and Fitting
In this section, we’ll look at some recent research regarding some specific goals and measures. We’ve found some articles about old things—like autoREMfit and compression release times but also have some good recent information regarding ethics and best practice.
Establishing Fitting Goals.
When we think of fitting goals, and we want to add some organization to our selection protocol, a handy tool is the COSI. This is a self-report scale that we have addressed in several previous Volumes of QuickTakes (e.g., see Taylor and Mueller, 2024; Taylor and Mueller, 2023). In addition to the use of the COSI as an outcome measure, it is very useful in determining patient needs and fitting goals.
For the unfamiliar, the COSI is often used during the hearing aid evaluation appointment to target and document up to five listening situations where the patient is having communication difficulty, and where hearing aids will provide benefit. It is considered an open-ended self-report because, rather than rely on a pre-established list of situations to choose from – places where the patient might have difficulty communicating, the COSI relies on the patient and the clinician working together to create an individualized list, tailored to the needs of the patient. Now, we usually consider this as a good thing, as after all, doesn’t the patient know best? That takes us to the following article.
How Important Are the Sounds of Nature?
A recent Ear and Hearing report by Lelic et al. (2025) was titled “Sounds of Nature and Hearing Loss: A Call to Action.” What is this “call to action,” you might ask. It goes back to our discussion above, related to the COSI. The authors found that before their hearing aid fitting, few of their participants mentioned listening to nature sounds as being a priority outcome for the fitting. After using hearing aids, however, several patients specifically expressed the enjoyment of hearing nature sounds. The authors state that these patients: “described the rediscovered nature sounds as wonderful, pleasant, and relaxing, . . . contributing to their quality of life.”
The observations were based on the “positive reports” comments from the patients following their initial experiences using hearing aids. The authors present data illustrating the frequency ratings by their participants of the nature sounds mentioned in their positive experiences. In case you’re curious, Figure 6 below shows the top six ratings.
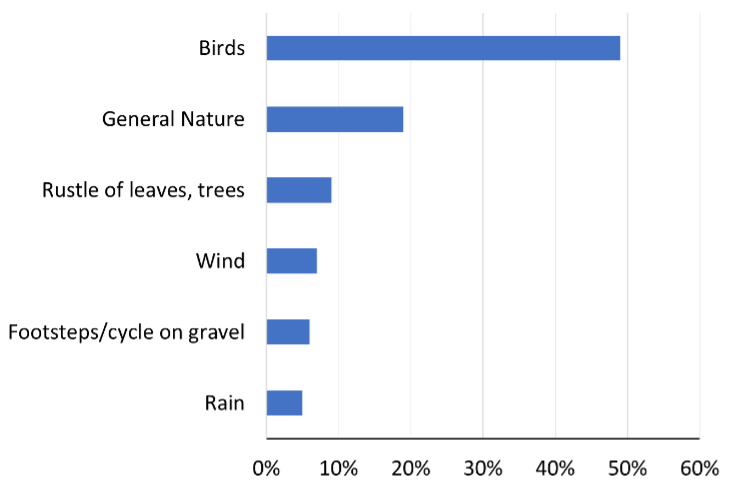
Figure 6. The six nature sounds that received a positive mention in at least 5% of the reports:
Most of you have listened to the reports of new wearers of hearing aids, and the ranking of birds probably doesn’t surprise you. A point made by the authors is that we need to ensure that the processing of the hearing aids does not work against the audibility of these nature sounds. There was a time when HCPs would give patients multiple programs that they could switch between—quiet, noise, music, and yes, maybe “nature.” Who can forget the Widex Quattro, introduced in the early 1990s, which had four programs! Today, however, most HCPs rely on the “magic” of the hearing aid itself to identify the listening situation and then program the hearing aid correctly.
Obviously, for listening to nature sounds such as birds, you would not want active noise reduction or directionality. One thing, however, that is often overlooked is the audibility of soft sounds, as in fact, many of these nature sounds are soft. We, of course, also need appropriate gain for soft speech, something we’ll talk about later. Even HCPs who routinely conduct probe-mic measures and verify to a validated target sometimes skip the step of matching to the soft-input target—in case you haven’t thought much about it, it's very possible to under-fit the soft target by 10 dB, when you’ve only under-fit the average-input target by 5 dB—and yes, 5 dB matters!
We know that many, if not most, HCPs do not verify validated targets, but rather select the default fitting of their favorite manufacturer. This can be very risky. Shown below in Figure 7 are the default fittings for a 55-dB-input (slightly soft) for the premier hearing aid for three major manufacturers. This information is available at HearAdvisor.com if you’re interested.
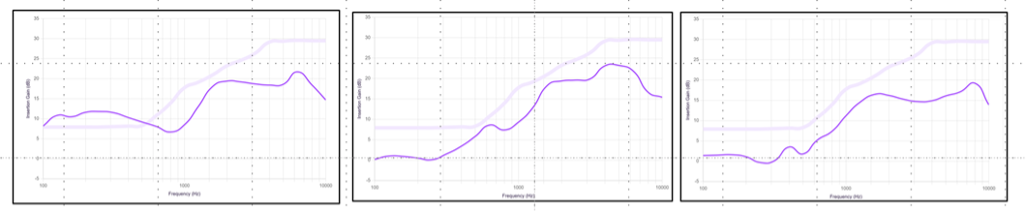
Figure 7. Resulting insertion gain for the premier product for the default fitting of three different manufacturers for a 55-dB SPL input. The upper light pink curve represents the NAL-NL2 targets, and the lower, darker pink curve is the actual gain measured.
Note that mistakes of 5-10 dB are common, and can be as big as 15 dB (see the far-right product). Not that things could get much worse, but consider that these measures are for 55 dB SPL—soft speech and nature sounds certainly could be softer, and the impact of the mistake would be even greater.
Probe-Mic Verification Might Not Be Necessary—WHAT?
For those of you who are not doing probe-mic verification and are really tired of the rest of our profession suggesting that you’re a slacker, do we have an article for you!
First, a little background. Going back 20-30 years, manufacturers have provided an option in their fitting software, which was advertised to program the hearing aids to a given validated fitting approach (e.g., NAL, DSL). It, of course, was then only reasonable for researchers to determine if this really happened. You can review most of this research in Mueller et al (2017) and Mueller (2020), but here is one example: Aazh et al (2012) found that when products were programmed to the “manufacturer’s NAL,” only 29% were within 10 dB of NAL targets. All studies have shown that the manufacturer’s NAL (going back to NL1 days) would underfit, and yes, often by as much as 10 dB. An example below (Figure 8) is from the premier hearing aid of the 5 leading manufacturers (Sanders et al, 2014). The “0 dB Line” is the NAL-NL2 fitting.
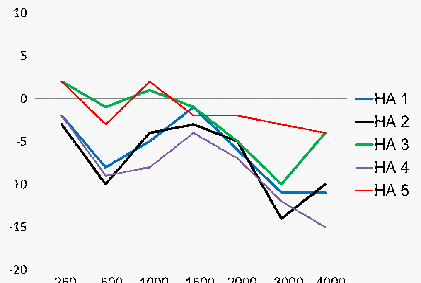
Figure 8. Mean deviation from NAL-NL2 targets when NAL-NL2 is selected in the manufacturer’s fitting software (n=16 fittings). Results shown for the premier hearing aid from the five leading manufacturers.
Note that for all but one product (HA 5), the match to target begins to roll off (relative to NAL targets) starting around 1500 Hz. The data shown here are the average of 16 ears, 8 male and 8 female, so it isn’t like this deviation is caused by one person with a very unusual RECD.
Why is it, historically speaking, that manufacturers have not been able to achieve true NAL targets? You’ll have to ask each one individually, but the word on the street has always been: They don’t want to! The majority of HCPs do not conduct probe-mic testing, and therefore, have only a vague idea of what SPL is delivered in their patient’s earcanal. Hearing aid fittings with reduced high-frequency gain are less likely to have feedback, don’t sound “hissy,” and probably are more likely to put a smile on the patient’s face on the day of the fitting than a true NAL fitting.
So, with that introduction, on to the article (Almufarrij et al, 2024). The title is somewhat of a tipoff: Is the role of probe-tube, real-ear measurements changing for adults with mild-to-moderate hearing loss? The data were collected from 256 new adult hearing aid users (456 ears) with mild-moderate hearing loss. Deviations from NAL-NL2 targets (input signal 65 dB SPL ISTS) were calculated for three conditions: The initial fit when NAL-NL2 was selected in the fitting software, following audiologists’ adjustments after the initial fit, and following audiologists’ adjustments after patient comments.
The main findings of the study were that there was little improvement in the median deviation from target following the audiologist adjustment vs. initial fit, except at 4000 Hz, where there was a 3 dB improvement for the audiologist fit (initial fit was below target). The range of deviations at each frequency was reduced for the adjusted fittings for 2000 and 4000 Hz, but not for other frequencies. As might be expected, deviations from targets were significantly higher for open fittings and more severe hearing loss.
Based on their findings, the authors provide some choices for HCPs to consider (note: they use the acronym REM for “real-ear measures,” which in this case is referring the use of probe microphones):
- Choice #1: Conduct REMs and fine-tune everyone. Authors’ Comment: Frequently used in current practice, but no longer a good use of time if fine-tuning is of no material benefit.
- Choice #2: Conduct REMs for everyone, and fine-tune if the error exceeds an agreed criterion. Authors’ Comment: Requires agreement on when deviation from the target becomes unacceptable.
- Choice #3: Conduct REMs only for patients at risk of a large deviation. Authors’ Comment: Unclear how these individuals will be identified. In this study, deviations were higher for open fittings and more severe hearing loss.
- Choice #4: Conduct REMs for patients fitted with products known to have a poor initial fitting. Authors’ Comment: Good use of time if the initial fitting has been measured and shown to be unacceptable.
- Choice #5: Conduct REMs for troubleshooting. Authors’ Comment: Does not exclude other options above, such as Choice #2.
Before you put the dust cover on your probe-mic equipment, there are a couple of factors to consider, acknowledged by the authors. First, these data are all from hearing aids from the same manufacturer; the fit-to-target from other manufacturers could be much worse. Additionally, only a 65 dB input signal was used. As we discussed earlier in this section, appropriate gain for soft inputs is essential for a successful hearing aid fitting. It is nearly always the case that the fitting error of the initial fit is greater for soft (e.g., 50 dB SPL input) than for average (e.g., 65 dB SPL input).
Evidence For The Use of Probe-Mic Measures
An interesting aspect of the article we just described is that it indirectly assumes that most HCPs believe that probe-mic verification is essential. If only that were the case! Importantly, we use the term “probe-mic verification”—that is, testing to ensure that the real-ear output meets that of a validated procedure (e.g., NAL or DSL) for soft, average, and loud inputs. On the audiology Facebook sites, you’ll see casual surveys, polls, and comments regarding “doing REMs.” One can only guess what this means. We know that many HCPs simply fit to the manufacturer’s default fitting, then “do REMs,” but make no changes to the fitting.
What percentage of HCPs actually do probe-mic verification? Hard to say, as most surveys on this topic are not valid (see review by Mueller, 2005; Mueller and Picou, 2010). Mueller et al (2023) provide an example of this, citing a published survey reporting that the use of probe-mic measures was ~60%. The problem, if you dig into the details, is that this survey had an incredibly low response rate, which was 88 of 1220 audiologists, even after two reminder emails. That’s 7%! Here is our take on this survey, and many other surveys or Facebook polls that focus on what is common clinical practice. Audiologists are very well aware of Best Practice and what “should be” done clinically. If you sort-of know what the right answer is, but you’re not doing it, it very well could be that you simply don’t complete the survey. Clinical trainers/educational specialists from manufacturers, who go office to office on a daily basis to conduct assistance and training, estimate that the use of probe-microphone measures to verify prescriptive targets is no higher than 20-30% (Mueller, 2014).
What will it take to cause the majority of HCPs to follow Best Practice? Could it be that they don’t believe that a fit to target will improve patient benefit and satisfaction? Or, that simply conducting probe-mic testing will improve patient loyalty? There is ample information, based on solid research, supporting all of this (see Mueller, 2020, for review), but we’re always happy to add one more to the list—maybe this one will make a difference.
Look no further than Amyn Amlani’s article in the December 2025 issue of Audiology Practices to appreciate how much of a difference best-practice hearing aid delivery outpaces the willy-nilly approach of relying on the hearing aid manufacturer’s first-fit. In the article, Amlani refers to this as non-best-practice (NBP) fittings. The findings are based on retrospectively collecting anonymized chart notes of 638 hearing aid wearers from seven clinics. These participants were divided into three groups: non-best practice fittings (NBP), best-practice (BP) fittings, and self-fittings (SF; OTC users). Factors such as cost, RMS fitting error, and self-report outcomes (e.g., APHAB Global) were collected and compared, as well as the economic impact for each of the three groups.
Findings included that the BP and SF groups had better outcomes than the NBP group, and not surprisingly, the SF group attracted patients at a younger age. All told, both BP and SF delivery modes yielded significant patient benefit and better economic value compared to the NBP mode of delivery. Think about it . . . if a patient purchased OTCs, these data indicate that he or she would be better off fitting themselves, rather than paying an HCP who didn’t use Best Practice. Amlani (2025) concludes: From a health services perspective, this level of unwarranted clinical variation signals failure in quality assurance and highlights the need for enforceable professional standards. Collectively, these results demonstrate that NBP fittings are not merely less efficient—they are predictably inaccurate, clinically indefensible, and ethically problematic.
Notice that Amlani mentions “ethics”, a term that is also in the title of the article. As you may recall, several years ago, Catherine Palmer (2009) pointed out that not conducting probe-mic verification could be considered a breach of the Code of Ethics of many professional organizations and state licensure. For example, Principle 4 of the American Academy of Audiology's Code states: “Members shall provide only services and products that are in the best interest of those served.”
The Role of autoREMfit
Hopefully, articles like that of Amlani (2025) will encourage more HCPs to adopt probe-mic verification—for now, we’re going to talk about a procedure that directly relates to those of you already conducting this measure—something called autoREMfit. If you’re not familiar with this procedure, here is a little background.
We’ll start with two points. First, this is not something new. Mueller (2001) discussed this 25 years ago and showed examples using Siemens products and the Unity probe system. A second point is that there doesn’t seem to be an agreed-upon name for the procedure. Each hearing aid manufacturer seems to come up with their own, so you might hear: REM Auto-Fit, TargetMatch, AutoREM, or AutoFit, to name a few. Mueller and Ricketts (2018) used a new term that wasn’t taken by a manufacturer, which we’ll use here: “autoREMfit”. For starters, REM (pronounced “rhem”), stands for Real Ear Measure—essentially what we have been doing in the clinic since 1983. The “auto” part of it is that the probe-mic equipment and the hearing aid fitting software talk to each other. The hearing aid fitting software collects ongoing real-ear information from the probe-mic system, and then makes changes in the hearing aid output, based on some preliminary measures, and measured ear canal SPL at the moment. The notion is that these automatic adjustments will make the fitting closer to a pre-selected, prescribed target output, such as that of the NAL-NL2 or the DSLv5.0.
The “fit” part of the term is that, in theory, the resulting fit-to-target should be about as good as that which could be obtained manually by an experienced audiologist using the programming software. The assumed advantage is that you would get the job done faster, especially when conducting simultaneous bilateral fittings. Research suggests that this is true (Folkeard et al, 2018).
Importantly, not all hearing aid brands are compatible with all probe-mic equipment for conducting autoREMfit. Also important is understanding what software is driving the fitting—that of the probe-mic equipment or that of the fitting software? Why does that matter, you ask? If the probe-mic equipment is in charge, the hearing aids will be fitted to the “true” stored targets of either the NAL or the DSL. Maybe not for the DSL, but for the NAL, we know that most manufacturers have altered the targets (under-fitting), so if the hearing aid software is running the show, and these targets are used, what you think is an autoREMfit just might be an autoREM-no-fit! More on that later.
This takes us to the recent article by Brand (2025). The notion that the marriage between the probe system and the fitting software can automatically result in a good (acceptable) fitting sounds almost too good to be true. It’s only reasonable to empirically check this out, and researchers have. Usually, however, it’s only centered on one brand of hearing aids (e.g., Latzel et al, 2017; Pumford and Mueller, 2021). The Brand (2025) article, however, evaluated four major manufacturers.
AutoREMfit was conducted for several different hearing losses, models, and earmold configurations. The combined RMSE for the three input levels, for the four different brands, is shown in Figure 9.
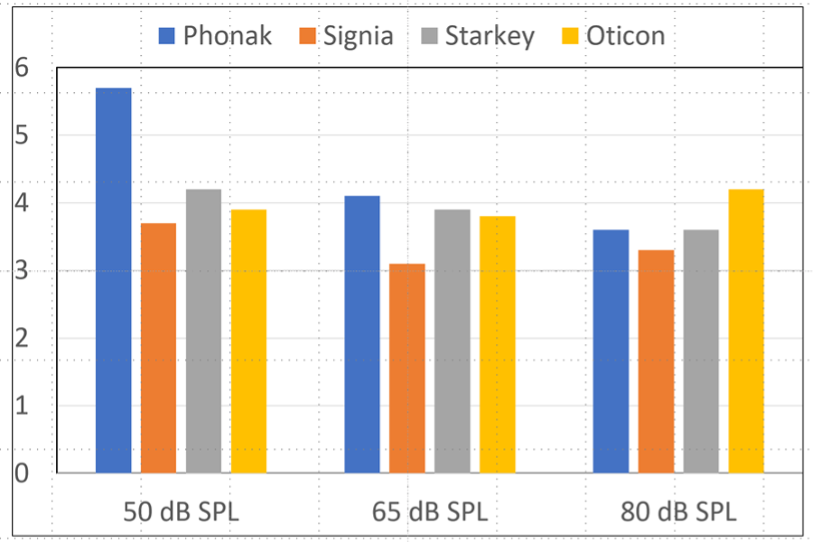
Figure 9. RMSE following autoREMfit for three inputs for four different brands of hearing aids.
As shown in Figure 9, the RMSE is fairly similar for all products and all input levels. Brand (2025) does note that overall, Signia was slightly better, and all RMSEs (except for Phonak for the 50 dB input) were less than 5 dB, the value considered “acceptable” by some fitting guidelines. The RSME findings are fairly similar to those of Pumford and Mueller (2021), who only tested the Signia product but included two different audiograms and two different earmold types—all of their RMSEs were ~2 dB. Importantly, these researchers used the Verifit probe system, one of the probe-mic products (maybe the only one) that controls the fitting software, meaning that the true NAL is being employed in the autoREMfit process.
Before we get too excited about these relatively good RMSEs, there are a couple of things we’d like to mention that could have impacted the calculations. The first one is something that could have made the RMSEs larger, but has little clinical significance. We were surprised to see that for the RMSE calculations, 6 (40%) of the 15 data points used were below 1000 Hz. This gives considerable weight to the RMSE for frequencies that have a much smaller weight for the SII, and in many fittings, are really of little interest. Moreover, regarding making the RMSEs larger, in cases where the patient has normal or near-normal hearing, and little or no gain is prescribed, it is common that the REOR is larger than the hearing aid output. This is true for frequencies below 1000 Hz, even when closed instant-fit tips are used—venting at 500 Hz is still around 8 dB—and becomes considerably larger as the fitting becomes more open (Balling et al, 2019). Hence, we would expect to see large REOR-generated RESEs in these lower frequencies—it doesn’t seem fair to penalize the autoREMfit for this!
A second point we’d like to make is that 72 (70%) of the 102 data sets were collected with the hearing aids placed on a manikin—the Clinical Assistant for Research and Learning, better known as CARL. We would expect the manikin findings to be better than those of real patients due to more precise calibration, elimination of patient movement, more consistent earmold fittings, no ear geography issues, etc. Brand, however, does not break out the two different measurement types for analysis, so we don’t know what this difference was. Rather, she defends combining them and says: “This dual approach strengthens the study’s reliability and relevance.” We fail to see the relevance—clinicians prefer data from real patients.
What Is A “Good” Fit To Target?
We’ve just finished reviewing a couple of papers talking about “fit to targets” for the NAL-NL2 for an adult population with mild-to-moderate hearing loss. We’re going to change gears a little and move to children. When conducting probe-mic verification to NAL targets, students always question “how close is close enough?” As we’ve just discussed, the most common answer is +/- 5 dB. This is partially based on data from the development of the NAL-NL2 (variability of use-gain for experienced users), and has also been used in some published fitting guidelines for adults. Does this also apply to children?
Wiseman et al (2024) assessed the effect of RMS error category (<3, 3-5, >5 dB) on aided audibility, speech recognition, expressive vocabulary, and morphosyntax for 307 children fitted with hearing aids. The three RMS error categories studied were <3 dB, 3-5 dB, and >5 dB. The authors found that, as expected, children who met a <3 dB criterion had higher aided audibility than children with >5 dB error, although results showed no differences in speech recognition or vocabulary by error category. What was found, however, was that children with <3 dB error demonstrated better morphosyntax than children with 3-5 and >5 dB RMS error. The authors conclude that “using probe-microphone measures to adjust hearing aids to within 3 dB may benefit language abilities in children.”
Positive Thinking and Hearing Aids
The final articles that we’d like to discuss in this section relate more to counseling than to the actual fitting. It’s no secret that positive thinking has a variety of benefits. A few are listed below:
- Increased life span.
- Lower rates of depression.
- Lower levels of distress and pain.
- Greater resistance to illnesses.
- Better psychological and physical well-being.
- Reduced risk of death from cardiovascular disease and stroke.
It only seems reasonable that we apply this same kind of thinking to the use of hearing aids: our authors refer to it as “positive focus.” Lelic et al (2024) point out that it is known that a “negativity” cognitive bias can result in negative events being perceptually weighted more heavily than positive ones. From a practical standpoint, a plugged receiver, requiring an unscheduled visit back to the HCP, might override the positive listening experiences from the week before. It’s reasonable to believe that if we can maintain a positive focus with the hearing aid user, better outcomes will follow.
The first two articles we’ll review on this topic were both published in the IJA and authored by Dina Lelic and colleagues. The first explored how focusing on positive listening experiences improves hearing aid outcomes in experienced hearing aid users (Lelic et al, 2024), and the follow-up study, a randomized controlled trial, examined how focusing on positive listening experiences improves hearing aid outcomes in first-time hearing aid users (Lelic et al, 2025).
Procedures for the two studies were similar. Participants were randomized into a control or positive focus group and used hearing aids for several weeks. The positive focus group reported their positive experiences via an app. All participants completed benefit and satisfaction questionnaires at the end of the hearing aid use period. In both studies, results showed that outcomes were significantly better in the positive focus group. The hearing aid outcomes were positively correlated with the number of submitted positive reports.
A third study on this topic, also by Lelic and colleagues (2024), used a somewhat different approach, as they also examined whether a positive focus intervention can improve speech-in-noise abilities for experienced hearing aid users. Like the other studies, participants were randomly allocated to a control or a positive focus group. Prior to the new hearing aid fitting, all participants filled out the SSQ12 (see Taylor and Mueller, 2024, for a description of this test), based on performance with their current hearing aids. At the first visit, they were then fitted with study hearing aids, and speech-in-noise testing was performed. The positive focus group was instructed to focus on positive listening experiences and to report them. Following the 2-week trial, all participants filled out the SSQ12 questionnaire based on the study hearing aids. The speech-in-noise testing was repeated. Results showed that speech-in-noise performance and SSQ12 Qualities score were improved for the positive focus group, but not for the control group.
The authors point out the importance of asking hearing aid users to focus on positive listening experiences and talk about them, which just might lead to improved benefit and satisfaction, and hopefully increased hearing aid use. While the improvement in speech understanding for the positive focus group was not huge (e.g., ~1.3 dB SNR on the HINT), it clearly did not occur for the control group. As has been shown in many sporting activities, if you believe that you will do better, you probably will!
11.5: Outcome Measures
As we look at most protocols for selecting and fitting hearing aids, one important step in the overall process is outcome measures, usually delivered several weeks or a few months following the hearing aid fitting. Simply stated, the purpose of the outcome measure (and there are many of them) is to determine if the treatment provided (the use of hearing aids) achieved the intended goal. While the “intended” goal that first comes to mind for most patients is “improved speech communication,” there are many other domains to consider (see Mueller, 2025, for review).
As we discussed in Research QuickTakes Volume 9 (Taylor and Mueller, 2024), one scale, the Independent Outcome Inventory—Hearing Aids (IOI-HA) includes seven different domains (one question for each category): Daily use, Benefit, Residual activity limitation, Satisfaction with amplification, Residual participation restriction, Impact of using hearing aids on significant others, and Impact on quality of life. We easily could list ten or more other domains that have been studied using outcome measures.
That takes us to our first article in this section. It summarizes the results of an extensive in-depth review of the research surrounding the many outcome measures that are available, and narrows it down to three “winners.”
NASEM Review of Outcome Measures of Hearing Interventions.
For starters, NASEM is the acronym for the National Academies of Sciences, Engineering, and Medicine. It consists of private, nonprofit institutions that provide expert advice on some of the most pressing challenges facing the nation and world. Work that helps shape sound policies, inform public opinion, and advance the pursuit of science, engineering, and medicine.
As reported by Humes in his 2025 article (Humes, 2025), groups often contact NASEM when they desire a professional, independent examination of existing evidence about a specific policy question or issue. In this case, leaders at the Centers for Disease Control and Prevention, the Defense Health Agency, the Department of Veterans Affairs, the National Institute on Aging, and the National Institute on Deafness and Other Communication Disorders asked NASEM to examine the state of the science in outcomes research for interventions in adult hearing health care.
The group was charged with the identification of a core set of outcome domains (e.g., understanding speech in complex listening environments), and then recommending specific outcome measures that could be used for assessment. A group of 13 experts in this area worked on this challenge for over a year (see details in the official NASEM report). We’ll save you the suspense and go directly to the two domains and three associated outcome measures that were selected:
Understanding of speech in complex listening situations—The Words-In-Noise (WIN) test.
Understanding of speech in complex listening situations—The Abbreviated Profile of Hearing Aid Benefit (APHAB).
Measurement of hearing-related psychosocial health—the Revised Hearing Handicap Inventory (RHHI)
We’ve talked about this in previous Research QuickTakes, but for review, the RHHI is the merger and very similar to the well-established HHIE and HHIA (e.g., Taylor and Mueller, 2024; Taylor and Mueller, 2023). Most of you are also familiar with the APHAB, which we also have previously described and discussed (reminder: it’s conveniently part of the Noah Questionnaire Module). A test that is not as common among clinicians is the WIN (for review and applications, see Mueller et al, 2013).
Again, going back to our 2024 Research QuickTakes, we discussed the eight issues identified by Robyn Cox (2005) that relate to outcome measures. She listed four practical concerns: clinical burden, patient burden, scoring and utility; and four technical issues: norms, reliability, validity, and sensitivity. In that article, we concluded by listing the 3-4 outcome measures that we thought might be best to adopt for the typical clinician dispensing hearing aids. We’ll admit, we leaned pretty heavily on the issues of clinician and patient burden, and utility. We suspect, however, that the NASEM group gave considerable attention to the technical issues listed above.
For example, many of you reading this might be asking, why pick the WIN test, when the QuickSIN is much more popular, already is in use in many clinics, and is available on most audiometers, with automatic scoring? Good question, and Humes addresses this in his paper (2025). He states that the QuickSIN was seriously considered by the group, but the WIN was selected based on its psychometric characteristics. If you’re interested, Appendix D in the NASEM Report provides a detailed side-by-side comparison of the key psychometric characteristics and other features of the WIN and the QuickSIN.
So, will the publication of these NASEM findings move the needle and encourage more clinicians to use outcome measures? Will clinicians who already are doing outcome measures adopt the tests the committee recommended? Will aided speech testing, more or less abandoned since the 1970s, have a comeback? Time will tell, but we suspect that if change does occur, it will be gradual.
A Different Look at Hearing Aid Outcome Measures.
As reviewed above, the NASEM committee selected outcome measures that they believe are appropriate (best) for determining the effectiveness of treating patients with hearing amplification devices. Our guess is that even if you didn’t agree with their selections, you were at least vaguely familiar with the measures that they discussed—after all, these are the measures reviewed in most any textbook chapter on the topic. Our next article, however, looks at outcome measures differently, perhaps in a way that you have never considered.
In a recent article by Hodgetts and Singh (2025), the authors suggest that current popular outcomes miss the human foundations. They cite the work of Beechey and Naylor (2025), who suggest that our patients are active shapers of their environments, adjusting and reinterpreting their contexts to maintain meaning and function. Most commonly used clinical outcomes, however, assume people are passive responders to context. The patient’s adaptation to their environment (e.g., understanding in a noisy restaurant) could result in an undesirable score on a traditional outcome measure and be misinterpreted as an inappropriate hearing aid fitting. They suggest that measures need to be dynamic—ones that reflect a person's evolving relationship to their environment—how they might reshape their lives.
Hodgetts and Singh (2025) propose three seldom-measured outcomes, which they state are the basis for the success of the others. They gave the following descriptions of these three factors:
- Trust: The degree to which a person feels safe, respected, and understood within the hearing care process.
- Agency: The sense of control, choice, and ownership a person has over their decisions and actions.
- Identity Coherence: The alignment between the hearing care journey and the person's self-concept, values, and life roles.
They point out that these constructs are measurable and actionable, and provide examples of validated psychometrically sound instruments that can be used.
The authors propose an outcome measurement model that is dynamic, layered, and person-driven, with four key areas: Audiological Metrics (e.g., speech-in-noise, COSI goals, IOI-HA ratings); Human-Centered (trust, agency, identity coherence); Behavioral Integration (use, communication changes, relational impacts); and Contextual Modifiability (a person’s ability to reshape their environment).
Hodgetts and Singh (2025) conclude by stating that “Outcome measures would not just track change—they would trace how a person reconfigures their world to stay connected, whole, and self-consistent.” They close with a compelling comparison of “acceptance” to “coherence” – the difference between accommodating a hearing loss vs. integrating it and becoming a different kind of listener.
Acceptance is a suitcase. You pack your hearing loss into something manageable. You carry it with you. It’s present, but external—something to work around.
Coherence is a skin graft. It fuses. It heals. It becomes part of the structure of who you are. You don’t carry it anymore. You become someone new because of it—seamlessly, and sometimes invisibly.
A Link? Association? Or, Cause and Effect?
You can maybe tell from the heading above that our final topic of this section, and this issue of QuickTakes, relates to the use of hearing aids and cognition/dementia. For the past ten years or so, we’ve seen articles that quite consistently show that there is an association between hearing loss and dementia. Now, one might think that if a patient started using well-fit hearing aids soon after their hearing loss was discovered, this might actually prevent or reduce the severity of dementia later in life. HCPs have reacted in a wide range regarding this notion—some saying “I’ll believe it when I see the research evidence proving it,” and on the other end of the continuum, some using it as “scare tactics” to hopefully sell more hearing aids. One of the better reasoned approaches was written by Munro and Dawes (2024).
Most experts agree that the jury is still out regarding this topic, and therefore, new evidence is always welcome. That was recently provided by Crib et al (2026). At the beginning of the trial, participants were dementia-free, had moderate hearing impairments, and had no previous use of hearing aids. There were two treatment strategies: “use hearing aids” and “do not use hearing aids.” Outcomes included overall cognition, dementia (DSM-IV criteria), and cognitive impairment (cognitive decline or dementia). Over the span of seven years, the frequency of hearing aid use was measured by questionnaire, and cognition data also collected from semiannual assessments.
A total of 2,777 eligible individuals were included (mean age 75 years), with 664 receiving new hearing aid fittings. The authors report the following findings:
- The 7-year mean overall cognition scores among survivors were similar for those using hearing aids vs. those who were not.
- The estimated 7-year risk of dementia was 5.0% for those using hearing aids and 7.5% for those who were not.
- The estimated 7-year risk of cognitive impairment was 36.1% for those using hearing aids and 42.4% for those who were not.
As suggested by the data above, the authors conclude that the use of hearing aids for older people with hearing loss may reduce dementia.
In Closing
So, there you have it. A review of nearly 30 articles covering the areas of pre-fitting considerations, pre-fitting testing, signal processing, features, selection, fitting, and outcome measures. Our goal was to provide you with recent research information that might help you in your daily routine of selecting hearing aid candidates, fitting hearing aids, and patient counseling. Meaningful articles come out every week, so it’s time for us to start collecting our picks for the next installment of “Clinical Nuggets.”
References
Aazh, H., Moore, B., & Prasher, D. (2012). The accuracy of matching target insertion gains with open-fit hearing aids. American Journal of Audiology, 21(2), 175–180.
American Psychological Association. (2020). Publication manual of the American Psychological Association (7th ed.).
Amlani, A. (2025). Cost-utility and ethics of hearing aid delivery models: Aligning clinical practice standards with modern hearing health policy. Audiology Practices, 17(3), 33–42.
Almufarrij, I., Sindi, N., Pepler, A., & Munro, K. (2024). Is the role of probe-tube, real-ear measurements changing for adults with mild-to-moderate hearing loss? International Journal of Audiology, 63(8), 1–5.
Balling, L. W., Jensen, N. S., Caporali, S., Cubick, J., & Switalski, W. (2019). Challenges of instant-fit ear tips: What happens at the eardrum? Hearing Review, 26(12), 12–15.
Beechey, T., & Naylor, G. (2025). How purposeful adaptive responses to adverse conditions facilitate successful auditory functioning: A conceptual model. Trends in Hearing. https://doi.org/10.1177/23312165251317010
Bentler, R., Palmer, C., & Dittberner, A. (2004). Hearing-in-noise: Comparison of listeners with normal and (aided) impaired hearing. Journal of the American Academy of Audiology, 15(3), 216–225.
Brand, E. (2025). Comparing autoREM accuracy to NAL-NL2 targets. Audiology Practices, 17(1), 8–23.
Christensen, J. H., Whiston, H., Lough, M., Gil-Carvajal, J. C., Rumley, J., & Saunders, G. H. (2024). Evaluating real-world benefits of hearing aids with deep neural network-based noise reduction: An ecological momentary assessment study. American Journal of Audiology, 1–12.
Cox, R. M. (2005). Choosing a self-report measure for hearing aid fitting outcomes. Seminars in Hearing, 26(3), 149–156. https://doi.org/10.1055/s-2005-922236
Cox, R., & Xu, J. (2010). Short and long compression release times: Speech understanding, real-world preferences, and association with cognitive ability. Journal of the American Academy of Audiology, 21(2), 121–138. https://doi.org/10.3766/jaaa.21.2.6
Cribb, L., Moreno-Betancur, M., Pase, M., Wolfe, R., Britt, C., Zhou, Z., Shah, R., & Ryan, J. (2026). Treating hearing loss with hearing aids for the prevention of cognitive decline and dementia. Neurology, 106(3), Article e214572.
Davidson, A. (2025). 20Q: Emerging research - normal audiograms, real-world struggles, and innovative interventions. AudiologyOnline, Article 29319. www.audiologyonline.com
DeSisto, N. G., Sharma, R. K., Longino, E. S., Ortiz, A. S., Kim, L. R., Rohde, S. L., & Yang, S. F. (2024). You can't be what you can't see: The progression of women in otolaryngology-head and neck surgery. Ear, Nose, & Throat Journal. Advance online publication. https://doi.org/10.1177/01455613241282610
Dhar, S. (1999). Comparison of performance across three directional hearing aids. Journal of the American Academy of Audiology, 10(4), 180–189.
Dillon, H. (1996). Compression? Yes, but for low or high frequencies, for low or high intensities, and with what response times? Ear and Hearing, 17(4), 287–307.
Dillon, H., James, A., & Ginis, J. (1997). Client Oriented Scale of Improvement (COSI) and its relationship to several other measures of benefit and satisfaction provided by hearing aids. Journal of the American Academy of Audiology, 8(1), 27–43.
Ekberg, K., & Hickson, L. (2023). To tell or not to tell? Exploring the social process of stigma for adults with hearing loss and their families: Introduction to the special issue. International Journal of Audiology, 64(sup1), S1–S11. https://doi.org/10.1080/14992027.2023.2293651
Ellis, G., Bieber, R., Davidson, A., Sherlock, L., Spencer, M., & Brungart, D. (2025). Improving the predictive strength of better-ear four-frequency pure-tone average with the addition of the tinnitus and hearing survey-hearing subscale. Ear and Hearing, 46(4), 909–921.
Fitzgerald, M., Ward, K., Gianakas, S., Smith, M., Blevins, N., & Swanson, A. (2024). Speech-in-noise assessment in the routine audiologic test battery: Relationship to perceived auditory disability. Ear and Hearing, 45(4), 816–826.
Fitzgerald, M., et al. (2025). Effectiveness of deep neural networks in hearing aids for improving signal-to-noise ratio, speech recognition, and listener preference in background noise. Frontiers in Audiology and Otology, 3. https://doi.org/10.3389/fauot.2025.1677482
Folkeard, P., Pumford, J., Abbasalipour, P., Willis, N., & Scollie, S. (2018). A comparison of automated real-ear and traditional hearing aid fitting methods. Hearing Review, 25(11), 28–32.
Folkeard, P., Jensen, N. S., Parsi, H., Bilert, S., & Scollie, S. (2024). Hearing at the mall: Multibeam processing technology improves hearing group conversations in a real-world food court environment. American Journal of Audiology, 33(3), 782–792.
Glista, D., O'Hagan, R., Beh, K., Crukley, J., Scollie, S., & Cornelisse, L. (2024). Real-world assessment of listener preference for hearing aid technology levels in socially involved situations. Frontiers in Audiology and Otology.
Hodgetts, R., & Singh, G. (2025). What is a hearing care outcome? Rethinking measurement through trust, agency, and identity. Canadian Audiologist, 12(5).
Humes, L. (2025). Meaningful outcome measures for hearing interventions in adults. AudiologyOnline, Article 29355. www.audiologyonline.com
Killion, M. C., Niquette, P. A., Gudmundsen, G., Revit, L. J., & Banerjee, S. (2004). Development of a quick speech-in-noise test for measuring signal-to-noise ratio loss in normal-hearing and hearing-impaired listeners. Journal of the Acoustical Society of America, 116(4), 2395–2405.
Latzel, M., Denys, S., Anderson, S., Francart, T., Wouters, J., & Appleton-Huber, J. (2017). An integrated REM system with proven accuracy and reliability. Hearing Review, 24(10), 36–39.
Lelic, D., Wolters, F., Herrlin, P., & Smeds, K. (2022). Assessment of hearing-related lifestyle based on the common sound scenarios framework. American Journal of Audiology, 31(4), 1299–1311.
Lelic, D., Parker, D., Herrlin, P., Wolters, F., & Smeds, K. (2023). Focusing on positive listening experiences improves hearing aid outcomes in experienced hearing aid users. International Journal of Audiology, 1–11. https://doi.org/10.1080/14992027.2023.2190006
Martin, L. (2024). Audible Contrast Threshold – a new test to guide setting help-in-noise features in hearing aids. ENT & Audiology News.
Mueller, H. G. (2001). Probe-microphone measurements: 20 years of progress. Trends in Amplification, 5(2), 3–39.
Mueller, H. G. (2005). Probe-mic measures: Hearing aid fitting’s most neglected element. Hearing Journal, 57(10), 33–41.
Mueller, H. G. (2014, January). 20Q: Real-ear probe-microphone measures - 30 years of progress? AudiologyOnline, Article 12410. https://www.audiologyonline.com
Mueller, H. G. (2020). Perspective: Real ear verification of hearing aid gain and output. GMS Zeitschrift für Audiologie (Audiological Acoustics), 2, Article Doc05. https://doi.org/10.3205/zaud000009
Mueller, H. G. (2025). 20Q: Hearing aid selection and fitting - The role of self-report inventories. AudiologyOnline, Article 29198. www.audiologyonline.com
Mueller, H. G., Bentler, R., & Ricketts, T. (2013). Modern hearing aids: Pre-fitting testing and selection considerations. Plural Publishing.
Mueller, H. G., Coverstone, J., Galster, J., Jorgensen, L., & Picou, E. (2021). 20Q: The new hearing aid fitting standard - A roundtable discussion. AudiologyOnline, Article 27938. www.audiologyonline.com
Mueller, H. G., & Picou, E. M. (2010). Survey examines the popularity of real-ear probe-microphone measures. Hearing Journal, 63(5), 27–32.
Mueller, H. G., & Ricketts, T. A. (2018). 20Q: Hearing aid verification - will autoREMfit move the sticks? AudiologyOnline, Article 23532. www.audiologyonline.com
Mueller, H. G., Ricketts, T., & Bentler, R. (2017). Speech mapping and probe-microphone measures. Plural Publishing.
Mueller, H. G., Ricketts, T., & Hornsby, B. W. Y. (2023). 20Q: Speech-in-noise testing - too useful to be ignored! AudiologyOnline, Article 28760. www.audiologyonline.com
Mueller, H. G., & Taylor, B. (2025). Research Quick Takes, volume 10: An update on OTC hearing aids. AudiologyOnline, Article 29477. www.audiologyonline.com
Munro, K. J., & Dawes, P. (2024). 20Q: Hearing loss, hearing aids and dementia - don’t let the science be hijacked by hype. AudiologyOnline, Article 28918. www.audiologyonline.com
Palmer, C. (2009). Best practice: It’s a matter of ethics. Audiology Today, 21(5), 31–35.
Picou, E. M., Wiacek, R., Ricketts, T. A., & Roberts, R. A. (2024). Hearing aid adoption rates among adults without hearing aid experience in an audiology clinic before and after price unbundling. International Journal of Audiology, 1–10. Advance online publication. https://doi.org/10.1080/14992027.2024.2443532
Pumford, J., & Mueller, H. G. (2020). Using autoREMfit for hearing aid fitting and verification: Evidence of accuracy and reliability. Hearing Review, 27(8), 24–27.
Ricketts, T., & Dhar, S. (1999). Comparison of performance across three directional hearing aids. Journal of the American Academy of Audiology, 10(4), 180–189.
Ricketts, T. A., & Hornsby, B. W. (2005). Sound quality measures for speech in noise through a commercial hearing aid implementing digital noise reduction. Journal of the American Academy of Audiology, 16(5), 270–277.
Sanders, J., Stoody, T., Weber, J., & Mueller, H. G. (2015). Manufacturers’ NAL-NL2 fittings fail real-ear verification. Hearing Review, 21(3), 24.
Saoji, A. A., Sheikh, B. A., Bertsch, N. J., Goulson, K. R., Graham, M. K., McDonald, E. A., Bross, A. E., Vaisberg, J. M., Kühnel, V., Voss, S. C., Qian, J., Hogan, C. H., & DeJong, M. D. (2024). How does deep neural network-based noise reduction in hearing aids impact cochlear implant candidacy? Audiology Research, 14(6), 1114–1125.
Singh, G., Goy, H., Wright-Whyte, K., Chasteen, A., & Pichora-Fuller, M. (2025). Social predictors of hearing aid purchase: Do stigma, social network composition, social support, and loneliness matter? Ear and Hearing, 46(5), 1149–1163.
Snyder, N., Bixler, A., Belcastro, K., Hunter, J. B., & Middleton, I. L. (2025). Hearing aid adoption rates: Perceptions, attitudes, and influencing factors of prospective hearing aid users. Journal of the American Academy of Audiology, 36(3), 188–195. https://doi.org/10.3766/jaaa.240024
Taylor, B., & Mueller, H. G. (2023). Research QuickTakes Volume 6 (Pt. 1): Hearing aid fitting toolbox — Important pre-fitting measures. AudiologyOnline, Article 28707. https://www.audiologyonline.com
Taylor, B., & Mueller, H. G. (2024). Research QuickTakes Volume 7: Useful clinical nuggets mined from recent hearing aid research. AudiologyOnline, Article 28939. https://www.audiologyonline.com
Taylor, B., & Mueller, H. G. (2025). Research QuickTakes Volume 9: Clinical implementation of self-assessment inventories. AudiologyOnline, Article 29289. https://www.audiologyonline.com
Windle, R., Dillon, H., & Heinrich, A. (2023). A review of auditory processing and cognitive change during normal ageing, and the implications for setting hearing aids for older adults. Frontiers in Neurology, 14. https://doi.org/10.3389/fneur.2023.1122420
Windle, R., Dillon, H., & Heinrich, A. (2026). Preference and outcomes for fast versus slow compression in hearing aids for older adults: A randomized control trial. Ear and Hearing, 47(1), 107–119.
Wiseman, K., Walker, E., Spratford, M., Brennan, M., & McCreery, R. (2024). Comparing criteria for deviation from hearing aid prescriptive targets in children. International Journal of Audiology, 63(12), 997–1008.
Zaar, J., Simonsen, L. B., Sanchez-Lopez, R., & Laugesen, S. (2024). The Audible Contrast Threshold (ACT) test: A clinical spectro-temporal modulation detection test. Hearing Research, 453, Article 109103. https://doi.org/10.1016/j.heares.2024.109103
Citation: Mueller, H. G., & Taylor, B. (2026). Research QuickTakes Volume 11: More clinical nuggets from recent research. AudiologyOnline.