
Editor’s Note: This text course is an edited transcript of a live seminar. Download supplemental course materials here.This is a presentation of things that I have thought about over the years as I have taught an Au.D. course in amplification. Some of the subtleties are real-ear measures that are not taught or are not mentioned in all cases. So this presentation is, essentially, a summary of those thoughts that I have gathered over time.
By way of an outline, I am first going to provide an introduction to the use of real-ear measures by audiologists and give you an example of a first-fit versus programmed fit. Some of the factors we are going to discuss are insertion gain using average versus measured real-ear unaided gain (REUG), correcting for a bilateral fit, correcting for the number of channels of signal processing, and average versus measured real-ear to dial difference (REDD) and its impact upon real-ear aided response (REAR) measures.
David Kirkwood (2010) surveyed audiologists and hearing instrument specialists and asked, among other questions, "How often do you perform real-ear measures?" It is disheartening to say that, of the audiologists, only about 20 percent responded that they always used real-ear measures; hearing instrument specialists were about the same, at 21 percent. Gus Mueller and Erin Picou (2010) published a similar survey and asked the same question. Their results were not much higher, about 30 percent.
As the field is progressing to the Au.D., it is disheartening as an audiologist to see that roughly 70 to 80 percent of audiologists do not routinely use real-ear measures to assess the performance of amplification. To give you a sense of what I am talking about, Figure 1 shows the electroacoustic tracing of a typical first fit. The line that rises gradually and says “target” above it is the prescribed gain for this particular patient. When we actually took the manufacturer’s first fit, the other line that rolls off significantly under target in the high frequencies is what we received. So you ask the patient, "How does that sound?" He says, "Oh, that sounds pretty good." Well, he is getting some amplification at 2,000 Hz, but that is about all.
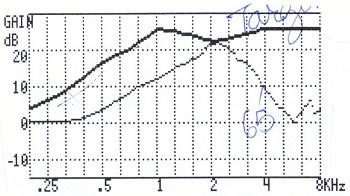
Figure 1. Example of first-fit settings compared to the prescriptive target when measured electroacoustically.
I am concerned that there are many hearing aids going out into the world that are fit similarly to this. Obviously, this is not the optimum fit. We reprogrammed that hearing aid and ran it again (Figure 2). You can see that if you do these kind of things and you get this fit, most people will recognize that that is a better way for that hearing aid to go out the door than what you saw in Figure 1.
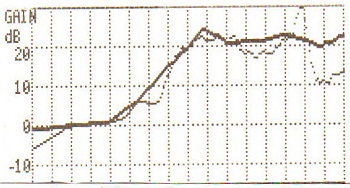
Figure 2. Hearing aid reprogrammed to match prescriptive targets.
An article that is to be released in the American Journal of Audiology (Aazh, Moore & Prasher, 2012) studied target insertion gain in open-fit hearing aids. There were 51 total fittings, and according to the authors, 71 percent of the initial fits failed to be within 10 dB of the NAL-NL1 target at one or more frequencies between 250 and 4,000 Hz. Ten dB is a rather lax criterion. After modification, only 18 percent failed to be within that 10 dB criterion. This is only one study; there are a whole host of studies with similar kinds of findings.
However, the results of these and other studies (Swan & Gatehouse, 1995; Harrowven, 1998; Norman & James, 2000; Hawkins & Cook, 2003; Aarts & Caffee, 2005; Aazh & Moore, 2007), as well as two national guidelines – one from the American Speech-Language-Hearing Association (ASHA; 1998) and one from the American Academy of Audiology (AAA; 2007) – have failed to convince most audiologists to verify hearing aid performance. For the 20 or 30 percent of you who routinely do real-ear measures, you might be aware, but that is what the rest of the presentation is all about.
A questionnaire recently conducted by Mueller and Picou (2010) indicated that when professionals do real-ear measures, 78 percent do REAR, 22 percent use real-ear insertion gain (REIG), and some use both. Here in my clinic, we do both. Of the 91 percent of audiologists who use REIG, they measure the REUG as opposed to using the average REUG.
The next topic is something that we are investigating here at Washington University. Look at Figure 3. This is REIG using the Frye 8000. I entered a hearing loss and got a prescribed gain. What many people do not realize is that there are certain things that go into what created that particular target, including the spectrum of the signal, the input level of the signal and a whole host of other variables. One of the aspects that goes into creating that target is the assumption that the person you are fitting has an average REUG. On the Frye system, you can tell the software to use the individual REUG or use the average REUG.
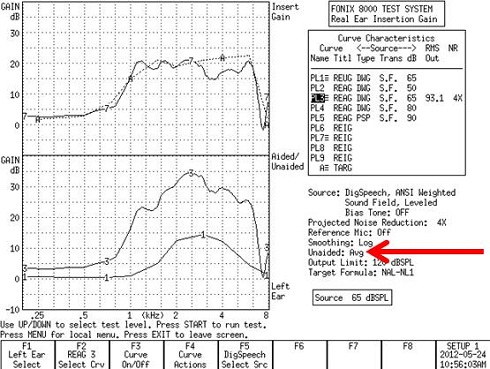
Figure 3. Fonix 8000 REIG curves using the average unaided gain responses.
In this case, this is the average REUG. Curve 3 is your REAG, which is the amount of gain being provided by the hearing aid. The difference between these two values is your measured REIG (Curve 7), and you are looking for how close this comes to the target (A).
Figure 4 is an example of the same fit, but using the measured REUG on my ear. Again, the target is the same. Curve 3 is the measured REAG.
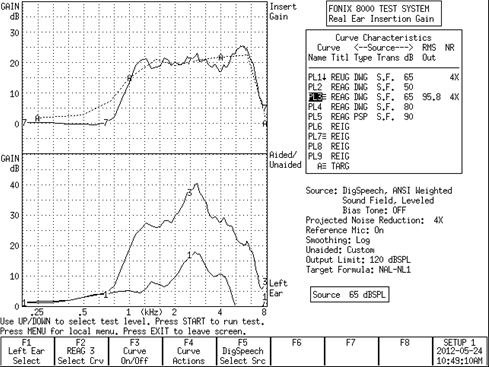
Figure 4. Fonix 8000 REAG curves using the custom responses.
So what is the difference? I published a study back in1991 (Valente, Valente, & Goebel, 1991) using a sample of 49 ears. Figure 5 shows the intersubject variability and range of REUG values. You can see that there is a significant intersubject variability on the REUG. So when you compare the REUG in each case (Figure 3, Figure 4) you can see the large differences in the average versus measured responses.
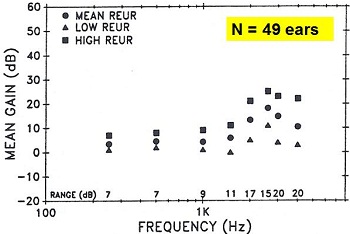
Figure 5. Intersubject variability of REUR values from 49 ears (Valente, et al., 1991).
At that time, we were of the mindset that you should be using the average REUG, but we are now using the individual REUG. According to the prescriptive target, you could be under amplifying in some regions by almost 10 dB (Figure 6). The black line with yellow triangles represents the difference between the measured REUG and the average REUG in terms of matching target. You can see that there is minimal difference between average and measured values in the lower frequencies. But for my ear, if we were to fit the hearing aid utilizing the average, we would have under amplified by almost 10 dB around 6,000 Hz. It is something for you to think about.
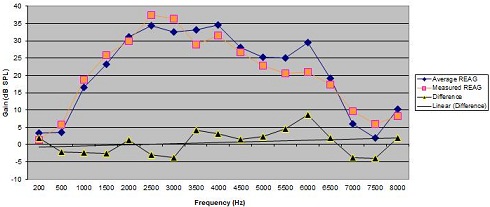
Figure 6. Example of differences (black triangles) in dB SPL between average REAG measures (blue diamonds) and measured REAG (orange square) for one individual.
We are currently engaged in a research project to look at this with a large number of subjects. There is a difference across those large numbers of subjects, and we are asking if it has any effects on the outcomes, i.e., speech intelligibility, user satisfaction or user benefit. We are just now beginning to look at that project.
I wanted to share with you one subtle aspect to doing real-ear measures. Should you be using the individual REUG or the average REUG? According to the data by Mueller and Picou (2010), 91 percent of audiologists are utilizing the users' REUG. If the measured REUG at any frequency is greater than the average, then more REAG is required to reach the target. If measured REUG at any frequency is less than the average, then less REAG is required to reach the target. Again, we do not know the total impact of all this. We are just now beginning to look at it.
However, just having talked about gain, I think most people in the audience would agree that the professions seems to be shifting more to REAR measures (i.e., output measure) as opposed to gain measures, so we are going to focus on REAR for the rest of the presentation.
Shifting to the REAR
As I mentioned earlier, audiology appears to be shifting from REAG to REAR because of the popularity of the Verifit system and live speech mapping. REAR measures intuitively make greater sense to me because you are identifying how much of the amplified signal is within that user's dynamic range.
REAR measures can be in SPL-O-Gram or live speech mapping formats. It is my personal opinion that the SPL-O-Gram is more of a verification tool. You have the threshold in dB SPL, you have the loudness discomfort level (LDL) in dB SPL, and you are simply looking at how a speech signal fits within that particular dynamic range. Live speech mapping, on the other hand, is not a verification tool. The live voice is typically the patient, spouse or audiologist talking into the sound field. That is more of a counseling tool, because you are not utilizing a standardized input level, and you have no validated target. The target is the amplified signal above the person's threshold, but you have no target as to the appropriate sensation level. So in our world, live speech mapping is more of a counseling tool whereas the SPL-O-Gram is more of a verification tool because you have targets.
In both the Fonix and Verifit systems, you can have targets utilizing DSL or NAL-NL1 or NAL-NL2, so you will know whether or not that REAR adheres or matches a validated target. Both methods, the SPL-O-Gram and live speech mapping, use dynamic range and dB SPL as the target. The dynamic range in both methods, however, is typically predicted based upon average transformations when the audiogram is entered. Where the one uses gain or REAR, there are many errors that you many not be aware of, and that is what the rest of the presentation is all about.
Correcting for Bilateral Summation and Channel Summation
One of the two variables that we sometimes do not think about is correcting for bilateral and channel summation. Let me give you an analogy to explain channel summation. Imagine we are in a sound booth with a loudspeaker emitting 65 dB SPL. I am sitting in the center of the soundfield with a sound level meter by my head. There is a knob next to me so that I can adjust the input of this signal to my most comfortable loudness level (MCL). So I turn the dial, and let's say that the sound level meter reads 65 dB SPL. Now, I put in 11 loudspeakers, all emitting 65 dB SPL at the same time. By the same example, I am going to change the input to my ear so that it is at my MCL. I think most people would agree that because you are adding all of these additional channels, they will summate, and I probably will turn this dial down to reach the same MCL. That, in essence, is channel summation.
The more channels of signal processing, the more the input is being added at the output stage. There are formulas to correct for that. I am going to walk you through a case (Figure 7). In this particular case, we are fitting a hearing aid that has 20 channels of signal processing. The audiogram for the left is shown by the X’s and the audiogram for the right is shown by the O’s. These are predicted LDLs in dB HL (i.e., “U”), based upon the entered audiogram. Most people here might think that these LDLs are a little high. I will explain this in a moment. Remember, you entered the audiogram based upon your hearing test. The software assumes that it is going to predict the LDL because you did not measure the LDL. On most systems, you are going to get the data from Pascoe (1988).
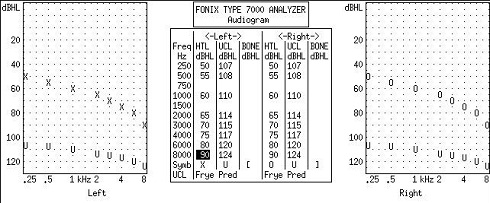
Figure7. Example audiogram of a moderate sloping to severe hearing loss bilaterally with predicated LDLs (U) based on the entered audiogram.
What you may not be aware of is that most real-ear systems assume the default is a monaural fitting and that you are fitting a hearing aid with a single channel, even after you enter the audiogram. But this is a bilateral fit on a person who is using a hearing aid with 20 channels of signal processing. What does that do to the initial target?
Figure 8 is the original REIG for that audiogram for the Frye system and the corrected REIG for a bilateral fit. The monaural target is about 5 dB higher than the bilateral target in Figure 8. We correct all our fittings to be bilateral or monaural in the real-ear system so that we have appropriate targets. We also correct for the number of channels. We go into the menu and “tell” the system the number of channels of signal processing. On the Frye system, the highest you can go is 18 channels.
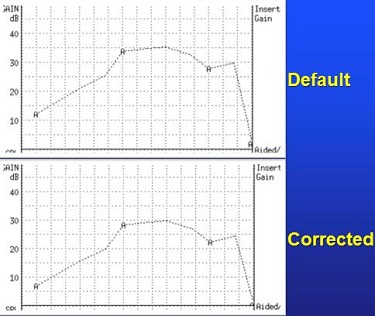
Figure 8. Entered audiogram (top) and corrected audiogram (bottom) for a binaural fitting, or binaural summation. Note that corrected audiogram applies less gain.
Figure 9 is now the correction for both bilateral and channel summation. The difference between target and corrected target is now quite substantial, especially at 2,000 Hz for this particular hearing aid.
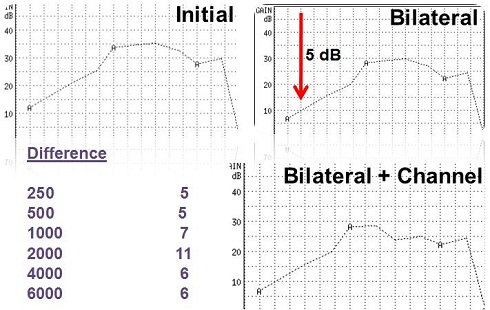
Figure 9. Corrections for bilateral and channel summation. Differences in dB by frequency are noted in the table.
To reiterate, if we were to fit the hearing aid and matched it to the initial target (Figure 8 upper) instead of the bilateral and channel-corrected target, this patient, in all probability, would have said, "These hearing aids are too loud." So in our clinic, when we go in and we set up our real-ear system, we correct the real-ear target for both. The lower the number of channels, the less the correction you will see in channel summation. This is something that people may not often think about, hence the title, Things your Professor May Not Have Taught You.
Real-Ear-to-Dial-Difference
Now, the third error when doing REAR measures is the REDD, and this gets a little dicey. I am going to walk through this as slowly as I possibly can. Again, you may not be aware of this, but when you complete REAR measures and enter the audiogram in dB HL, the real-ear system will convert your threshold in dB HL to dB SPL by adding the average REDD value from ANSI 1989, which varies from 9 to 19 dB depending on the frequency. These values are built into the software.
Figure 10 is a person's audiometric threshold (T) using SPL-O-Gram. The person’s LDL in dB SPL is the curve that you can barely identify at the top of the graph. Again, that is based on average transformations. The targets based on soft, average and loud speech inputs are labeled on the graph as 2, 3 and 4, respectively. These are REAR targets based upon NAL-NL1.
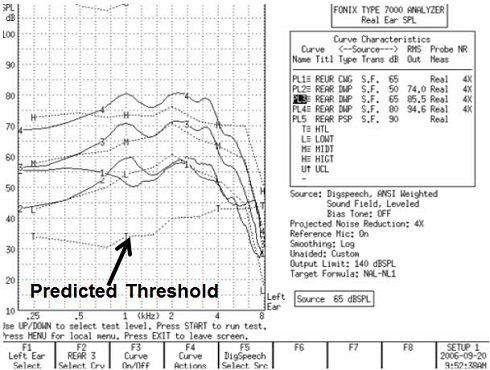
Figure 10. Typical real-ear screen output of a Fonix 7000 system, with predicted threshold in dB SPL (T), and target gains for soft (2), average (3), and loud (4) speech inputs.
A study performed back in 2006 (Keller, 2006) as part of a Capstone Project I supervised measured the REDD in over 300 ears. The red line (Figure 11) represents the average REDD amongst all of these individual variations. Incredibly, this average is almost identical to the 1989 ANSI standard. But look at the large amount of intersubject variability on the REDD for these particular 300 ears. The verification system is also going predict the LDL in dB HL from Pascoe (1988), and then add the average REDD to convert the LDL from dB HL to LDL in dB SPL.
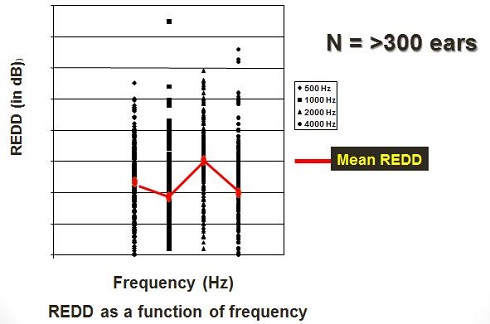
Figure 11. Average REDD (red line) amongst individual REDD measurements for frequencies of 500 to 4,000 Hz (Keller, 2006).
Walking you through the math for LDL, you have entered your audiogram. As an example, the real-ear software is going to take your audiogram in dB HL and add 9 dB at 1,000 Hz to convert it to dB SPL. It is going to add that 9 dB to that person's LDL, which is predicted to be 114 dB HL. So for this person's hearing loss of 65 dB HL, it is going to take the LDL of 114 from Pascoe’s (1988) data, and then it is going to add the 9 dB for conversion to dB SPL. So this person's predicted LDL in dB SPL at 1,000 Hz is going to be 123 dB SPL (Figure 12).
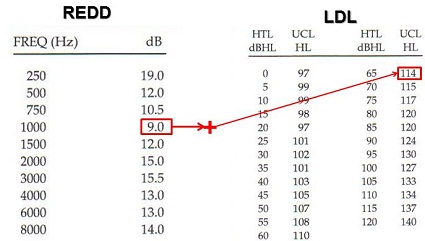
Figure 12. REDD values in dB SPL, based on Pascoe (1988) and predicted LDL values in dB HL for 1,000 Hz by hearing threshold. The REDD value is added to the predicted LDL in dB HL to arrive at the LDL in dB SPL.
That is going to be that upper line that you see on the SPL-O-Gram of your real-ear target. Both the Frye and Verifit (Verifit uses 1 SD below the mean of Pascoe’s data for predicted LDL) systems do this based on NAL-NL1. Again, this is something you need to be aware of that when you enter the audiogram. If you do not enter the individual’s LDL values, the system will output the average values based on Pascoe’s (1988) conversion data from dB HL to dB SPL.
To that end, Bentler and Cooley (2001) investigated the intersubject variability on measured LDL in dB SPL. They noted a significant amount of individual subject variability on measured LDLs across thresholds. I get nervous thinking about utilizing average transformations when you have data that simply shows how much variability exists from person to person.
Data from Keller (2006) here at Washington University is shown in Figure 13. There is 500, 1,000, 2,000 and 4,000 Hz. The middle line of each graph represents the mean LDL; the lines above and below are plus or minus 5 dB around the mean. However, you can see a lot of data even above and below the plus or minus 5 dB lines at all frequencies. Here in our clinic, we do not use average LDLs. We do measured LDLs, and we do measured REDD because we have noted the significant variability.
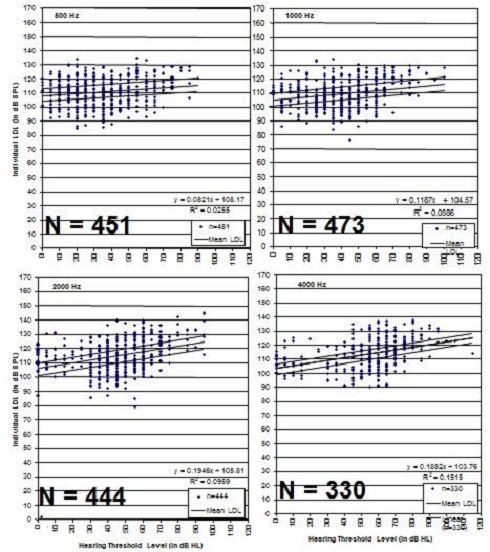
Figure 13. Individual LDL data from Keller (2006) for 500, 1,000, 2,000 and 4,000 Hz. Mean line is the solid black line in the middle of the data points, with plus and minus 5 dB variants shown as the black lines above and below the mean lines.
How does one measure the individual REDD? Interestingly, it is a simple one-step process. You can use the TDH headphones or insert earphones with a probe tube in the ear. You can set the dial at 70 dB or 80 dB HL. I use 70 dB. All you have to do is put the probe tube in the ear and measure the SPL in the ear canal with an input of 70 dB HL at 250, 1,000, 2,000 Hz, whatever you want to do. You are simply keeping the dial at 70 dB, but changing frequency and measuring the SPL in the ear canal. The difference between the audiometric value and the value in the ear canal is your REDD. And REDD is REDD. It is going to be the same if the dial is set at 60, 20, 0, or 10 dB. We do it at 70 dB so it is above the noise floor.
To read the SPL in the Frye 7000 system, we go to the Setup menu, Microphone Calibration. From there you can read out the value. For example, the input signal was 70 dB at 1,000 Hz. The measured SPL in the ear canal is 82. The person's REDD at that frequency then is 12 dB. If you have the Verifit system, you just go into the speech map and measure it right there.
Figure 14 is a table that we use at the clinic when measuring each patient’s REDD. This has values for a right ear from 500 to 4,000 Hz. We put the dial at 70 dB HL. On our real-ear system, we read out these values. For this particular person's ear, the REDD is 8, derived from 78 minus 70. You then do the math for all the other frequencies. This becomes the individual REDD that we enter into the real-ear system.
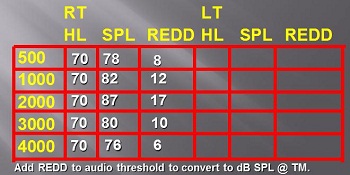
Figure 14. Basic conversion chart used to enter individual REDD data for patients tested clinically.
Using the Patient’s Dynamic Range as Target
We use the dynamic range, or the range between audiometric threshold and the LDL. Figure 15 shows threshold, LDL and the NAL-NL1 targets for soft, average and loud inputs.
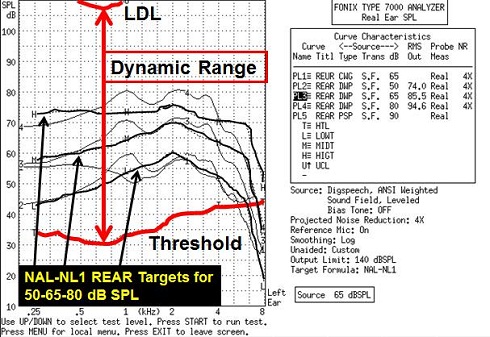
Figure 15. Dynamic range between threshold and LDL. REAR targets are noted by black arrows for soft, average and loud speech inputs.
When we go into the real-ear module of the Fonix system, we enter the audiogram, and instead of using the average LDL, we entered the individual LDL. I am going to walk you through an example. Let’s say we are testing a person with hearing loss from 10 dB sloping to 80 dB at 8,000 Hz. I would enter my measured REDD values, not predicted values (Figure 16). You can see from the table (Figure 16) that my measurement was 6 dB below at 250 Hz. This is derived from the ANSI 1989 value of 19 dB minus my measured REDD of 13 dB, equaling 6. You can see the other values, calculated the same way, for the other frequencies. I was pretty close to average across the frequencies, except for a negative 11 dB shift at 4,000 Hz, which was significantly below the average.
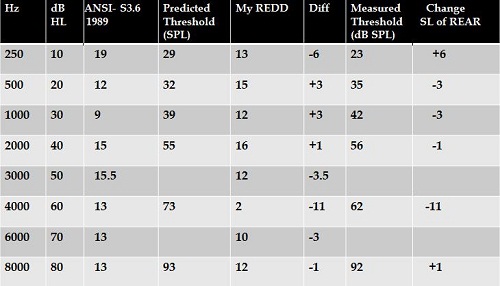
Figure 16. Measured REDD values relative to the ANSI 1989 conversion values. The difference between the predicted threshold in dB SPL and measured threshold in dB SPL is the change of REAR in sensation level.
What does that do? It changes the sensation level of the amplification by that amount, relative to the predicted target. The target, however, is not corrected for the change in the person's threshold. That NAL-NL1 target, which is based upon the measured REDD values, is now adjusted across all frequencies by the difference values I obtained in Figure 16. We just have to go into the system and change the REDD setting from average to custom in order to enter the values manually (Figure 17).
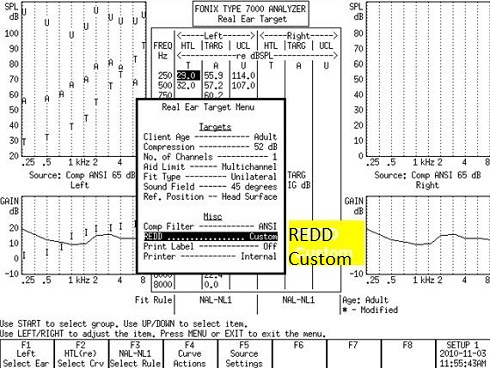
Figure 17. Real Ear Target menu of the Fonix 7000 system, highlighting the change from average REDD to custom REDD. This menu can be accessed via F2.
Figure 18 is an example of the target screen based on a predicted threshold on an entered audiogram and the average REDD. Figure 19 is now the corrected target screen, based upon the individual REDD. If you look back and forth between Figures 18 and 19, you will notice that the targets do not change, but the threshold has changed.
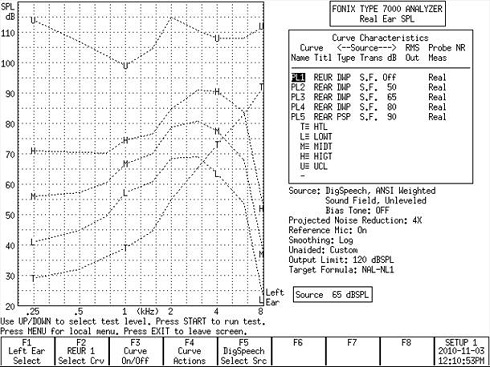
Figure 18. Predicted threshold (T) based on the average REDD.
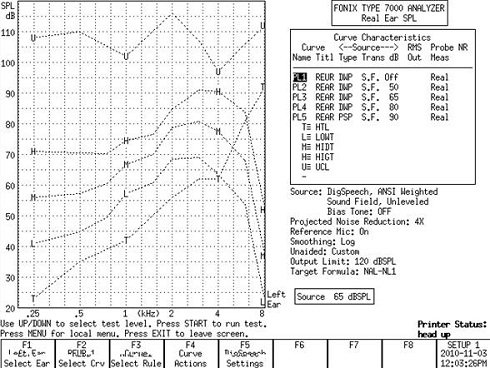
Figure 19. Corrected threshold (T) based on custom REDD values. The REAR has not changed, only the sensation level between predicted and measured thresholds.
Notice also how the LDL changed (Figure 19). Because the individual LDL is not the same as the predicted LDL, it is changing both the threshold and the LDL. How does this amplified signal fit inside of the corrected target (Figure 19), as opposed to the uncorrected target (Figure 18)? You can see that the dynamic range is considerably wider for the corrected threshold (Figure 19) at some frequencies.
Air-Bone Gap
The last issue that we will discuss very briefly is that of the air-bone gap. Do not forget that if you have an air-bone gap at a particular frequency, you need to add 20 to 25 percent of the air-bone gap to the predictive target to correct for the conductive or mixed component. That is another correction that I thought was in this presentation, but due to time, we will not be able to discuss in depth today.
That brings us to the end. In summary, the issues that we correct for on a regular basis are average versus measured REUG, bilateral and channel summation and average versus measured REDD. Now, I am ready for questions.
Question & Answer
Typically, we do our audiograms with insert earphones. In real-ear, do you recommend we measure RECDs with insert earphones or with the patient's own earmold?
Excellent question. Here, we do not often do RECDs because our population is an adult population, as opposed to pediatrics. But if I were to do RECDs, I would use the person's own earmold, as opposed to the insert earphone. One of the other ways in which you can do REDDs is to use the person's earmold to get a more accurate measure over using a TDH headphone or an insert earphone.
What is your method of determining the LDL?
We have, in front of the patient, a laminated piece of paper utilizing a loudness scale that was in the IHAFF Protocol (Valente & Van Vliet, 1997). It is a scale from soft all the way up to loud, but okay. And then it goes up to uncomfortably loud. In our clinic, our LDL is based upon loud, but okay. We typically send the signal through TDH earphones, but some audiologists here also use insert earphones. We have a probe tube in the ear. We measure LDLs at 500, 1,000, 2,000, 3,000 and 4,000 Hz. For each one of those frequencies, we ask the individual, "Tell us when the sound that you hear is loud, but okay." We start ascending in 10 dB steps until the person says, "That is loud but okay."
Then we go to the next highest intensity by 5 dB and we start to come down. We go in 5 dB steps, and our definition of LDL is when the patient repeatedly says half of the time, "That is loud, but okay." We mark on that piece of paper what the value is at that frequency in dB HL, and also in dB SPL, with the probe tube in the ear canal. Of course, the difference between those two is your REDD.
Can you explain what to do if the conundrum arises that a patient prefers the manufacturer algorithm over the NAL real-ear target?
In my mind, if the manufacturer is not willing to share the algorithm with you, then using the manufacturer algorithm is very questionable. Having said that, in our clinic we fit virtually every manufacturer there is, and we do real-ear measures on all of them. From time to time, we will download the first fit. There is one manufacturer that if you do the pretest, and I am not going to mention any names, it is almost right on target to NAL-NL1 roughly 80 percent of the time. But for every other manufacturer that we use, the first fit is off, sometimes by quite a bit. The high-frequency region tends to be most different from actual target.
Long ago, we programmed one memory using the manufacturer's first fit, and another memory with the verified prescriptive target and we do an A-B comparison between the two. I would be hard pressed to think of many patients who actually said they preferred the program that was a manufacturer first fit.
I am exceedingly wary of utilizing a manufacturer's first fit. Even with the manufacturer that almost always hits target on the first fit, we still go ahead and do real-ear measures. There is not a single hearing aid that goes out of this clinic without doing real-ear measures. I have to be honest and tell you that I would be extremely concerned about believing that a manufacturer's algorithm is patient preferred. We just do not see it, and we dispense 72 hearing aids on average per month to an adult population.
Obviously, the methods you are recommending require a greater amount of time up front. Do you feel that this method results in less time needed down the line for fine tuning?
Excellent question. I have no actual data to support the statement that I am about to make, but the answer to that is yes. We believe that doing it up front does result in better user satisfaction and less downtime down the road for fine tuning. Having said that, it seems to be the right thing to do. We are asking patients to spend anywhere between $2,000 and over $7,000 for a pair of hearing aids. We have an advanced degree. We should be doing it better than people who do not have advanced degrees. We should know better and do better. So, in our clinic, we do this because we think it is the right thing to do, and we also think that it does result in a better fit in the long haul. We have good user satisfaction and a good patient benefit based on the various questionnaires that we use, so what we are doing seems to be working.
When measuring UCL's, do you recommend pure tones or another stimulus?
We use a continuous pure tone because it is very difficult to read out the SPL utilizing a pulsed tone. We also do not use narrowband noise or warbled tones. The reason for that is because narrowband noise and warbled tones are not frequency-specific. The SPL measure goes up and down and you really cannot see a steady value. That is why we use the continuous signal. We routinely measure 500 through 4,000 Hz.
Do you find that, for patients new to amplification, the first-fitting to target is too loud at first?
It varies. As you know, in most of these software packages, there is a tool that you can use to correct the target for acclimatization. If the patient is an experienced user, you may be able to set the acclimatization all the way to 4. If it is a new user, you may set it all the way down to 1. The 1 has less gain and the 4 has more gain, correcting for prior experience.
I am on the fence with that one. I am not 100-percent sure, but I certainly understand those who would put it down to acclimatization, or reduce target for those who have less experience and increase the target, if you will, for those who have more experience. So I do not have that much experience to give that one an answer, but for me, personally, I never think too much about that because I am not quite sure if that is a major point.
Why do you choose loud, but okay versus uncomfortably loud?
Actually, that is a long story. Twenty years ago when we used uncomfortably loud, we had way too many people coming back reporting that the hearing aids were too loud. Intuitively, it did not make sense to put something into somebody's ear that could be uncomfortable. Why would you buy a shoe that is uncomfortable?
At that time, we reduced the descriptor to loud, but okay. We found the number of patients who come back and report that these hearing aids were too loud significantly decreased. There was a lot of patient feedback in the clinic to tell us that we did the right thing.
Any ideas on how we can motivate our colleagues to utilize these real-ear measurements as well?
I have been asked that question before. If you go to Canada, Australia, or even Brazil, real-ear measures are required for reimbursement. I am afraid to say that the only way that you are going to make real-ear measures more part of the process – because what we are doing now simply is not working – is to somehow tie it to reimbursement. Unfortunately, I do not see that happening. Hopefully, the Au.D. will create change on that front, as well.
References
Aarts, N.L., & Caffee, C.S. (2005). Manufacturer predicted and measured REAR values in adult hearing aid fitting: accuracy and clinical usefulness. International Journal of Audiology, 44(5), 293-301.
Aazh, H., & Moore, B.C. (2007). The value of routine ear measurement of the gain of digital hearing aids. Journal of the American Academy of Audiology, 18(8), 653-664.
Aazh, H., Moore, B.C., & Prasher, D. (2012). The accuracy of matching target insertion gains with open-fit hearing aids. American Journal of Audiology, July, epub.
American Academy of Audiology. (2007). Guidelines for the audiologic management of adult hearing impairment. Retrieved from audiology.com/haguidelines 2007.pdf
American Speech-Language-Hearing Association. (1998). Guidelines for hearing aid fitting for adults. Retrieved from www.asha.org/policy/GL1998-00012.htm
Bentler, R.A., & Cooley, L.J. (2001). An examination of several characteristics that affect the prediction of OSPL90 in hearing aids. Ear and Hearing, 22(1), 58-64.
Harrowven, R.G. (1998). Insertion gain versus median ear corrected coupler gain: a comparison of two fitting methods in new NHS hearing aid users. British Journal of Audiology, 32(3), 153-165.
Hawkins, D.B., & Cook, J.A. (2003). Hearing aid software predictive gain values: how accurate are they? The Hearing Journal, 56(7), 26, 28, 32.
Keller, Jennifer N., "Loudness discomfort levels: A retrospective study comparing data from Pascoe (1988) and Washington University School of Medicine" (2006). Independent Studies and Capstones. Paper 83. Program in Audiology and Communication Sciences, Washington University School of Medicine. Retrieved from digitalcommons.wustl.edu/pacs_capstones/83
Kirkwood, D.H. (2010). Survey probes dispensers' views on key issues raised by Consumer Reports. The Hearing Journal, 63(5), 17-18, 20-22, 24, 26.
Mueller, H.G., & Picou, E. (2010). Survey examines popularity of real-ear probe-microphone measures. The Hearing Journal, 63(5), 27-32.
Norman, M., & James, P. (2000). Insertion gain measurements using two low-powered analogue hearing aids. British Journal of Audiology, 34(6), 375-377.
Pascoe, D.L. (1988). Clinical measurements of the auditory dynamic range and their relation to formulas for hearing aid gain. In J. Jensen (Ed.), Hearing aid fitting: Theoretical and practical views (pp. 129-152). Proceedings of the 13th Danavox Symposium, Copenhagen.
Swan, I.R., & Gatehouse, S. (1995). The value of routine in-the-ear measurement of hearing aid gain. British Journal of Audiology, 29(5), 271-277.
Valente, M., Valente, M.M.A., & Goebel, J. (1991). Reliability and intersubject variability of the real ear unaided response. Ear and Hearing, 12(3), 216-220.
Valente, M., & Van Vliet, D. (1997). The Independent Hearing Aid Fitting Forum (IHAFF) protocol. Trends in Amplification, 2, 1-30.