
This is a transcript of a Siemens live webinar on AudiologyOnline. Download supplemental course materials: presenter's slides and PAL.
It is nice to be back with the Siemens Expert Series talking about a topic that I find interesting, normal loudness perception. I am approaching this from all three areas in which I work - teaching at Pitt, running a research lab with PhD students, and as a clinician. I see patients every week and am confronted with the question of how to return normal loudness perception to our patients. I would think the majority of you also are faced with this question.
Part of the goal of the Desired Sensation Level (DSL) prescriptive targets is returning normal loudness perception. To a lesser extent, it is also a goal of the National Acoustic Laboratories (NAL) targets. No matter what strategy we are using, it is an unstated goal in hearing fittings that soft sounds should sound soft, moderate sounds should sound moderate, and loud sounds should sound loud. I think a lot of us like that idea because it is the one thing we feel that we can make normal again. We know that we can’t restore normal hearing per se, but we sometimes feel that we can restore normal loudness perception.
Verification of Return-to-Normal Loudness Perception
Given that normal loudness perception is a common goal for a hearing aid fitting, how do we measure that we have achieved this goal? I would like to discuss the three most common ways we could go about verifying loudness perception within the context of a hearing aid fitting.
The first way to verify loudness perception would be to have the patients make judgments of loudness in the sound booth. Another way would be to use the Profile of Aided Loudness, which we call the PAL (Palmer, Mueller, & Moriarty, 1999). A third option is a patient interview, which is probably the most common method. Let’s examine each of these approaches.
Option 1: Judgments in the Sound Booth
Judgments in the sound booth or using some kind of questionnaire might give more data to quantify loudness and help us determine what programming changes may be needed. Judgments in the sound booth would typically involve using the Contour Test of Loudness Perception (Cox, Alexander, Taylor, & Gray, 1997). For those who have not used this test, it has the patient looking at a seven-category scale on a piece of paper in front of them. The categories range from very soft to uncomfortably loud. The clinician plays sounds, and the listener rates those sounds. The data are collected and charted. The only way this works is if we have some information about how a normal-hearing person would have judged these sounds.
This measurement is quite controlled. The patient is in a sound booth, and you are controlling the sounds and charting their ratings. It is not a real-world activity obviously, but, depending on the stimuli you use, it can be more or less a real-world measurement.
The timing of when to conduct a loudness perception measurement is an important consideration. I would suggest not conducting the measurement on the day of the hearing aid fitting. Do we do it on the next follow up fitting? Do we wait until the patient has a complaint about loudness, assuming they have already adapted to amplification? Is it a routine measurement we conduct with all patients, or only with certain types of complaints? I do not have a right or wrong answer to these questions, but these are the issues with which we are faced in the clinic each day.
The Contour Test uses a loudness scoring sheet. It uses a scale of 0 to 120 dB in 5 dB steps, but you could use smaller steps, especially for more severe losses. You play sounds, usually one low-frequency around 500 Hz and one high-frequency around 3000 Hz. If you think of programming the hearing aid, you would like some information for the low-frequency channels and some information for the high-frequency channels given that people usually have a different degree of hearing loss in those two areas. You record these data by indicating their loudness rating (1 - 7) next to the dB level of the presentation. Then you compare that to what people with normal hearing would have rated in the same acoustic situation (sitting in a soundproof booth).
The chart in Figure 1 shows the normative data that we use; this was collected in our sound booth at Pitt. Given that sound booths are standard, anyone could use this information. This is showing by frequency, at what dB levels normal-hearing people are rating the loudness of sounds. You can see at 500 Hz around 15 dB, normal-hearing people are saying that is very soft, and then it increases from there. You plot your hearing aid users’ results against these results. You may evaluation loudness ratings for specific frequencies, for speech, and monaurally or binaurally depending on your clinical goal. It all depends on how much data you want, and that relates to how much fine-tuning you will be doing with the hearing aids.
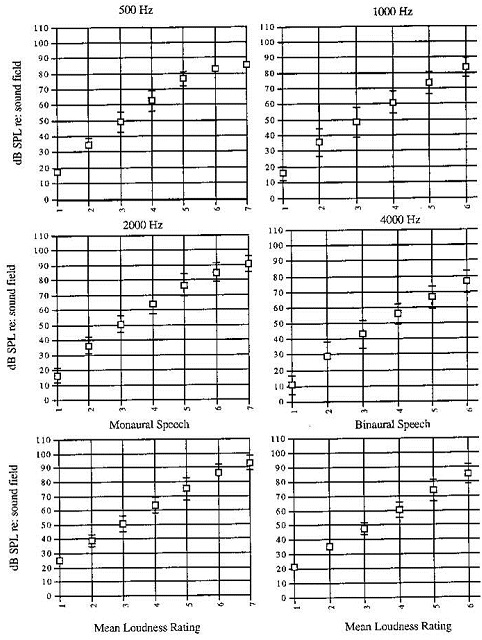
Figure 1. Normative data for loudness scaling used at University of Pittsburgh.
Figure 2 shows a recording for a patient. The normative data are indicated by the boxes, and we have made U marks where the person rated the sounds for binaural speech. Normal-hearing people say that very soft is around 20 dB, but for this patient, the signal was almost at 45 dB before they said things were very soft. This information tells us that the patient is underamplified, since we have to raise the sound before they judge the sound to be soft. For this person to get normal loudness perception, more gain would be needed.
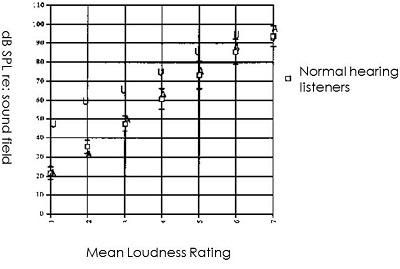
Figure 2. Loudness contour scaling from a subject; normative data are indicated by the boxes; U indicates that patient’s response to “very soft” stimuli.
The ratings for louder sounds, however, are closer to our normative data. That would be how we might do this in a sound booth, but that takes time, so we may choose to conduct this evaluation only if a patient is having issues with loudness.
Option 2: Profile of Aided Loudness (PAL)
Given that this method was a bit time consuming, it motivated Gus Mueller and me to think about how else we might measure loudness if we believe it is important. Obviously, Gus and I do think loudness is important in terms of patients accepting or rejecting hearing aids.
We developed the PAL, a subjective outcome measure. It has 12 environmental scenarios. We started out with 95, collected normative data, and defined 12 sounds on which a large group of normal-hearing people could all agree. There are now 4 sounds for each group: soft, moderate, and loud. These are sounds that your patients may or may not experience every day. We tried to include sounds that are fairly typical, but some sounds still may not be experienced by every patient. For example, an electric razor is a sound someone might not hear every day, so they would just leave that spot blank. When scoring, you would take the average of the sounds that were rated.
We use that same kind of contour rating scale from very soft to uncomfortably loud. Figure 3 is a page of the PAL. The sound of an electric razor is listed and then it asks, “Is it very soft to uncomfortably loud?” and next to that is a satisfaction rating. Regardless of their loudness judgment, it is interesting to know if they are satisfied with that loudness, so satisfaction was added to the PAL after its initial development. That could mean a patient may rate “comfortable” for sound that should be perceived as “soft”, but the patient indicates that they are satisfied with that perception.
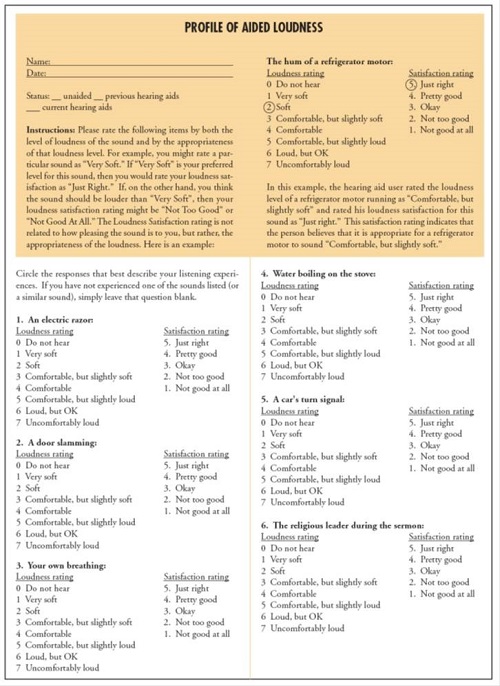
Figure 3. PAL questionnaire and scoring sheet. Click here to for larger view (pdf)
Satisfaction is an interesting consideration for clinicians. If the goal is to restore normal loudness perception, and the ratings show that you have not achieved that goal but the patient is satisfied, do you leave it alone? I would suggest that you do not change the hearing aid programming at this point if the patient is satisfied. I think that extra piece of data can be helpful, but remember that the PAL ratings are based on the patient’s memory of the sounds over the last few weeks. They are not experiencing the sounds at the time of rating them, as they would be if you were doing the test in the sound booth.
Option 3: How Do Things Sound?
The third option, which may be the most common, is asking the patient, “How do things sound?”, usually after they have been wearing their hearing aids for a few weeks. The patient may be able to verbally describe their experience to you, or they may be one of those patients who bring you written comments. It is your job as a clinician to figure out what exactly they are describing, as well as the frequency range and input level of those sounds or situations so that you can make programming changes to the hearing aids.
This is what the fitting assistants are based on in the manufacturers’ software. Your patient may say, “I seem to be able to hear sounds that are far away from me better than sounds that are near me.” So you would go in to the fitting assistant and select that from the scenario list. Then, in the background, the software will make changes to the hearing aid programming. Or, you can make the changes yourself in the programming software if you feel you have a good understanding of what the patient is describing.
Measured and Perceived Loudness Perception
I want to talk about the research that we have done here at Pitt, headed by PhD student Reem Mulla (Mulla, Palmer, Wasel, & Lao, 2013). We looked at the relationship between measured and perceived loudness perception. We have both sound booth measures and the PAL questionnaire, and we thought it would be interesting to know if these are highly correlated. If there is a relationship, you could then conduct one or the other. Our thought is that the questionnaire is a bit simpler and faster, but if the loudness contours are not related, that raises a whole different question.
Method
We had 30 participants with bilateral mild to moderately-severe sensorineural hearing loss. These were full-time bilateral hearing aid users of at least two months, and the mean use time was about 18 months. These were new users with some experience so they had adapted to sounds around them. They were fit by our clinic following best practice. They had probe microphone measures done, and we tried to match either an NAL or DSL target for their fitting. They had a hearing test. They completed the PAL, which is the questionnaire. They did the aided Contour Test for 500 and 2000 Hz and for connected speech, which has a little more face validity because it involves listening to a speech passage while rating it. The Contour Test was done in 5 dB steps, which is a typical increment. We measured real-ear-to-coupler differences (RECD) and the real-ear aided response to ensure the participants had audibility for soft, moderate and loud inputs. We do that routinely in the clinic, and in all of our research to make sure that audibility is not a factor in what we are trying to investigate. Again, we conducted the PAL and then the Contour Test.
Results
We compared the results of the PAL to results of the Contour test and found no significant correlation between any of the data. Clinically, I think most of us assumed that these were two ways to do the same thing, but clearly they are not. You are measuring two different things, which leads to more research.
There are some obvious reasons why these approaches might be different. I mentioned earlier that with the PAL, the person is recalling what they have previously heard, and with the Contour Test in the sound field, they are listening to it right then and there. Further research would have to figure out which piece of information is important for the hearing aid fitting, or if you want both pieces of information. I would point out that obtaining both, at least in our clinic, would be very time consuming. At this point, if you want to conduct a measure, you have to choose which one is going to work for you, because we cannot tell you right now which one is best to quantify loudness.
What we do know is on the day of the fitting, if you match your targets by using probe microphone measures, your patient is going to tell you sounds are too loud, especially soft sounds. The patient enters a period of adaptation. If you are a clinician that follows my theory on this, you spend a large part of the hearing aid fitting counseling the patient that they have been walking around for several years listening through a filter, basically. Now that we are bringing back all of the sounds, they are not going to sound normal in the beginning. Generally, that means they are going to sound too loud, but we need them to be full-time hearing aid users and let their brain adjust to the new sounds. Background sounds will eventually sink into the background. We tell them that they will start to have a normal perception of loudness. I think a lot of clinicians counsel along these lines, however, is that accurate based on evidence? If they wear the hearing aids full-time, will they have normal perception of loudness for soft, moderate, and loud sounds? Is that even achievable? As we move on, we will be looking at that question.
We have some data from a variety of researchers. The first is from Don Schum back in 2001. He interviewed patients at the initial fitting and asked them if there was too much amplification, insufficient amplification, or if the initial settings were fine. Over 40% of people said, “No, it is too much.” Some thought it was too little, some thought that it was okay. Clearly, the same thing is not happening for all patients; there is variability of patients’ first impressions. There may also be variability in how these people were fit, which may account for variation in their initial impressions, as well.
Managing Adaptation
How can we manage adaptation, since we rely on the premise that it is indeed happening? When we do a good job of verifying audibility, people will say sounds are too loud. At the first fitting, you could turn the hearing aid down based on the patient report, but in that scenario we are saying the patient is the expert. I personally have a hard time with that, because I think the patient is not the expert on the day of fitting; they have had a hearing loss and and they do not know how things should sound. In our clinic, we reject that idea; we base our first fitting on measurements.
We can say to the patient that we have returned audibility, which is, in essence, what they are paying for with a hearing aid. That is the basis of what a hearing aid does, and now the job is to get the patient used to it. However, if the patient will not tolerate the hearing aid the fact that we restored audibility doesn’t matter.
You could turn the hearing aid down initially with plans to turn it up over time. In this case, the audiologist and the patient are both the experts. We acknowledge that the patient cannot tolerate the initial settings, so you turn it down keeping in mind the goal you eventually want to reach. The problem with this approach is that it requires return appointments, which may be inconvenient for the patient and inefficient for the practice.
Another approach is turning the hearing aid down initially and having the aid automatically turn up to reach the goal over time, which is the verified response that is programmed into the aid. Automatic adaptation is available in newer technology. We do not have any data at this point to determine the ideal timeframe for adaptation. We, at Pitt, are running some of the experiments in that area, along with at least two or three other labs.
Another approach would be to use a trainable hearing aid. Here, the patient is the expert. The initial fitting matters, as you set the hearing aid at the ideal fitting, and then give them a volume control or means to manipulate the setting. If they make enough changes, the hearing aid permanently changes its response over time.
Another option is to fit to verified targets, and give the patient a volume control or program button to make adjustments, and they can get as far away from that initial fitting as they would like. The patient is in control, but they have the option of returning to the initial fitting or the goal.
Figure 4 summarizes these options. If sounds are too loud, people will reject the hearing aid. If we fit the hearing aid to a lower level, we risk them rejecting the hearing aid because they are not getting the benefit they need. We could gradually increase the gain over time, which is not physically convenient to people. We have an automatic way to start at a level the patient can tolerate and eventually move them to their ideal setting based on audibility. At this point more research is needed to recommend the best way to use the automatic adaptation.
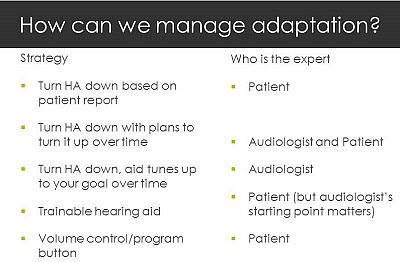
Figure 4. Strategies to manage adaptation and the corresponding expert in control of the setting.
Siemens, who is sponsoring this talk, is one manufacturer that offers a trainable hearing aid, which puts the patient in control. We conducted a study (Zhang, Palmer, & Mueller, 2012) on trainability not long ago. We used a control group that we fit with verification measures, told them to adapt to the setting for a month, and then we turned on the training feature after that month. The experimental group had the training feature activated from the beginning. We programmed the hearing aids at verified levels also, but the subjects could change things from day one. We found after eight weeks that the experimental group, who could change settings from the beginning, turned down the gain for soft sounds more than the control group who had one month to adapt to the settings prior to training.
Even with the adaptation period, the control group still wanted less amplification for soft sounds – but not for moderate or loud sounds. They still felt like soft sounds were not normal. At the end, the majority of subjects, regardless of group, liked the gain that they set for themselves away from the target. A few subjects were okay with the prescribed gain. Interestingly, when it was all done, most participants still wanted both settings - the one they had trained and the first one fit to targets (Figure 5).
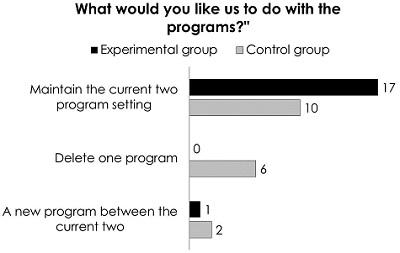
Figure 5. Group preferences for keeping or eliminating the programs in the trained hearing aid.
We gave the listeners several different situations (Figure 6). We had them judge which setting they liked better: the one they trained or the one that was the original target. When people wanted to know where sound was coming from or wanted to hear quiet sounds, they needed the target-fit response. They needed the measurable audibility. But when they were doing other things, they were happy for soft sounds to be quieter, if not inaudible. Some people trained the hearing aid so that some soft sounds were not audible.
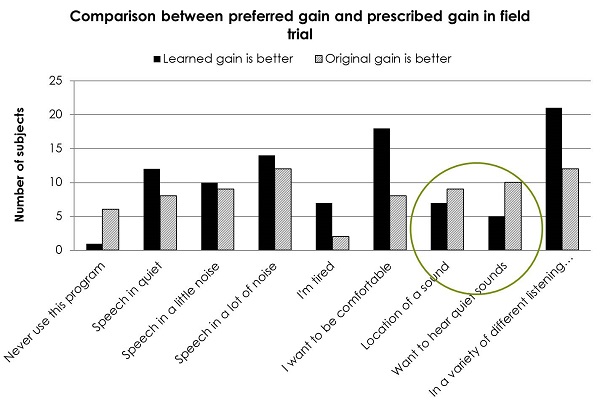
Figure 6. Comparison between preferred gain and prescribed gain in field trials.
The typical new hearing aid user with moderate, sloping bilateral sensorineural hearing loss has not been hearing soft sounds. The majority of patients want to hear moderate sounds, and that is what drives them into your clinic. Loud sounds are still okay; patients are not concerned with loud sounds, with few exceptions. When we think about adaptation versus fine-tuning, should one come before the other? Manufacturers are definitely taking adaptation seriously. They have integrated it into their software, and they keep perfecting it in different ways.
Don Schum (2001) showed that when you engage the adaptation feature in a manufacturer’s fitting software, it is not necessarily gain that is changing over time. Attack and release times change over time to help people slowly get used to their amplification. Data published in Seminars in Hearing back in 2001 showed the different ways that manufacturers were changing these parameters over time. With an adaptation manager, any changes that you thought needed to be made would happen automatically. It could be attack and release time. It could be compression ratios. It could be gain. Even 12 years later, what settings manufacturers are changing in adaptation protocols has not changed much. Typically, they reduce the gain for soft sounds for all frequencies, and then reduce the gain for high-frequencies for all input levels. That tends to be where they are looking to make people more comfortable; they just change them over time to bring those sounds into comfortable audibility.
The two evidence-based prescriptive formulas we have are the DSL and NAL. Both have new versions that have come out in the last two years, and they have both addressed the issue that soft sounds seem too loud, especially for new users. Both approaches have been modified, and if anything, DSL targets and NAL targets are now closer to each other than they have ever been. An entire edition of the International Journal of Audiology was devoted to this topic. In general, if you want to hear soft sounds or hear from behind, the DSL targets probably are going to do a better job for you as DSL calls for a bit more gain and output, so you have more audibility. With the NAL, you are going to be happier in terms of speech in noise. Both DSL and NAL have reduced gain for soft sounds in their current versions, acknowledging that those continue to be a problem. I do not know if that is the best solution, but that is what they are doing as an acknowledgement of the issue.
Mead Killion (2013) published data showing a comparison between NAL-NL1 and NAL-NL2. When you examine insertion gain across frequency for a moderate sloping hearing loss, there is quite a bit of gain around 1000 Hz, less gain in the lows, and a little bit less in the highs than at 1000 Hz for NAL-NL1. For NAL-NL2, we see more gain for the lows, less in the mids, and a little bit more for highs. These results indicate that the prescriptive formulae are also reacting to ongoing data from clinicians and patients about ideal settings.
What Can or Should the Audiologist Do?
Measure, Don’t Guess!
What can or should an audiologist do? For those of you who know me, you know that I think measurement is very important. We are unsure how people are going to react to loudness, and we know that loudness is quite variable among people. Loudness is a subjective impression. However, audibility is not subjective. Audibility can be measured. As an audiologist, we can address audibility and then cope with the aftermath of loudness perception. We can determine how to help the person adapt to loudness, or we can make changes to the fitting. By measuring, we know we have a starting point, and if we need to make changes to the fitting, we know what we have compromised or changed. The real-ear probe microphone measurement is going to ensure audibility. Currently, that is our only efficient and accurate way to approach audibility.
In terms of loudness judgments for loud sounds, we want to ensure comfort; that is important. If someone tells you a loud sound is uncomfortable, it is still going to be uncomfortable two months later.
We do have issues with our data for loudness summation. I think we are going to continue to see the prescriptive formulas changing as we have better data on how the hearing-impaired system deals with loudness summation as signals get louder. Most clinicians agree that we do not want someone leaving the clinic with loud sounds being uncomfortable for them, because they will reject the hearing aids. We want to use adaptation managers wisely. People cannot get used to something they cannot hear. If the adaptation manager makes things inaudible, they cannot get used to that, and, again, they will not wear something they will not tolerate. It is always a balancing act.
I want to remind you not to assume the manufacturers make the best fitting choice. They must use average data. When you look at the manufacturer’s screen and see the graphs that look like real-ear measurements, let me remind you that they are not. They are estimates of what the manufacturer thinks is happening. Unless you have a microphone in the ear canal, you do not know what is happening.
Figure 7 shows an example of first-fit programs. When you compare the first fit for four different manufacturers, you would have obtained these different responses in someone's real ear, all with the same hearing loss. These responses are wildly different; they cannot all be correct for this patient. Again, as long as we measure, this is a nonissue. Even if the first fit from the manufacturer is way off, if we are measuring, we can make changes and get to where we need to be for audibility.
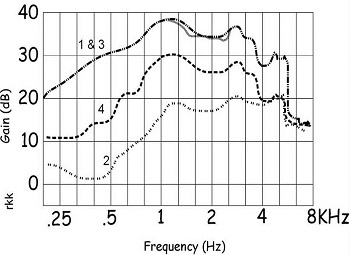
Figure 7. First fit responses from four different manufacturers.
Hawkins and Cook (2003) published data that I often use for understanding the simulated gain you see on the manufacturer’s screen versus what you have measured in someone's ear. They are not the same, and they cannot be the same. I am not criticizing the manufacturers, because they have to use average data and they cannot be more accurate than that. Hawkins and Cook measured insertion gain and compared it to simulated insertion gain. In the higher frequencies, they found vast differences. Unless we measure it, we do not know what gain we are getting in the high frequencies.
If audibility for soft and moderate inputs is important, along with comfort for loud sounds, then the way we measure matters. We need three important pieces to be accurate: first, we need the correct signal for real-ear probe microphone measures. We also need the correct measure of audibility, which are probe-microphone measures looking at output. Third, we need the true dynamic range of the person in dB SPL. The thresholds that we have in dB SPL are being used to produce the targets in dB SPL and it is important that we start with good data.
The Signal Matters
Depending on what signal you use, you could think you had quite a big difference in gain. You either want to use a good simulated speech signal, like the International Collegium for Rehabilitative Audiology (ICRA) noise, or real speech. There are quite a few speech signals that we can use from different probe-microphone manufacturers. Speech signals are broadband, which is important.
Use Real Ear Aided Response (Output) not Insertion Gain
The question comes up whether to use insertion gain or whether to measure real-ear aided response (REAR), which is output. To measure audibility, you do not want to measure insertion gain. Just to show you an example, Figure 8 illustrates a sharply sloping mild to moderately-severe hearing loss, with the slope between 1000 and 2000 Hz. We have matched our NAL targets pretty well for three input levels. If we only measure insertion gain, we think we have matched targets well and achieved our goal for the fitting, which may or may not be true.
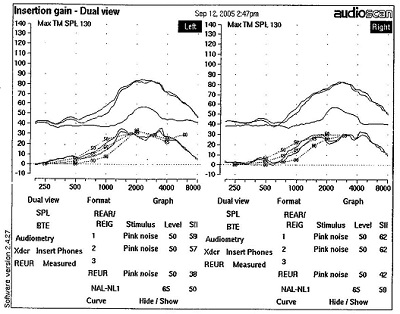
Figure 8. Insertion gain for a steeply sloping hearing loss for soft, moderate and loud inputs.
The actual REAR is shown in Figure 9. In reading these graphs, remember that the audiogram is flipped and displayed in dB SPL because we are measuring the output of the hearing aid. Quiet sounds are at the bottom and intense sounds are at the top. The output of the hearing aid is in the hatched area. In this case, soft sounds are audible through 1000 Hz, and then not audible past about 1500 Hz. I am not implying that we can necessarily achieve audibility for these higher frequencies, because there is significant hearing loss. However, this measurement shows us what is happening in terms of audibility of sounds, and what we have been able to achieve with the hearing aid. This will inform our counseling in terms of patient expectations.
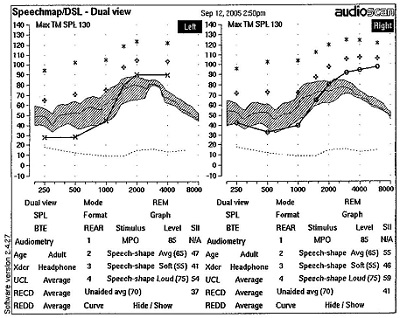
Figure 9. REAR from hearing aid.
HL to SPL Conversion Using RECD
Auditory mapping is only as good as the HL to SPL conversion. As a refresher, we need to display thresholds in dB SPL, but how do we get there? You measured your thresholds with insert earphones most likely in HL, and then we have to get from HL to SPL. If you use an average conversion, you are not ever going to be completely right. You want to be very accurate, because all of your targets are coming from those data. I will show you an example of where this could present a problem.
Figure 10 displays speech mapping. We have a right ear threshold displayed in SPL, and three measured output levels. By the output, you can see that it is all audible. The RECD is what we want to measure to make that conversion from HL to SPL.
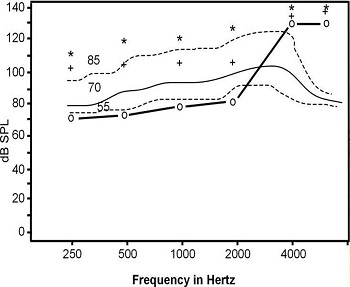
Figure 10. General auditory mapping for soft, average and loud inputs for right ear hearing thresholds using the average RECD.
Most important in a hearing aid fitting is determining the SPL at the eardrum. To get to the eardrum SPL, we have to convert dB HL with the reference equivalent threshold sound pressure level (RETSPL), which is built into your conversion. If we have the RECD measurement, we can get to the eardrum SPL. We can convert our HL to SPL thresholds very easily by measuring RECD, which is easy to do on any probe mic system. Then you will have accurate targets.
When we use the individually-measured RECD to get thresholds for the person in Figure 11, we see the three curves we measured are not quite as good as we thought (Figure 11). The soft inputs are now too low because we did not account for what was happening in the actual ear canal. We would set this hearing aid differently if we had these accurate data. I would encourage you to make sure you are doing RECD with your auditory mapping so you have accurate data.
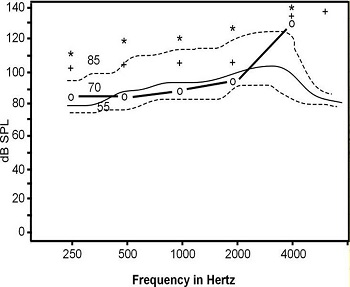
Figure 11. Auditory mapping using individual RECD data; compare to Figure 13.
Soft Sounds are Still Too Loud
Now let’s circle back to the topic of what to do when we use evidence-based prescriptive targets, measure everything according to the ways we have just discussed, and the patient still says soft sounds are too loud.
The first study we’ll look at is from Gus Mueller and Tom Powers (2001). They looked at new users and previous users. Normative data were collected for normal hearing people. They listened to sounds and rated those sounds as “soft.” Then, those “soft” sounds were played to the other listeners. This was a reference point of sorts; it is a level of sound in normal hearing individuals that is perceived as soft. On the first day of fitting, new users definitely did not rate those sounds as soft; they said those sounds were comfortable or comfortable/slightly loud. Some experienced users rated these sounds as soft, but this group spanned a wide range of loudness perception on the first day of the fitting. It is feasible to conclude that the new hearing aids provided better audibility due to the updated technology.
At week one post fitting, the new users’ preferences did not change. They still said these sounds were louder than “soft.” Previous users responded closer to the normal-hearing listeners’ perception of the sounds, but there was still a wide range of responses.
At week four, we have the same picture. The new users still think these sounds are comfortable, not soft, and the previous users have a wide range of responses. At week eight, things change a bit, especially for the new users. The new users now report these sounds are comfortable, but slightly soft. They are closer to a normal perception of the sound, but not completely normal. Interestingly, we see similar data out of other labs as well.
Based on these data, it takes about two months to return almost normal loudness perception for soft sounds. We did not return normal loudness perception; it is more normal than it was when the hearing aids were initially fit, though. That clearly tells us that there is adaptation going on, but it does not completely normalize.
Next, we have data from the last Auditory Society meeting by Johnson and Cox (2013). They rated where they would expect normal listeners to judge sounds, based on PAL norms. They then took a group of 59 aided listeners who rated the same sounds. They found similar results as Mueller and Powers (2001). The aided listeners’ ratings were not way off compared to those of normal hearing listeners, but they did not have a normal loudness perception.
In our lab, Reem Mulla (Mulla et al., 2013) looked at a large group of people with hearing aids using the Contour Test of Loudness in the sound booth and the PAL. We found that we returned normal loudness of soft sounds for the majority of hearing aid users for pure-tone signals in the sound booth. Obviously, this is a very narrowband signal because it is a pure tone. However, when we used the speech signal in the sound booth or soft items on the PAL, which are more broadband signals, normal loudness returned for only a very small portion of that group: 20% for speech in the sound booth, and 47% for the PAL. Generally, when we used more real-world signals, we did not return normal loudness perception for soft sounds. It got closer to normal, but it was not completely normal, which is consistent with the Johnson and Cox (2013) and Mueller and Powers’ (2001) data.
Interestingly, over 70% were satisfied with their loudness perception for soft, moderate, and loud sounds. That is important when we think about what our final goal is with these people. This group of people had been using their hearing aids and was successful according to the definition of keeping their hearing aids and using them more than eight hours a day. Yet, when we measure loudness perception, they do not perceive soft sounds normally, but they are saying they are satisfied. “Satisfied” is likely defined by buying hearing aids so they can hear better, and they do hear better and are satisfied with however they perceive these soft sounds. This is fairly consistent with Johnson and Cox (2013), Mueller, et al. (2001), and another study by Shi and colleagues in 2007.
On the Contour Test for soft sounds using speech, very few people rated those as soft. That means our own real-world broadband signal is certainly not being perceived as soft. In our trained gain study, (Zhang et al., 2012), the group who had been adapting for four weeks and then started to be able to manipulate their volume and have the hearing aid learn from that certainly experienced adaptation compared to the group that changed the volume originally. However, even that group did not completely adapt to the soft sounds. They still decided to reduce their volume further to try to get that soft perception.
Normal Loudness Perception: Is it Achievable?
Softness Imperception
In our research lab, we have been interested in trying to figure out what this is all about. Is it not possible to return normal perception for soft sounds? There are some data from Mary Florentine that would support that notion. Her model of loudness for hearing-impaired people would predict that a group of these people are never going to get that perception of “soft.” If that is true, then it certainly is not worth working towards. She did quite a bit of work in the early 2000s and continues looking at loudness summation in listeners with cochlear hearing loss (Buus & Florentine, 2001). She indicates that loudness perception at elevated thresholds, meaning where the listener has hearing loss, may be greater than normal. I do not think we know if this applies to particular cochlear losses or the majority of cochlear losses, because these are current theories that are still being tested. It is an interesting concept. It means that at least for some people with cochlear hearing loss, as soon as we can make something audible for them, the perception will not be soft. They have an “imperception” for soft sounds, and that loudness grows normally thereafter. It is not an abnormal growth of loudness; it just an abnormal starting place in these cochlear hearing losses.
Marozeau and Florentine (2007) published data on the subjective judgment of loudness. They graphed input levels and loudness judgment in sones. It was a subjective judgment, and people’s perceptions can be quite different. A normal hearing listener will hear soft sounds beginning about 5 to 10 dB, and then there will be a gradual growth of loudness until some point where they cannot tolerate sound anymore. Cochlear hearing loss, as a loudness growth function, looks very different. These listeners, do not perceive anything until the threshold of their hearing loss. Take the example of someone who has thresholds at 60 dB. They will perceive a soft sound at 60 dB, and then their loudness growth will go almost straight up instead of show a nice gradual upward slope. That would be an abnormal growth of loudness.
This is saying that listeners with cochlear hearing loss think things are getting louder very quickly; that perception gets a little less steep as sounds become louder and louder, and then they hit a normal perception of very loud sounds. People with hearing loss come to a point where loud is loud, just like it is for normal hearing people.
Dr. Florentine describes a point where a person with hearing loss can detect a sound, yet their loudness judgment of the sound is quite high compared to what we would have typically thought. As soon as the sound is audible, they do not judge it as barely audible; they say it is soft or soft, but comfortable. They skip those first soft ratings because their system is not capable of hearing very soft.
Epstein and Florentine (2006) also looked at the reaction time paradigm, which says that if something is perceived as comfortable, the reaction time is going to be faster than if it the sound is soft. Soft sounds are accompanied by a little hesitation. When she used this paradigm, she proved her point and found that people with cochlear hearing loss have a faster reaction time, implying that they never have a perception of softness. Their system jumps to a louder perception than soft.
Refuting Study
Before I wrap up, I would like to say that not everyone agrees with what I have presented today. Brian Moore would be one example. There are many ways to capture loudness. He did a loudness matching procedure with four listeners (Moore, 2004). Although four subjects may sound like too few for an experiment, most psychoacoustic experiments include a small number of subjects. His results did not agree with some of Mary Florentine's results, and the differences may be explained by the two different methodologies. She used a reaction time procedure and he used a matching procedure. We do not have a study comparing those two procedures, particularly which one is more meaningful to us as clinicians.
Applying Softness Imperception in Hearing Aid Fittings
I am interested in Mary Florentine's perception of this, because it predicts what we are seeing clinically, that most people do not ever get a sense that sounds are soft. They have an audible signal, and they are satisfied with that. If our goal is to keep saying to them that these things should be sounding soft, that is probably not a realistic goal for many patients. If you want to adjust soft sounds so that they are rated as “soft” instead of as “comfortable”, you would have to make them inaudible, and then you do not get a soft perception either. In that case, the hearing aids is not helping to make soft sounds audible.
If the softness imperception model is correct, and we do not know that it is, then we have two choices for what we can do to help the patient. You could say to them that they are going to adapt and eventually accept the sound. This is still adaptation, but it is more like they are adapting to the fact that soft sounds are not soft, but they can still be successful as they can hear these sounds. Or you can choose to be less successful and make soft sounds inaudible. You likely can have a balance of both by using expansion to get rid of the very soft sounds that may be annoying, yet still provide other soft sounds that are perceived as soft, but comfortable, and contribute to listening and understanding.
Questions and Answers
I think the PAL has some very beneficial information, especially when we find ourselves with challenging fittings. Is it possible to send that questionnaire home with the patient so that you can capture their reaction more in real time versus having them come back to the clinic and report?
Yes, you could send it home. That is an interesting idea. Even if they did not use it in the typical way, it might get them just thinking about how they are looking at things.
References
Buus, S., & Florentine, M. (2001). Growth of loudness in listeners with cochlear hearing losses: Recruitment reconsidered. Journal of the Association for Research in Otolaryngology, 5, 120-139. doi: 10.1007/s101620010084
Cox, R. M., Alexander, G. C., Taylor, I. M., & Gray, G. A. (1997). The contour test of loudness perception. Ear and Hearing, 18(5), 388-400.
Epstein, M., & Florentine, M. (2006). Reaction time to 1- and 4-kHz tones as a function of sensation level in listeners with normal hearing. Ear and Hearing, 27(4), 424-429.
Hawkins, D. B., & Cook, J. A. (2003). Hearing aid software predictive gain values: How accurate are they? The Hearing Journal, 56(7), 26, 28, 32, 24. doi: 10.1097/01.HJ.0000292552.60032.8b
Johnson, J., & Cox, R. M. (2013, March). Is normal loudness the appropriate goal for hearing aid fittings? Presented at the annual conference of the American Auditory Society, Scottsdale, AZ.
Marozeau, J., & Florentine, M. (2007). Testing the binaural equal-loudness-ratio hypothesis with hearing-impaired listeners. The Journal of the Acoustical Society of America, 126(1), 310-317.
Moore, B. C. (2004). Testing the concept of softness imperceptions: loudness near threshold for hearing-impaired ears. Journal of the Acoustical Society of America, 115(6), 3103-3111.
Mueller, H. G., & Powers, T. (2001). Consideration of auditory acclimatization in the prescriptive fitting of hearing aids. Seminars in Hearing, 22(2), 103-124.
Mulla, R., Palmer, C., Wassel, N., & Lao, A. (2013, March). Relationship between measured and perceived loudness perception. Poster presented at AudiologyNOW, American Academy of Audiology annual meeting, Anaheim, CA.
Palmer, C. V., Mueller, H. G., & Moriarty, M. (1999). Profile of aided loudness: a validation procedure. The Hearing Journal, 52(6), 34, 36, 40-42.
Schum, D. (2001). Adaptation management for amplification. Seminars in Hearing, 22(2), 173-182.
Shi, L.F., Doherty, K.A., & Zwislockit, J.J. (2007). Aided loudness growth and satisfaction with everyday loudness perception in compression hearing aid users. Journal of the American Academy of Audiololgy,18(3), 206-19.
Zhang, M., Palmer, C., & Mueller, H.G. (2012, March). Gain learning hearing aids: does timing matter? Poster at the annual meeting of the American Auditory Society, Scottsdale, AZ.
Cite this content as:
Palmer, C. (2013, August). Siemens Expert Series: Normal loudness perception: Is it important, is it achievable?. AudiologyOnline, Article 11984. Retrieved from: https://www.audiologyonline.com/