Gus Mueller: Today Dr. Ben Hornsby and I are going to be talking about a topic that could be new to some of you—it’s only been around since the 1930s—speech recognition testing. A few weeks ago, over a beverage I think, Ben and I were discussing some of our concerns about how word recognition testing is conducted today, and how much this differs from what we are teaching to our AuD students at Vanderbilt. Ben and I have some firm beliefs, but when we see how different our approach is from common clinical practice, it made us think that we better go back and dig through the literature again just to make sure we were right. So Ben has been sequestered in the Vandy Library for the last week or so, and he’s come up with a few key articles to discuss. I didn’t bring many articles, but I have several opinions and we’ll see how closely they agree with Ben’s data.
Why Test Word Recognition?
I’m guessing that almost every one of you out there reading this conducts word recognition testing. A question that I like to ask a student is, “Why are you doing this testing?” “What are you trying to find out about the patient?” To me, the answer is pretty simple. Our goal is to determine the patient’s optimum performance for word recognition under controlled and standardized conditions. In other words, how good does it get? What is the best we can expect?
It is also important to remember what is not the purpose of the testing. For example, it is not to determine an estimate of how the patient performs in the real world. We are not going determine real-world performance by testing with monosyllables, under earphones, in quiet, in a test booth, with no visual cues. The purpose is also not to determine how they perform when the words are presented at a fixed level above the patient’s SRT. Why would we want to know that? As we go through our material, I would like you to keep in mind why we are doing word recognition testing: to determine the patient’s optimum performance, obtained in such a standardized way that we can confidently enter our findings into the patient’s medical records.
If we determine optimum performance, sometimes referred to as PB-Max, and we do this in a valid and reliable way, how can we use these findings clinically? Monosyllabic testing in quiet is extremely popular, so there must be some good uses of the findings, right? There are basically four uses that might be helpful:
- To determine if the patient’s performance agrees with his or her pure-tone hearing loss. Are the findings consistent with what you would expect for someone with a cochlear pathology?
- To identify unusual asymmetry that is not predicted by the hearing loss.
- To monitor performance over time, through sequential testing.
- To assist in making amplification decisions (e.g., if a person has a relatively symmetrical hearing loss, but highly asymmetric word recognition performance, this could influence what ear to fit for a patient who only wants to purchase one hearing aid).
As Ben and I were preparing this talk, I was reminded of a quote from Mark Twain. He said: “Do the right thing. It will gratify some people and astonish the rest.” I think that that certainly applies to word recognition testing. The uses of the results that I just mentioned only apply if the testing is conducted in a valid and reliable manner, which leads us to what we are going to talk about today. We sat down and came up with what we thought were five general components to do effective clinical word recognition testing. You need to use the correct presentation levels, use standardized materials, maximize test efficiency (because we’re all busy), interpret the findings carefully, and finally, maybe most importantly, avoid bad habits—such as the notorious live voice testing.
Selecting Appropriate Presentation Levels
Gus Mueller: Let’s start with our first topic, selecting the best presentation levels. Ben, are you ready?
Ben Hornsby: I am, but I'll let you provide us with a little introduction.
Mueller: Okay, I’d like to start things off with a little story. It relates directly to presentation levels. This event happened about a year ago, and I wasn’t the clinician involved, but I got the story first-hand from the second audiologist to see this patient. The patient was a 55-year-old male who was self-referred. He had a history of noise exposure, as he had been hunting without hearing protection ever since he was a teenager, with self-perceived hearing loss and tinnitus. His primary reason for the visit was to see if hearing aids would help. His pure-tone thresholds were mainly symmetrical, dropping to around 60-75 dB in the high frequencies. As you know, this is nothing unusual for a person with a history of noise exposure. There was somewhat of a difference between ears at 2000 Hz, however, where the right ear threshold was 40 dB, and the left ear dropped to 60 dB. So, if you can picture that audiogram, the left ear is now 20 dB worse than the right at 2000 Hz. The patient had normal hearing in the lows, which is what drives your speech reception threshold (SRT), so his SRT was 10 dB in both ears, which agreed with the average of his 500 and 1000 Hz thresholds.
This configuration is probably not much different from several patients that you all have seen—nothing very unusual. When the audiologist conducted word recognition testing, she used the SRT-plus-40 dB approach. In other words, she used a 50 dB HL presentation for both ears. The word recognition scores she obtained were 96% for the right ear and 80% for the left, so this patient had a 16% difference between ears. It’s surprising the patient did as well as he did for the left ear, as much of the speech signal wasn’t audible. Now, if you were the audiologist who used this presentation level for the poorer ear, I would think that your instructions to the patient would go something like this:
“I’m going to be giving you a list of words, which I would like you to repeat back to me. Many of the words have high-frequency components, which are necessary for understanding. I have decided however, that I will not make the words loud enough for you to hear these important high-frequency components in your left ear. You then, of course, will do pretty poorly, and I will write that score down in your medical records.”
Pretty crazy, huh? This is like the optometrist moving the Snellen chart another 20 feet away just to mess with you!
Okay—back to the story. The testing was conducted by an audiologist who worked with an otolaryngologist, so once the patient finished the audiologic testing, he walked down the hall to the ENT clinic and, because of the word recognition asymmetry, an MRI was ordered to rule out a space-occupying lesion. As you might expect, it came back negative.
One might question why an MRI is being ordered for a 16% asymmetry? But, there actually are American Academy of Otolaryngology (AAO) guidelines entitled Recommendations for Screening MRI for Asymmetric SNHL, which state, “a difference between ears in speech discrimination of >15%.” (For you younger readers, discrimination is what we used to call word recognition 30 or more years ago). So the otolaryngologist was simply following the guidelines of his professional organization.
About six months later, this patient was seen at a different audiology clinic where word recognition testing was conducted again, this time at 80 dB HL in both ears. Probably to the surprise of none of you, the scores were now 94% for the right and 92% for the left. Because . . . guess what, the words were now audible in the left ear.
This unfortunate case begs the question—why would anyone conducting a diagnostic speech test purposely present the speech at a level that would nearly guarantee invalid test results and potentially lead to additional (expensive) testing. And what about the undue stress to the patient, who thought he might have a tumor until the MRI results were back? Selecting the correct presentation level for word recognition testing is not rocket science—let’s do it right! And maybe Dr. Hornsby has some research findings to help us down the correct path.
Ben Hornsby: Interesting story Gus, and unfortunately I fear it might happen more than we’d like to admit, as the SRT+40 dB approach for conducting word recognition doesn’t want to die. Obviously, picking the best presentation level is something that researchers have looked at for many years. The SRT+40 dB approach originates from the early research with people with normal hearing, and a lot of the early work was conducted using people with mild to moderate hearing loss. But that’s certainly not who we always see in our practices.
So what is the best presentation level? Leslie Guthrie and Carol Mackersie (2009) looked at this topic fairly recently, and published their findings in the Journal of the American Academy of Audiology (JAAA). Before I talk about their study specifically, I’d like to do a short review of what probably prompted their study.
We all know that there are a lot of different ways to decide on which level to present word recognition materials. There are some common clinical approaches that are used, and the one that we’ve already mentioned is what I’m calling a fixed sensation level. For this, you first obtain the SRT, and your word recognition presentation level is generally then 30 to 40 dB above that. That approach tends to get used quite a bit, but there are some serious concerns; perhaps the most serious is the one Gus just mentioned. For someone with good low-frequency hearing and a downward sloping high-frequency loss, it often will not result in a high enough audibility level for the patient to hear speech sounds and reach the maximum score we are seeking with the test.
In contrast, if you present at 30-40 dB above the SRT of a patient with a severe flat hearing loss, you might exceed their loudness discomfort level (LDL).
In our clinic here at Vandy, we generally use a fixed HL approach. Clinicians use either 75 or 80 dB HL as a presentation level for word recognition testing, but that may exceed some patients’ loudness tolerance levels. For patients with a more severe loss, it might not be loud enough for them to detect all of the speech. Another approach is the loudness-comfort approach. It is somewhat intuitive that you might want to test performance at the patient’s most comfortable loudness level (MCL), but as Gus mentioned earlier, that’s not really the purpose of this test. It’s not of interest to know how well the patient understands when the speech signal is “comfortable,” but rather, what is the best performance possible.
So some people might use MCL, others might use something close to the LDL. There are some issues with using too high a presentation level. It can be too uncomfortable, and we can degrade performance at that level. One point I am going to make here is that there is not a lot of support for being 100% confident that whichever method you use, you will be able to consistently extract the patient’s maximum score. It’s possible we are going to need to test speech recognition performance at more than one level.
Mueller: I agree with what you’re saying, and I know that the VA has protocols for this type of testing when compensation is an issue. However, I think that testing at more than one level is going to be a tough sell for many busy clinicians.
Hornsby: I suspect you’re right, which takes us back to the findings of our article. Guthrie and Mackersie (2009) asked if there was one method for selecting a speech level that’s going to give us the best shot of achieving a phonetically balanced (PB) maximum. If we are only going to test at one level, which one is going to give us the best chance at maximum performance without exceeding UCL, and does that level vary depending on whether the patient has a mild loss or a more severe loss?
They gathered 40 people with different degrees of hearing loss and divided them into four groups. Their audiograms varied from very steeply sloping with about a 20 dB drop between 1000 and 2000 Hz to more gradual sloping losses. The audiograms for the gradual group went from very mild pure-tone averages (PTA) of 26 to 40 dB up to very severe PTAs. So they had a wide range of hearing losses. Then they did what we can’t do—well, we could do it if we only had a couple patients a day! They measured each individual’s performance intensity (PI) -PB functions at multiple levels, using 5 dB steps ranging from the SRT+10 dB up to 5 dB below the patient’s LDL. By using this approach, we’ve pretty much ensured that we are going to find the maximum performance level.
The materials used for measuring word recognition were the CASPA. People may not be familiar with this test. It’s the Computer Assisted Speech Perception Assessment developed by Arthur Boothroyd (2008). It uses monosyllabic consonant-vowel-consonant (CVC) words, similar to the NU-6 list. An advantage of the CASPA is that you can score those words using a phoneme level instead of just a word level. For each word presented, there are three phonemes, and you can score each of those and increase the reliability of your testing, as you triple the items.
Once they measured all those PI-PB functions, they then looked at five different points on the function for each person. One of the places they looked at was at a fixed level. The level they choose was 95 dB SPL. If we convert that to HL, it is 75 dB HL. That’s a pretty common level used by clinicians. The use of this level is based on work by Kamm and colleagues (Kamm, Morgan, & Dirks, 1983), that showed that you had a pretty good chance of hitting PB-Max in about 75% of patients with mild to moderate losses if you present at 75 dB HL. They also looked at the performance that was obtained at each individual’s MCL. They measured loudness ratings using a method from Hawkins and colleagues (1987); these are loudness anchors very similar to that of the Cox Contour Test.
Another level they looked at was the patient’s LDL minus 5 dB. The last two methods they used were sensation-level (SL) based on the SRT and the threshold at 2000 Hz. The SL varied depending on how much hearing loss they had or what the subject’s SRT was. For example, for someone who had an SRT of 35 dB or better, the SL they choose was 35 dB SL, so they would present at 70 dB, or somewhat less, depending on the SRT. If you had very poor SRT, the SL was less so as to try not to exceed loudness discomfort levels. This similar pattern was used for the 2000 Hz threshold. When there was significant hearing loss based on the threshold at 2000 Hz, the level was only 10 dB SL to limit loudness discomfort. As threshold increased, the presentation level either stayed the same or went up progressively. The authors obtained these various scores, which they then examined using five different methods. Here is what they found.
One of the general findings was on average, you will have the best chance of getting the highest score if you used the LDL-minus-5 dB method. The 2000 Hz SL method gave comparable scores most of the time. Those were the two methods that gave you the best scores, but the differences between methods varied a bit depending on the hearing loss of the participants.
For example, for the mild loss group, all of the methods gave pretty much the same score; it really didn’t matter which method they used. This makes sense, as they all would provide enough audibility. For the steeply sloping loss, there was a similar pattern. One thing that they did notice was that there was a significant difference between the mean scores. The LDL-minus-5 scores were significantly better than when they used the SL method based on the SRT. As we’ve already discussed, the SRT-SL method didn’t make things quite high enough in level to optimize word recognition. So, in this case, everything is similar except the SRT-SL method, which was a consistent pattern. The condition where it mattered the most was with those with more severe hearing loss. For these people, the LDL-minus-5 method gave you a higher score than any other method. In fact, if you used a fixed level, the mean scores were a little less than 60% correct, and for the LDL-minus-5 dB, around 80% correct. So on average, there was almost a 20% difference. For people with more severe loss, it’s really important that we are presenting at a high enough level so that speech is audible if we want to know what their maximum score is going to be. If you want to get the highest score, it appears that using the LDL-minus-5 method is going to get you pretty close most of the time.
Mueller: I remember this study pretty well, and I like their attempt to get at a common clinical question. My concern is that is that to use their “best” method, we would have to conduct a test we don’t normally do—a speech LDL. At least I wouldn’t think that people are dong speech LDLs, as what you have just described might be the only reason to ever do this testing (Mueller, 2011). And in addition to the time factor to conduct this additional test, LDLs often are conducted in a rather haphazard manner. I’m not sure it’s wise to rely on this to select something as important as the presentation level for word recognition testing. You mentioned that the 2000 Hz + SL method was essentially the same, so that method would get my vote, as the 2000 Hz threshold measurement is probably pretty consistent among audiologists.
Hornsby: True, there would be a time factor added for the LDL method. And you’re right; their results show that you can get pretty close with the 2000 Hz + SL method. That did well for most groups. It’s important to point out that what wasn’t optimal across several groups was the SRT method. The SRT plus a fixed SL tended to not make things audible enough to maximize scores for some participants, and for others it made things too loud.
Mueller: Given that we both seem to agree that the 2000 Hz + SL method probably has the best combination of efficiency and accuracy, we probably should furnish our readers the SLs to use, so they don’t have to look up the article.
Hornsby: Sure, here are the SLs used by Guthrie and Mackersie (2009):
The SL values shown below are added to the 2000 Hz threshold to obtain the presentation level:
2000 Hz Threshold <50 dB HL: 25 dB SL
2000 Hz Threshold 50–55 dB HL: 20 dB SL
2000 Hz Threshold 60–65 dB HL: 15 dB SL
2000 Hz Threshold 70–75 dB HL: 10 dB SL
Mueller: Pretty easy to remember, but you might need a “cheat sheet” pasted to your audiometer for the first few days. You know, the Candice Kamm study that you mentioned was conducted in 1983 or so, right?
Hornsby: That’s right—1983 it was.
Mueller: Okay, that was 30 years ago. So for 30 years, we have known that the SRT-SL is not a very good method to use. So why is it still so popular today?
Hornsby: That’s a good question. I suspect it has something to do with tradition. People get taught something in school and they continue to use it—although one would hope that approach hasn’t been taught for 30 years, but who knows. As I mentioned earlier, the SRT plus a fixed SL really came from work with normal hearing listeners back in the 1940s or so. For normal hearing listeners, you nearly always can obtain PB-Max within about 30 dB above the SRT. But for people with hearing loss, it turns out that that’s often not an effective way of doing it.
Use Of Standardized Materials
Mueller: Okay, one issue addressed and a solution offered. Off to a new, but related topic.
We know that the NU-6 word lists were designed as 50-word lists. And we know that considerable research has been conducted using these 50-word lists to determine if there is inter-list equivalency, which is important. There also has been a lot of work examining the different recordings of the NU-6, and they all have seemed to turn out pretty good—by far the most researched is the Auditec of St. Louis version, and indeed the 50-word lists are equivalent. But, rumor has it that sometimes an audiologist might use a half list—that is, only present 25 words of a given list for testing for one ear. Is it really okay to only use ½ of a standardized test? I know that can be risky for blood pressure testing, but how about word recognition?
Here is an example. Many of you already know that there has been research that has taken the recorded Auditec NU-6 lists, and has rank-ordered the words in terms of difficulty. The most notable research on this topic is by Hurley and Sells (2003), and I’m betting that Dr. Hornsby is going to talk about this research later. In case you haven’t thought about it, the difficulty level of the words in the list is quite variable. In the Hurley and Sells work, for example, some of the words in the list were missed over 50% of the time by their patients, whereas other words were missed less than 10% of the time. In case you are curious regarding the rank ordering, I’ve provided a copy, shown below in Figure 1. This example is for List 1, but the ordering is available for all four lists.

Figure 1. Ordering of difficulty (hardest to easiest) for the Auditec recording of the NU-6 List 1. Based on the work of Hurley and Sells (2003).
Let’s take the example of a patient you see with a mild-to-moderate symmetrical downward sloping hearing loss, with somewhat reduced cochlear function for speech understanding. Even when you used the most appropriate presentation level, his true PB-Max for both ears is around 80%, which is a pretty common finding. For this discussion, let’s say that his performance was such that he missed the 10 hardest words (See Figure 1). In Figure 2 I have the standard ordering for the NU-6, which is what many audiologists use, and for List 1, I have checked the 10 most difficult words, the ones this patient would have missed.
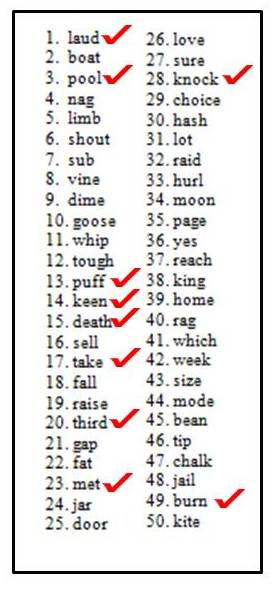
Figure 2. Standard ordering of the Auditec NU-6 List 1. The ten most difficult words have been checked.
Let’s assume that the audiologist doing the testing follows the rules and conducts a full 50-word list. The score for the right ear would be 80%, and she would then go on and do another 50 words for the left. But what if an audiologist would be so bold as to only do half of a list? What would happen then? Well, we can do the math. If indeed true performance was about the same for both ears, as you can see from the words checked in Figure 2, the patient would score 68% for his right ear (first ½; 8 missed words) and 92% for his left ear (second ½; 2 missed words), a 24% asymmetry. If this patient was tested back in the clinic I was talking about earlier, he’s going to get an MRI. If this patient said he only wanted to buy one hearing aid, I could imagine somebody fitting him on the 92% ear and not fitting him on the 68% ear. All this because an audiologist wanted to save a minute or two of test time. If “time” is what drives our clinical protocols, how about we do a one-word list? That’s even faster! Before I get too carried away, let’s go back to our researcher and see what he has to say about this.
Hornsby: Well, Gus, your example is spot on. Researchers have indeed looked at this. You were talking about the Auditec recording of the NU-6 lists, but these lists were around for a while before the Auditec recording, and there are a couple other recordings that have been used clinically. One of these was from Bill Rintelmann. I’d like to talk about some data that I pulled from a series of studies by Rintelmann et al. (1974), looking at the reliability of the NU-6 materials from his recordings. One of the things he examined was the use of 50-word lists versus half-word lists for three different groups of individuals: those with normal hearing, young individuals with hearing loss, and elderly individuals with hearing loss. The data I have was using Lists 2 and 3. Performance was pretty much the same when you compared List 2 and List 3 using 50 words. The lists were equivalent; that’s how they are designed.
However, relative to our discussion here, Rintelmann and colleagues (1974) compared the first 25 words of each list to the second 25 words. For the elderly hearing-impaired group, the mean difference from the first 25 and the second 25 was 16 percentage points, so that means that some people had even more of a difference. This trend was true across all groups, but it was especially large for the elderly hearing-impaired group—probably because their overall performance was worse and therefore, the difficulty of individual words was more of a factor.
As you stated earlier Gus, this is a serious problem if one would ever resort to using half lists. The test is designed for 50 items and normed for 50 items. If you do anything other than that, you are not sure that the lists that you are using are going to be equivalent and you cannot be sure about the reliability of your test results.
Mueller: There is another problem associated with only using 25 words. Your sample is smaller.
Hornsby: Yeah, I was just getting to that. We know that variability is based on a couple of things—we just pointed out how word difficulty can impact variability. Another factor that can affect variability is the simple statistical characteristics of the speech tests. I’m not a statistician, but I can give you some information from people who are much better versed in statistics than I am. We know, based on Thornton and Raffin (1978), that the number of test items that are used can affect variability; that is, whether you are using 25 or 50 items. What of course we really want to know is what the patient’s true speech understanding ability is? If I tested him a million times, and I averaged all these scores, would the performance be 50%, 70%, 85%?
When we do clinical word recognition testing, therefore, we are really not recording someone’s true recognition ability. We are obtaining an estimate of what that recognition ability is, and when we test them a second time, we’ll obtain another estimate. If we do it enough, and use enough words, we get a pretty good idea of what that recognition ability is, but there still is some variability. How much variability will depend on the number of items, the baseline ability and whether or not the lists that we are using are equivalent.
The Thornton and Raffin (1978) paper is an oldie, but a goodie. These authors showed that variability in speech recognition testing can be described statistically. They showed that variability increases, as I was saying before, in a very systematic way, depending on your score. If I test you 100 times, it’s going to be really unlikely that you are going to get a score of, say, 20%, if your real understanding ability is near 100%. Now you might get a score of 92% or 98%, but it’s very unlikely to get 50% or 20%. However, if your true score is 50%, then the variability is going to be greater. The standard deviation for 50 items is about 7%, and for 25 items it is about 10%. That’s a 40% increase in variability just by cutting that list in half. We are going to come back to this topic later, but this is just to highlight that variability depends in part on the total number of items that you present.
The take home message is if the tests are designed and validated using 50 items for scoring, then you really do need to use 50 items if you want to be confident in the reliability when you are comparing your scores over time or between ears. If you change your protocol, you are going to be reducing both the reliability and the validity of your test results. It’s just not worth it to save a couple minutes of test time.
Mueller: Thank you Ben, and you are right, we are going to visit our friends Aaron Thornton and Mike Raffin a little later, and talk about their binomial model. Relating to test items, I know some researchers like Arthur Boothroyd have advocated the use of phoneme scoring, which for the CVC NU-6 words would mean that you would triple your items. But I don’t know about data on word difficulty, list equivalency and how that would be balanced from one half list to another? That research may have been done, but I don’t recall hearing about it.
Hornsby: As far as I know, the NU-6 test is not normed on phoneme scoring, so just because you scored it by phonemes doesn’t mean that the list would be equivalent via phoneme scoring; the lists are equivalent by the word scoring method.
Maximizing Testing Efficiency
Mueller: As Benjamin Franklin said, “Time is money.” What I sometimes hear, and probably rightfully so: “It’s easy for you university types to talk, but out here in the trenches we don’t have time to do things the ‘preferred way.’ We have to take shortcuts.”
I spent the first 25 years of my audiology career in the trenches, so I do understand that. For most of those years, it was my job to determine how much time should be allotted on the schedule for different types of patient visits. There are two different ways to approach this. One method is: You have to see X number of patients every hour—do whatever you can in that time. A more sensible approach would be: What do we have to do to follow best practice, and how long does it take to do that—that will be the time allotted for each patient. To me then, if you want save time, whether you’re doing speech testing, balance function evaluations or fitting hearing aids, it boils down to two things:
- Can I cut corners but still obtain a test outcome that is valid and reliable?
- Am I providing services to my patients that are consistent with what they are paying for, and are professionally responsible?
Another consideration to carefully consider is just how much time really is being saved when accuracy is potentially jeopardized. Getting back to our previous discussion of using a ½ list: It takes on average 3 minutes to conduct a 50-word recorded NU-6 list for one ear, 6 minutes for both ears. So using a ½ list would save you only 3 minutes for each patient. Dr. Hornsby, I know you have been looking at the research, and I think you might have some ideas where we can speed things up a little bit with our speech testing.
Hornsby: Fortunately, people have been actively studying our test efficiency, as if what we are doing isn’t time efficient and effective, then it really shouldn’t be common practice in the clinic.
One of these projects relates to some research alluded to earlier. Raymond Hurley and Janet Sells (2003) worked on developing a protocol that would allow us to abbreviate the number of test items that are used for word recognition measures. The goal was to determine if you could develop, essentially, a screening protocol that would allow you to quickly identify whether or not you have a patient in your test booth that has very good word recognition (94% or better). For the person with poorer word recognition, we would want to be very careful in our assessment of those individuals to make sure we have a good estimate of their true word recognition ability.
The quick answer to their question was yes, we can do this. We can separate good word recognition ability from the others (worse than 94%) by using the most difficult words of the list (see Figure 1). If someone correctly identifies, as Gus pointed out earlier, the 10 most difficult words, then as we start presenting easier words, they are very likely to get those correct as well, so we can stop testing.
What these researchers asked was: “What’s the protocol that we want to use to identify the people who need the entire 50-word list?” The assumption is if they are doing poorly, let’s say only 50% correct, we want to be confident that their true score really is only 50%, and therefore we want to use a full word list. On the other hand, if somebody is near 100%, whether their “true score” is 96%, 98% or 100%, it doesn’t matter, as it’s not going to alter our counseling or treatment plan. To develop this protocol, Hurley and Sells (2003) measured word recognition using the Auditec recordings of the 50-word lists. There are four forms for this. They recorded not only the patient’s word recognition score, but also which words they missed, so they could develop a percentage of misses for each word, or what the word error rate was. Then they sorted the words based on their difficulty to create the ordered-by-difficulty lists (See Figure 1 for List 1 example).
With those ordered-by-difficulty lists, they then re-scored performance for each patient to evaluate if they had used the ten most difficult words, could they predict who was going to score better than 94% on a 50-word list. I hope this will make a little more sense as I walk through it. They reordered the words from most difficult to least difficult. The 25 most difficult words with the error rates are shown in Figure 3. Note that the error rate for the word death was 66%. In other words, more than half of the people tested missed that word. If we simply look at the ten most difficult, we see that the error rate drops from 66% to 42% for the word pool. For the 25th word, hash, the error rate was 29%. The easiest word of the entire 50-word list was somewhat surprising. Only 4.5% of the people missed the word love.
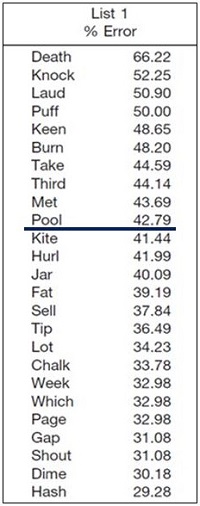
Figure 3. Top 25 most difficult words from NU-6 List 1, in order of error rate (adapted from Hurley & Sells, 2003).
Mueller: Sorry to interrupt, Ben, but you’re saying that if we look at the 50 words from List 1, the easiest was “love” and the most difficult was “death?” Do you think we need to call in Dr. Phil to help us analyze that finding?
Hornsby: Yes, a rather intriguing outcome. Which one of those two words do you think people would rather talk about or hear about? Obviously, there was a big difference in terms of recognition.
Following the collection of these data, the authors conducted a Clinical Decision Analysis, an offshoot of signal detection theory, to determine the effectiveness of using a screening test. They had two screening tests: a 10-word list and a 25-word list. For the 10-word version, their rule for identifying people who did very well was, “Did the patient miss only one word or no words on the first 10 (most difficult) words?” If you get all 10 correct, or only miss one word, you pass that screening test. If you miss more than one, you fail that screening test. That means that they have identified this individual in just 10 words, and hence, know that they should test more. If the patient’s true performance really was better than or equal to 96%, and that patient missed more than one on the first 10 words, that means he failed the sub-list, but that would be a false alarm. This is illustrated on the Figure below.
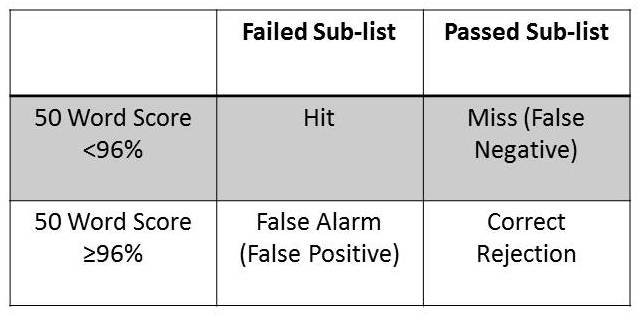
Figure 4. Clinical Decision Analysis used by Hurley and Sells (2003) to determine effectiveness of word recognition screening tests.
The authors went through this process with over 400 people. They found what they called a series positive protocol to be very efficient and effective for identifying people whose performance would probably be worse than 96%. The screening rules that they found to be very effective were as follows:
- Present the 10 most difficult words first. If the patient misses zero or only one word, you can stop testing for that ear. It’s very unlikely that that person is going to have a 50-word score that’s less than 96%.
- If the patient missed more than one word, then go ahead and present the next 15. In that case, out of those first 25 words, if they missed 3 or fewer, then you can stop testing.
- If the patient misses more than 3 words for the first 25, then you would present the full 50-word lists.
Out of those 400 subjects, this screening approach identified all of the people who scored poorer than 96%. That’s a 100% hit rate—it doesn’t get any more effective than that. So you can save time and conduct a valid and reliable test by using materials that are ordered by difficulty. How much time can it save you? Out of those 400 people that they tested, 25% of these patients would not have needed the full 50-word list. Hurley and Sells estimate that the time savings could be over an hour for 10 patients.
Mueller: I know a lot of clinics already use this screening approach, but it might be new to some of our readers—a good thing to remind people about. And, it goes to show that it is possible to save time without jeopardizing accuracy. I know you mentioned this Ben, but these data and this procedure only work if you use the Auditec recording of the NU-6. Who knows what the most difficult words are if you use—dare I say—live voice.
Hornsby: Good point. The list that is ordered by difficulty that was used in this particular study is titled: Auditec NU-6 Ordered by Difficulty (Version II). There is a different ordered-by-difficulty available from Auditec, so we don’t want to get them confused.
Mueller: The beauty of using this version of the NU-6 is that there is no downside—so not sure why you’d want to use anything different. The worst case is that you present all 50 words, which is what you would have done anyway. And of course, you would want to obtain this recording with the shortened-interval, which I’m pretty sure is going to come up again before we finish. So on to a new topic.
When Is A Difference Really a Difference?
Mueller: Let’s go back to my earlier ENT clinic story where we were talking about a 16% difference in word recognition between ears. Do we really think people should be referred for MRIs based on a 16% difference? Probably not, but when is a difference really a difference? For those of you who are practicing clinicians, there are many times when you want to know if one ear is really better than the other for speech recognition. Sometimes the patient will ask: “Do I understand better in one ear than the other?” It would be nice to give them an honest answer, which does require a little thought about statistics. We certainly know that a few percentage points is not significant, but what is? In a written report, some audiologists will state that the word recognition is better for the right ear or the left ear. Well, how much difference do you need before you can use the word better? Even when fitting hearing aids, there are times when the patient only wants to purchase one instrument, and they have a symmetrical hearing loss, but their word recognition scores are different—or are they? If they truly are different, you might decide to fit the ear with the best performance. But certainly, if you are going to make that decision, you want to make sure that the apparent difference is not due to the unreliability of the material or method you are using.
So, Dr. Hornsby, I’m thinking that you have some guidance for us regarding when a difference really is a difference.
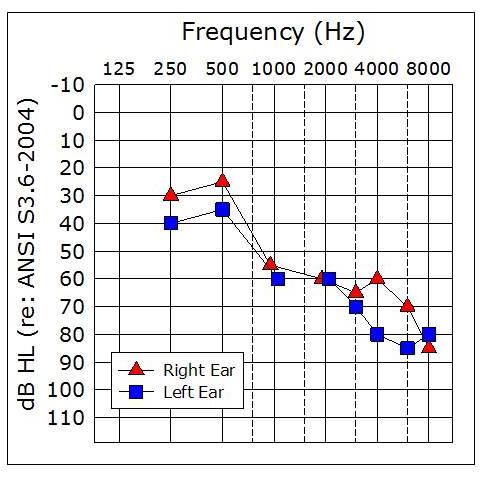
Figure 5. Sample patient’s audiogram. This patient had word recognition scores of 68% in the right ear and 44% in the left ear.
Hornsby: Right you are. I brought along a sample patient that I’ll be using for the next example (Figure 5). As you can see, the thresholds in his two ears are fairly symmetrical. We obtained his word recognition scores at a fixed intensity of 75 dB HL, using a 50-word list. We obtained scores of 68% in the right ear and 44% for the left. So, before we can write a report or counsel the patient, the question we’ve got to ask is, “Are these two word recognition scores different?” It turns out, based on some of the work that we talked about in terms of test-retest variability, there are statistical ways that we can determine that.
Mueller: It sounds to me like we are going to re-visit the binomial model we mentioned earlier?
Hornsby: Yes, it’s the classic paper from 1978 by Thornton and Raffin. It may not be thrilling reading, but it turned out to be very important for clinicians when interpreting speech recognition scores. We already discussed how variability depends on how many test items you are using as well as on the true recognition ability, since scores in the middle of the distribution are more variable. We can, using statistical models, predict what the variability of performance would be around your true score.
Thornton and Raffin (1978) used that information to develop what they called critical difference tables. You can copy these tables from their journal article and keep them next to your audiometer or at your desk so that you can easily refer to them. The tables show what’s referred to as the 95% critical differences for a given score, based on a certain number of test items. The table in the article shows the scores ranging from 0 to 100% based on the total number of test items. You identify the score your patient gets and the number of items you used to see the critical differences.
Mueller: To make it even easier for our readers, Ben, I have adapted the Thornton and Raffin table in Figure 6. We’ve already discussed why you wouldn’t ever use a 25-word list, but Thornton and Raffin did include critical differences for 25 words, so I put those on this chart—thought you might want to use these values to emphasize our teaching point.
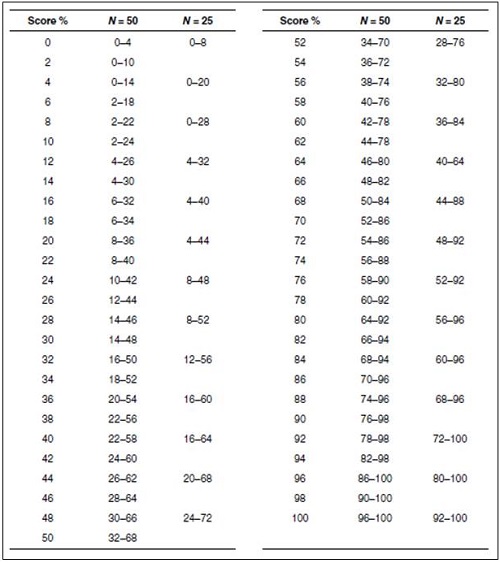
Figure 6. The critical differences (.05 level of confidence) adapted from Thornton and Raffin (1978) that can be used for comparison of two word recognition scores. Select one of the two scores and find this score on the vertical columns which go from 0 to 100%. To the right of each one of these values there is a range of scores for either a 25-word or 50-word list. If the second test score falls within this range, this score is not different from the first score.
Hornsby: Thanks Gus, I’ll do exactly that. Our hypothetical patient had a score of 44% correct for the left ear. Based on test-retest variability and the statistical models used to develop this chart, we can then ask, what’s the range of scores that we might reasonably expect if our true recognition ability is really 44%? In this case, if we had used a 25-word list, we would look at the column corresponding to 25 words. Notice that the range of scores that we might expect would range anywhere from 20% correct to 68% correct (see Figure 6). What that means is that if performance was poorer than 20% or greater than 68% correct, there would only be a 5% chance that that could be the same as our 44% score. Recall that the performance for the right ear was 68% correct. While it is tempting to assume that 44% is different from 68%, if we had used 25 items, we would say to our patient, or in a report to a referral source that those two scores, 44% and 68%, were the same.
As we increase the number of test items, our variability is reduced. If we used a 50-item list, the critical difference range is smaller—it shrinks by 12% (see Figure 6). The critical difference range for a 50-word list for a score of 44% is from 26% to 62%. So now, by using 50 words, we are confident that our patient’s word recognition scores really are different—the score of the opposite ear, 68%, falls outside of the critical range. They are not similar just due to chance.
This 1978 paper by Thornton and Raffin was replicated back in 2007 by Edward Carney and Robert Schlauch at the University of Minnesota. They used computer simulations to try to increase the number of times that they could test the model to make sure that their results were accurate. It turns out they did a pretty good job back in 1978. Carney and Schlauch found only small differences, but they did publish another table that’s available for use to compare clinical results.
Mueller: You use an example of comparing one ear to another, but this same table could be used to determine if a patient’s speech understanding has changed over time—assuming that you’re using the same equivalent words lists over time. Or as I mentioned earlier, there even are applications in the fitting of hearing aids. You talked about reliability and the relationship to the number of items, Ben, and I know students often are tempted to think that a 6% or 10% difference in word recognition really matters. This reminds me of some calculations that Jerry Studebaker did years ago.
Hornsby: You’re referring to what he published in the 1982 Vanderbilt Hearing Aid Report?
Mueller: Exactly. His point was that you can make speech testing more reliable by increasing the number of words. Here’s some numbers from his article to think about. If you would like a 6% difference to be significant at the .05 level of confidence, you’d need to deliver 376 words; for 10% to be significant, only 135 words. And, if you are the fastidious type, and would like a 2% difference to mean something, you’re looking at 3381 words. So I think we’ll have to live with the larger ranges we see on the Thornton and Raffin table.
Hornsby: Yes, I don’t think we’ll find equivalent word lists with 3381 words—or a patient willing to spend four hours doing the testing!
Interpret the Findings Carefully
Mueller: Getting back to our standard 50-word NU-6 word lists, another thing we often want to know when interpreting our scores is whether or not the scores are “normal” for our patient. That is, is the score what we might expect for someone with that degree of hearing loss?
Hornsby: Let’s go back to our sample patient (See Figure 5). Recall that we had a score of 68% for the right ear. Is that a reasonable score for PB-Max for someone with this loss? What about 44% for the left ear? Essentially we are asking, “Did we get the presentation level right to pick PB-Max? As we discussed earlier, we know that PB-Max or most any word recognition score is going to be influenced by the level that we chose.

Figure 7. Sample audiogram with LTASS (speech banana, shaded yellow portion is audible, the purple portion is not) that roughly corresponds to a 75 dB HL presentation level.
In Figure 7, I have grossly plotted the LTASS or speech banana on our audiogram to correspond to a presentation level of about 75 dB HL. We see that a good bit of the high frequencies of speech are inaudible for our patient. We might expect that performance would be a little lower than optimum, but if we turn the level up say to 100-105 dB, certainly less speech is inaudible now, so we might expect performances to be higher. This is illustrated on Figure 8. That being said, we still need to know if 68% and 44% are really PB-Max values for this patient? Is there a way that we can estimate that without having to test at a lot of intensity levels?
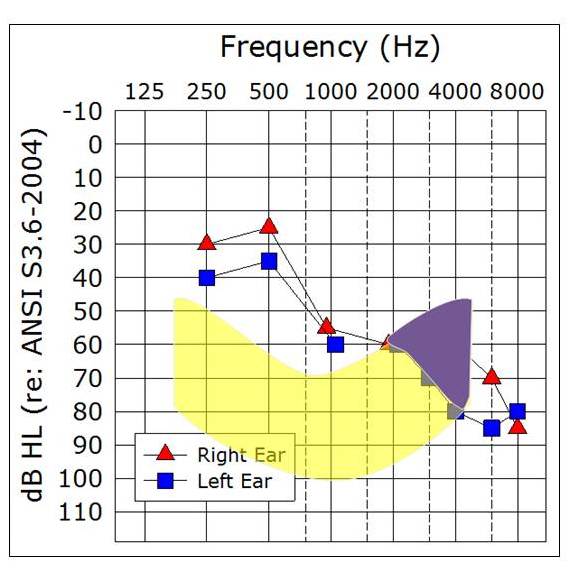
Figure 8. Sample audiogram with LTASS (speech banana, shaded yellow portion is audible, the purple portion is not) that roughly corresponds to a 100-105 dB HL presentation level.
In fact, there is. Judy Dubno’s group at Medical University of South Carolina has looked at this, and they have developed what she calls confidence limits for maximum scorers (Dubno, Lee, Klein, Matthews & Lam, 1995). They looked to define or identify the lower limit of what’s normal for word recognition scores, given a certain degree of hearing loss. The idea is that if the score you obtained at the single level you tested is poorer than what they are predicting, then it’s likely abnormally low. You may want to test at another level, to see if indeed you were close to PB-Max.
Mueller: It seems like the results also could be poorer than they predict simply because your patient may have other factors influencing their score, such as an auditory processing or cognitive deficit? You might already have PB-Max.
Hornsby: Good point, but I think the thought here is that you first assure that you are close to PB-Max before you reach those conclusions. To collect the data they needed, they measured word recognition (Auditec NU-6 recordings) at a couple of different presentation levels to define each patient’s PB-Max. This testing was conducted with 400 adults with confirmed cochlear hearing losses. They used the actual data and some simulations to come up with the lower limit.
There was a wide range of performance, so they calculated a 95% confidence interval, meaning that only 5% of all the scores fall outside or below this confidence interval. If you measure word recognition for a given PTA, using the Auditec NU-6 recording of course, and your subject’s performance is poorer than their cut-off, then there’s only a 5% chance that you have reached their PB-Max score. Most of the time, performance is much better than that. Of course, as Gus brought up, there could be some other factor driving down their word recognition, but first you need to assure you have their PB-Max. They created a nice little table in their article for making this determination (Dubno et al., 1995). Gus—did you bring along this chart too?
Mueller: Well, sort of. The Dubno data is sometimes a little difficult to track down, but as you know Ben, Linda Thibodeau helped us out here big time. I know you’re familiar with her chart so I’ll let you explain it. I have it posted for our readers (Figure 9).
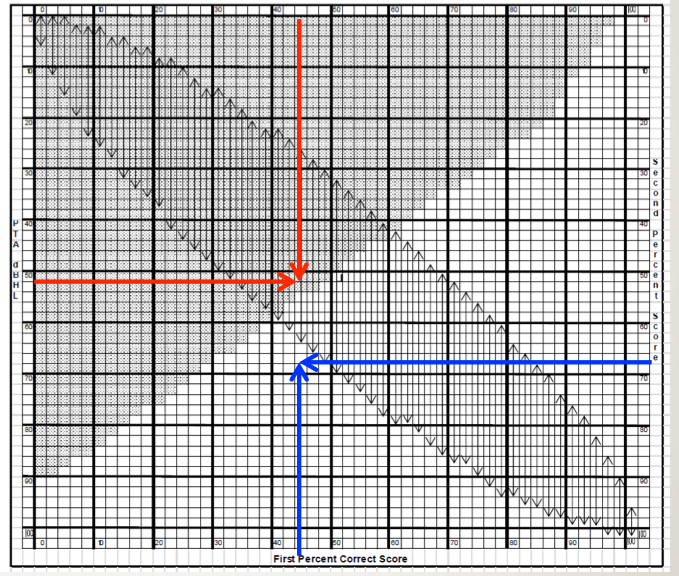
Figure 9. SPRINT chart for 50-word recorded Auditec lists. To examine the 95% confidence limit for PB-Max on the Auditec NU#6 list, determine the intersection of the word recognition score on the top x-axis, and the patient’s PTA on the left y-axis. If the intersection of these two values falls within the shaded area, the word recognition score is considered disproportionately low (based on the work of Dubno et al., 1995). This is illustrated with the red arrows. To examine the 95% critical difference for two word recognition scores, determine the intersection of the first (bottom x-axis) and the second (right y-axis) score. If the intersection point falls within one of the vertical arrows, the two scores are not significantly different from each other (based on work of Thornton and Raffin, 1978). This is illustrated with the blue arrows. The SPRINT chart is reproduced here with permission from the developer, Linda Thibodeau, PhD (Thibodeau, 2007).
Hornsby: Linda Thibodeau (2007) constructed a very helpful chart which she terms the SPRINT (Figure 10)—That’s for SPeech Recognition INTerpretation, and it includes not only the Dubno et al. (1995) data that we were just talking about, but also the critical differences from Thornton and Raffin (1978). The SPRINT chart we are showing here is for a 50-word list.
The 95% confidence limits for our PB-Max based on Dubno’s (1995) work is the shaded region. That is, any time a score falls within that shaded region, it is considered disproportionality low. The left axis of this chart shows the pure-tone averages (500, 1000 and 2000 Hz) from zero at the top and ascending as we go down. Let’s go back to our sample patient again. I calculated that his pure-tone average for the left ear is 51.7 dB. Next, we go to the top of the chart and locate this patient’s word recognition score, which was 44%. We then determine where this score intersects with the pure tone average on the chart. I have drawn two red arrows to show this point. Notice that the intersection falls in the shaded region. Hence, that would mean that his score of 44% is disproportionately low for this degree of hearing loss, and we should test again at another level.
So just for fun, let’s use the Thornton and Raffin critical difference aspect of the SPRINT chart. This should turn out the same as it did before, but it will give you some practice. The X-axis on the bottom of the SPRINT is a %-correct score and the Y-axis on the right of the chart is the second %-correct score. It is for comparing two different scores, whether that is between right and left ears, or from one test session to the next.
For this comparison, disregard the shaded area, and focus on the vertical arrows. They are showing the 95% critical difference range for each score. We know our patient’s left ear score was 44%. Is that different from the right ear score of 68%? Well, we would then look to see if the intersection of the two different scores falls between the arrows; for this patient does it fall between 26% and 62%? On the SPRINT chart we have drawn a blue arrow up from 44% on the bottom x-axis, and a second blue arrow from the right of the SPRINT chart at 68% for the second ear score. Note that the intersection does not fall within the vertical arrows on the chart, so we would conclude that these two scores are indeed different.
It’s a single chart, which makes it pretty easy once you get used to using it, to help interpret the results of your word recognition testing.
Mueller: I don’t know about you Ben, but I don’t leave home without it! For those of you who would like to start using this chart tomorrow, Dr. Thibodeau graciously allowed us to use it as a handout for this article - you can download the SPRINT chart for 50-word lists here.
Going back to your review of all this, Ben, it seems it would be nearly impossible to write an accurate report or even counsel a patient without having these data right in front of you.
Hornsby: You really can’t.
Stop The Madness
Mueller: I think we’ve made it to our last category. The main thing we want to talk about here is the persistent bad habit that some audiologists have of using live voice when conducting word recognition testing. I’m reminded of an article that Ross Roeser and Jackie Clark (2008) wrote about this topic. The subtitle of their article was Stop the Madness. That’s a good way to sum it up.
People have some interesting reasons for adopting this habit. Here is one I heard recently: “I know I should use recorded speech material, but my docs won’t buy me a CD player.” You can get a nice CD player for about $100. Best Practice versus Poor Practice for $100? Seems like a no-brainer to me.
Unfortunately, this doesn’t seem to be an isolated case. Rachel Finan, an AuD student from the University of Northern Colorado recently completed a Capstone, in which she surveyed popular clinical procedures. The respondents were a large group of American Academy of Audiology members with even distribution across the U.S.; about 1/3 of the respondents worked in an audiology private practice, with the majority of the others working in ENT offices, hospitals and clinics. The disturbing finding was that the majority (58%) use live voice testing for speech recognition testing rather than recorded. You have to wonder if they also whistle rather than use calibrated signals for pure-tone testing?
It reminds me of a quote from Leo Tolstoy: “Wrong does not cease to be wrong because the majority share in it.” Ben, initially we weren’t even planning on talking about this issue, but with those survey findings, I guess we better.
Hornsby: I know, those survey results are hard to explain. The evidence is very clear against the use of monitored live voice. You have to wonder why someone would intentionally deviate from best practice and run the risk of making an incorrect diagnosis. I have heard audiologists say that live voice is somewhat easier and more flexible, and saves time. The question is how much time, and what’s the cost for saving that time? We have some data to tell us how much time you will actually save.
Mendel and Owen looked at this in 2011 in International Journal of Audiology. They asked: “How long does it take to complete word recognition testing using monitored live voice or recorded materials?” They measured word recognition using the Auditec CD recordings with the 50-word lists that are not ordered by difficulty. As some of you might know, Auditec has recordings with two different delays between each word. One of them is four seconds long, which is pretty long, and the other one is only a two-and-a-half-second delay between words. So really, there are three conditions: monitored live voice, Auditec recording with a four-second delay and Auditec recording with a two-and-a-half-second delay. They had two groups of people, young normal hearing, which we don’t test very often, and older adults with hearing loss.
Here is what they found. How much faster was it doing it monitored live voice versus recorded? The answer is less than a minute for a 50-item list. Keep in mind that testing couldn’t be any shorter than the track length of the CD, because that’s how long it takes to run through all the words. But for even the two-and-a-half-second inter-stimulus interval, audiologists aren’t having to pause it any longer for their patients than that. For the hearing-impaired group, on average it was only 49 seconds longer to conduct the testing using recorded material rather than live voice. And yes, that was for the standard 50-word list. So how much time are you saving? Not all that much, really.
Mueller: As I recall, the 49 seconds was for one ear, so we’d be looking at about two minutes extra time/patient. Two minutes extra to have valid and reliable test results for your patient – I hope that is an easy decision for audiologists. And also, Ben, many audiologists today are using computer based audiometers, where the speed of word recognition testing is controlled by a mouse click. The moment the patient answers you click on the next word. I don’t know of data on this, but logic would suggest that this type of recorded testing would go at about the same rate as live voice.
Hornsby: We talk about the time factor, but the real issue is the validity and reliability of the test. The easiest way to sum this up is to remember: The words are not the test; the test is the recorded version. If you are using monitored live voice, you are a test of one. In fact, you are not even really a test of one, because every time you say the words you say them differently. Because of that, your reliability is significantly reduced. In fact, it would be pretty difficult to interpret the results of your testing.
We have known all this for decades. Back in the 1980’s, Fred Bess (1983) pulled from the literature PI functions from recorded NU-6 materials. These were commercially available recordings, but they were recorded by different people. Here is a good example of why the talker matters. For one of the NU-6 recordings, the one recorded by Tom Tillman (1966; the original NU-6 recording), when the test was delivered at 8 dB SL the average score was 75% correct. But for a different recording of the very same NU-6 list (Beattie, 1977) the average score was 15% for 8 dB SL—a 60% difference between talkers for the same words.
Mueller: And this was for professionally recorded material. The difference could be even bigger for two different live voices.
Hornsby: I’ll say it again—THE WORDS ARE NOT THE TEST! To interpret your results, you are going to have to use recorded stimuli. Let’s go back to our hypothetical patient with scores of 68% in one ear and 44% in the other ear. How do we interpret if these findings are different? Well, as we described, we use statistical models that assume that when you give the test, it’s the same every time. That’s just not true via monitored live voice, so you can’t use Thornton and Raffin’s (1978) table. You also can’t use Judy Dubno's (1995) confidence limits if you are doing monitored live voice. If you can’t use either of these, it’s really not clear if you can interpret your test results at all. So you don’t know the answers to such important clinical questions as: Has the patient’s word recognition changed? Are the results from the left and right ear different from each other? Are they normal? That’s not a very good position to be in as a clinician.
Mueller: And you didn’t mention it, but you also cannot use the 10-word screening test, as you have no idea what the ten most difficult words are for your voice for that given day. Ironic huh—audiologists use live voice testing to save time, yet the use of live voice prevents them from using the very procedure that will save them the most time.
So Ben, you’ve nicely reviewed the literature, the background data and clinical procedures related to clinical speech testing, which is a big part of what most audiologists do.
Summary
To close things out, let's briefly summarize what we’ve concluded.
Things To Do
- Always use recorded materials. We recommend the shortened-interval Auditec recording of the NU-6.
- Choose a presentation level to maximize audibility without causing loudness discomfort. That’s either the UCL-minus-5 or the 2000 Hz-SL method.
- Use the Thornton and Raffin data to determine when a difference really is a difference (included on Thibodeau’s SPRINT chart).
- Use the Judy Dubno data to determine when findings are “normal” (included on Thibodeau’s SPRINT chart).
- Use the Ordered-By-Difficulty version of the Auditec version of the NU-6, and employ the 10-Word and 25-Word screenings.
Things Not To Do
- Live-voice testing.
- Use a presentation level of SRT+30 or SRT+40.
- Make random guesses regarding when two scores are different from each other.
- Conduct one-half list per ear testing (unless using the Ordered-By-Difficulty screening).
Question & Answer
Mueller: Before we get to the questions from our audience, I have one for you, Ben. Earlier I mentioned that with many of today’s computer-based audiometers, audiologists are using audio files rather than the actual Auditec CD. Can we assume that all the research conducted with the CD version—inter-list equivalency, etc. also applies to this technology?
Hornsby: This is something that we’ve thought about. There has been some concern about whether or not audio files that are saved on the computer or on your MP3 player might be okay to use.
If you are a CD person, you may still have your entertainment center filled with CDs, or maybe a milk crate or two from your college days. You can now fit all of those CDs on your little three-inch iPod. So how do you take all that information and squeeze it down into the iPod? You use what’s called a file compression algorithm. It essentially throws away information. That might be okay for listening to music, but it doesn’t sound very good to throw away information when we are doing clinical testing.
We had a doctoral student here at Vanderbilt, Jodi Rokuson (2012), who looked at that in her Capstone. There are many different file compression algorithms available. Some compress the original file a lot and some not very much. We went ahead and picked the one that was going to compress it a lot. It’s called advanced audio coding (AAC) compression at 64 KB per second. That’s going to save you quite a bit of file room. We figured that if we used that one and we didn’t see anything, then other compression systems that do much less in terms of degradation would be very unlikely to produce an effect.
We tested the compressed version in the clinic on over 160 ears. People were tested using one list of the original Auditec recording and then a second list using the compressed version. File compression algorithms are designed to not degrade the material. They should be perceptually indistinguishable from the original. In fact, that’s what we saw. There was not any difference between scores when tested with the original CD and the compressed version. We know that computer generation of stimuli is going to be more and more common. MP3 players are portable. You can put your files on an MP3 player and feel confident that the compressed versions do not degrade performance relative to the original.
Mueller: Good to know. Let’s get to questions from participants.
If you are using a high-intensity level for word recognition, what do you recommend using for masking in the contralateral ear?
Hornsby: Yes, you would apply masking routinely during word recognition testing. I know some audiometers and protocols are set up to automatically to deliver 30 dB below the presentation level, and it tracks that when you change the presentation level. That will work, unless there is a big conductive loss in the non-test ear. But if you have a 30 dB difference between ears on a cochlear pathology, you are going to be safe. Crossover and cross-hearing apply to speech signals as well as to pure tone signals, so you would want to apply masking just as you would when appropriate during pure-tone testing.
How can we apply this to a pediatric population? I’m not quite sure that a child would let me proceed if I try to find their UCL first. Is there a SPRINT chart for the PBK?
Hornsby: I agree with you. Pediatrics is a special population and it’s not my area of expertise. There is not a SPRINT chart for pediatrics. There are still some research needs in this area. For a child, we want to keep in mind audibility. If we want to know their optimal performance, if that’s the reason we are doing the test, then we are going to want to try to get that level as comfortably high as we can. Maybe you are not going to find UCL, but it’s not uncommon at all during the training and orienting of the child to talk to them. You can get an estimate of the level that you are going to present sounds, at least at a comfortable level, and then bump it up a little bit. If you have pure-tone thresholds you can use the 2000 Hz-SL method that we discussed.
We use the CASPA routinely for whole word and phonemic scoring and usually report both scores. If only one is reported, should it be the whole word score?
Hornsby: That’s a good question. In actuality, I might feel more confident with the phoneme scoring, but there is not a standard for that. In terms of clinical reporting, what’s going to matter is if you are only doing ten words and you are basing your score on those ten words is your reliability. The reliability is going to be reduced. So, phoneme scoring will improve that reliability, and that maybe the one you want to compare in terms of test-retest.
Have any studies been completed evaluating the effectiveness of phonemic awareness and speech sound recognition training programs, in turn improving overall word recognition?
Hornsby: It’s not an area that I personally have conducted research. I will say it’s a very active area of research and some of the studies have showed some positive effects. One of the real issues is finding a training program where the results generalize to other materials. That is something that’s not a consistent finding. It is still an area where we are learning. I think there is some potential benefit in training programs. I think making strong claims about magnitude of improvement now would be premature. There is ongoing work looking at larger-scale clinical trials and longitudinal studies. At least in my opinion, the conclusion now is something that we are going to have to wait on just a little bit.
What presentation level is optimal for individuals with rising or low-frequency hearing losses? Are there any studies that you know of?
Hornsby: No is the quick answer to that. There are not any that I know of. That group is just not as common, so it’s not the group that’s normally focused on in the research. I would think we could use the same information from those studies to suggest that audibility is going to be important for those groups as well. So if we present at a high level, we are going to ensure audibility, at least for the low-frequency sounds. Now, one issue with steeply reverse-slope hearing losses is that those individuals sometimes have cochlear dead regions. Dead regions are a bit more common in those upward-sloping configurations than in the more common gradually downward-sloping high-frequency loss, and high levels for them can certainly degrade performance.
Can I use the SPRINT chart with the W-22 word list?
Hornsby: You can use a portion of the SPRINT chart. The Thornton and Raffin (1978) data are statistical models. They apply to any reliable speech test, so if the W-22 lists are equivalent, then you can use Thornton and Raffin’s data for those. In contrast, Judy Dubno's (1995) data are based on using the NU-6 materials, and the PI functions for the NU-6 and the W-22 are not the same. While they are not vastly different, they are not the same. You would be less confident in using the W-22s when using Dubno’s data than you would the Thornton and Raffin critical differences.
Is there any research or input on the number of words to be used in presentation levels in aided and unaided sound field-testing?
Hornsby: Here you are getting into hearing aid testing, and there again, I think this comes down to what’s the goal of the testing that you are doing. If your goal is to obtain an estimate of word recognition ability for conversational speech, then it would make the most sense to test at conversational speech levels. That is going to be somewhere between 40 and 50 dB HL on the dial, depending on how your soundfield speakers are calibrated. I think that would be a reasonable.
At the beginning, we talked about two or three different reasonable goals or purposes for doing word recognition testing. Those wouldn’t necessarily apply to a hearing aid fitting. Sometimes you are simply doing the testing to demonstrate to the patient that aided is better than unaided. If the patient is reporting difficulty understanding soft speech, and most of them are, then you might want to conduct unaided versus aided for a softer-than-average presentation level.
As far as the number of words to use, if you really want to do this type of testing and conclude that the patient is indeed doing better, then all the Thornton and Raffin (1978) rules that we discussed earlier would apply for sound field as well as headphones. That can be a real challenge, however, to try to demonstrate aided and unaided benefit, right? Remember those critical difference ranges can be quite large. Soft speech is likely going to be more beneficial for demonstrating unaided and aided benefits.
References
Beattie, R. C., Edgerton, B. J., & Svihovec, D. V. (1977). A comparison of the Auditec of St. Louis cassette recordings of NU-6 and CID W-22 on a normal-hearing population. Journal of Speech and Hearing Disorders, 42, 60-64.
Bess, F. (1983). Clinical assessment of speech recognition. In D. F. Konkle & W.F. Rintelmann (Eds.), Principles of speech audiometry (pp. 127-201). Baltimore: University Park Press.
Boothroyd, A. (2008). CasperSent: A program for computer-assisted speech perception testing and training at the sentence level. Journal of the Academy of Rehabilitative Audiology,41, 31-52.
Carney, E., & Schlauch, R. S. (2007). Critical difference table for word recognition testing derived using computer simulation. Journal of Speech, Language, and Hearing Research, 50, 1203-1209.
Dubno, J. R., Lee, F. S., Klein, A. J., Matthews, L. J., & Lam, C. F. (1995). Confidence limits for maximum word-recognition scores. Journal of Speech and Hearing Research, 38(2), 490-502.
Finan, R. (2012). Survey of audiometric practices in the United States (Unpublished Capstone project). University of Northern Colorado, Greely, CO.
Guthrie, L. A., & Mackersie, C. L. (2009). A comparison of presentation levels to maximize word recognition scores. Journal of the American Academy of Audiology, 20(6), 381- 390.
Hawkins, D. B., Prosek, R. A., & Walden, B. E. (1987). Binaural loudness summation in the hearing impaired. Journal of Speech and Hearing Research, 30, 37-43.
Hurley, R. & Sells, J. (2003). An abbreviated word recognition protocol based on item difficulty. Ear and Hearing, 24(2), 111-118.
Kamm, C. A., Morgan, D. E., & Dirks, D. D. (1983). Accuracy of adaptive procedure estimates of PB-max level. Journal of Speech, Language, and Hearing Research, 48, 202-209.
Mendel, L. & Owen, S. (2011). A study of recorded versus live voice word recognition. International Journal of Audiology, 50(10), 688-693.
Mueller, H.G. (2011). How loud is too loud? Using loudness discomfort measures for hearing aid fitting and verification, part 1. AudiologyOnline, Article 825. Retrieved from www.audiologyonline.com.
Rintelmann, W. F., Schumaier, D. R., Jetty, A. J., Burchfield, S. B., Beasley, D. S., Mosher, N. A.,...Penley, E. D. (1974). Six experiments on speech discrimination utilizing CNC monosyllabic words (Northwestern University Auditory Test No. 6). Journal of Auditory Research, 2(Suppl), 1-30.
Roeser, R. J., & Clark, J. L. (2008). Live voice speech recognition audiometry - Stop the madness. Audiology Today, 20(1), 32-33.
Rokuson, J. (2012). Testing word recognition on patients in an audiology clinic using uncompressed and compressed audio coding formats. (Unpublished Capstone project). Department of Hearing and Speech Sciences, Vanderbilt University, Nashville, TN.
Studebaker, G. (1982). Hearing aid selection: An overview. In G. Studebaker and F. Bess (Eds.), The Vanderbilt hearing aid report (pp. 147-160). Upper Darby, PA: Monographs in Contemporary Audiology.
Thibodeau, L. M. (2007). Speech audiometry. In R. Roeser, M. Valente, and H. Hosford-Dunn (Eds.), Audiology: Diagnostics (pp. 288-313). New York: Thieme Medical Publishers.
Thornton, A., & Raffin, M. (1978). Speech-discrimination scores modeled as a binomial variable. Journal of Speech and Hearing Research, 21(3), 507-518.
Tillman, T. W., & Carhart, R. (1966). An expanded test for speech discrimination utilizing CNC monosyllabic words, Northwestern University Auditory Test No. 6. Technical Report No. SAM-TR-66-55(June), 1-12.
Cite this content as:
Hornsby, B., & Mueller, H.G. (2013, July). Monosyllabic word testing: Five simple steps to improve accuracy and efficiency. AudiologyOnline, Article #11978. Retrieved from https://www.audiologyonline.com/