
Editor's note: This is an edited transcript of the Siemens eLearning Seminar recorded on 7/10/09. The author, Gus Mueller, added additional comments 5/01/11.
To register to view the recorded course, click here. The handout for the recorded course contains several tables and figures that may be helpful for readers of this text course. The handout can be downloaded here (PDF).
How loud is too loud? There are many ways to measure loudness both in the psychoacoustic sense and physically related to the output of a hearing aid. But before we dive into this discussion, it might be helpful to review a few terms. I like to use the term loudness discomfort levels (LDLs), and will use that term throughout this article. I know that some of you prefer the term uncomfortable loudness levels (UCLs), but personally, I have never quite figured out what the C stands for because "uncomfortable" is all one word, but it seems to be a popular term. Others prefer threshold of discomfort (TDs). Regardless of what you call it, LDLs, UCLs, and TDs all refer to the same thing. Something a little different, however, are ULCs, which stands for the upper level of comfort. This is the level right before uncomfortable.
Author's Comment: It is debatable whether the output of a hearing aid should set at the LDL itself, or just below it, which would be the ULC (which is more or less #6, "Loud But Okay" on the Cox Contour Test). We talk about all this in Part 2 of this series.
Other terms relating to amplification are the MPO, or maximum power output, which is, of course, the maximum output of the hearing aid. You may see OSPL90 on the manufacturer specification sheet, which refers to the MPO of a hearing aid in the 2-cc coupler. We also then can look at the maximum output of the hearing aid in the real ear, which usually is called the RESR, or the real-ear saturation response. The RESR is basically like an OSPL90, except that you are measuring it in the real ear. In general, the output in the real ear will be bigger than that of the coupler, as the residual volume of the ear canal with a hearing aid/earmold in place is nearly always less than 2-cc (think "Boyles Law").
Here are some other terms that you'll really like. RETSPL is the reference equivalent threshold in sound pressure level, and these are the values from the ANSI standard that are used to calibrate your audiometer. With this reference, however, you can take an LDL (in dBHL), convert it to a 2-cc value, and now you can talk the same language as the fitting software- very convenient. Next is the RECD, or real-ear-to-coupler difference. This is a probe-mic measurement used to go back and forth between the earcanal and the 2-cc coupler. It commonly is used to predict the maximum output in the ear canal. This measurement is especially useful for young children where you will not be doing an RESR, and because the child's ear canal is much smaller than the coupler, the real ear maximum output will be much higher. The RECD can tell you if the output from the hearing aid is safe for an individual child.
The last is the REDD, or real-ear dial difference. This is actually that value that you obtain when you add the RETSPL and the RECD together, although it easily can be measured directly. Basically, the REDD is the difference between what is on your audiometric dial and the SPL in the ear canal. This is what is used with probe-microphone measures to convert HL LDLs to ear-canal-SPL LDLs. This is what often shows up on your probe-microphone or test box system, and is a direct representation of your targets for the RESR measure—more on that later.
Author's Comments: Not all prescriptive methods or probe-mic systems use the same REDD values. What this means is that you can enter the same HL LDL values into different software and the resulting values in ear canal SPL will be different.
And of course, we can't talk about loudness and loudness measures without also talking about compression. We have two basic types: AGCi (automatic gain control input) and AGCo (automatic gain control output). Normally, AGCi input compression is not used to control output, but if you have your kneepoint low enough and your compression ratio high enough, you actually will be controlling output with your AGCi whether you are trying to or not. The compression system typically used for controlling output, however, is AGCo. In fact, the primary purpose of AGCo is for controlling output, so that often will be our primary setting when we are looking at controlling maximum output.
AGCo was introduced in 1940 or so, and until very recently, hearing aids were all single-channel AGCo. That is, even if the hearing aid had 16, 20 or more channels of AGCi, there was still only one channel of AGCo. In recent years, however, some companies have introduced multi-channel AGCo, which now allows the loudness to grow in different channels independently, therefore increasing head room so other bands or frequencies do not have to be attenuated just because the signal reaches the kneepoint in one particular channel. Depending on the technology and product, you may have this capability in anywhere from 8 to 16 channels.
What Do We Know?
Best practice guidelines have indicated for years that we should be conducting frequency-specific pre-fitting LDLs and aided loudness measures, yet few audiologists or hearing instrument specialists (HIS) routinely perform these tests. Why not? It's my belief that no audiologist, no matter how experienced or talented, can consistently predict a patient's LDL based on the audiogram or know if the output of the hearing aid output is correct without further evaluation. We do know that getting the loudness right is incredibly important when you are fitting hearing aids, both from comfort and safety standpoints. If maximum output is too loud, which is the most common mistake, the person will tend to turn down the gain to make loud sounds okay. For example, if you overshot a patient's LDL by 10 dB, they probably will simply turn gain down by 10 dB. What happens when the gain is turned down? Quite simply, reduced audibility and likely a reaction from the patient that the hearing aids do not work very well. What do they do then? They stop using their hearing aids and put them in the drawer or return them after a month of non-use. The number one reason why hearing aids are returned for credit is because the patient perceives that he or she receives no benefit. Today, because of the popularity of the mini-BTE, many patients do not have a means of adjusting the gain and output. It is even more important that the output is set correctly for these patients.
So now you might say, "Well, okay, I'll fix that. I'll just fit everybody with an incredibly low MPO, and then they won't complain that sounds are too loud." Well, that is not very good either. This creates the complaint that sounds are muffled, things do not sound normal, speech may even sound distorted, and this could actually even restrict intelligibility when the compression is set too aggressively. Compression is not inherently a bad thing, but in general it does not make speech intelligibility better except for allowing for more appropriate audibility for a large range of inputs.
Well, then we might ask, "How good are we at accounting for loud sounds and setting the MPO correctly?" Unfortunately, survey's say not very good. We know that for most patients it would be relatively easy to program the AGCo and wide dynamic range compression (WDRC) to ensure that loud sounds are not too loud, yet based on several MarkeTrak surveys, including the most recent, only slightly more than half of hearing aid users are satisfied. We know from other surveys that most professionals fitting hearing aids are not performing frequency-specific LDLs (e.g., Mueller, 2003). We can only assume that dispensers are not conducting these tests because they do not see value. Logically, I draw the conclusion that if people fitting hearing aids would simply put a little more effort into getting the output right, hearing aid users would be happier.
Author's Comments: In 2003 we conducted a survey of people fitting hearing aids and found that 61% routinely conduct pre-fitting LDL measures. However, only 27% of this group use frequency-specific test signals (speech is by far the most popular, despite the fact that published Best Practice Guidelines say frequency specific). If we do the math (27% of 61%) we find that only 16% of dispensers are conducting pre-fitting LDL testing according to established protocols. That of course was 2003. Are things different now? Probably not.
Why Do Dispensers Neglect LDL Measurements?
There could be several reasons why pre-fitting loudness measures are not "popular." A few guesses (based on conversations over cocktail tables) include that the dispenser might believe that everybody's LDL is the same. They might think that LDL measures just are not reliable or valid. They might think that you can predict a patient's LDLs from their hearing loss, or that what one does in the clinic does not relate to the real world? Maybe they think the manufacturer's software will do it for them. Maybe they believe they simply do not have enough time. Let's look at these issues one by one.
Not enough time: For many years I worked in large clinics where five or more audiologists saw six to eight patients/day for hearing aid fittings. LDL testing was conducted for everyone. With only a few exceptions, I know you can conduct frequency-specific LDLs for two frequencies, for both ears in about five to ten minutes. Consider that if a pair of hearing aids typically sells for several thousand dollars, spending five to ten minutes does not seem like a time issue, especially if you assume that you will consequently make the fitting better.
Reliability: In 1996, a young Todd Ricketts was working at Iowa with Ruth Bentler on this subject matter, and they reported test-retest reliability of 3 to 4 dB on LDLs when using the Contour Test (Cox, Alexander, Taylor, & Gray, 1997). David Hawkins and colleagues (1987) also conducted a study and concluded differences of only 3 to 4 dB over a four-day period. Catherine Palmer and George Lindley (1998) performed a study with a two-week time interval in between test and retest also using the Cox Contour anchors, just as I will suggest you do. They found test-retest to be 2.6 dB. These test-retest findings are the same as for pure-tone audiometry, which we regard as quite a reliable measure (Mueller and Hornsby, 2002). While these were all controlled studies, the Palmer and Lindley (1998) research had the patients leave in between test session and then come back later for the re-test. This is the same scenario in which we find ourselves when testing real-world patients. As we typically test in 5-dB steps, it is reasonable to consider an average 2 to 3 dB test-retest as sufficiently reliable. Of course, there will be a group of elderly patients who do not have the cognitive skills to understand the task, or they might need more coaching to complete the task, which may result in a higher test-retest variability. But for the majority of routine patients, these measures are valid and reliable. Two misconceptions down, four to go.
Is everyone the same? Isn't everyone's LDL about the same? If this were true, it would be a convincing argument to forgo the measures. We do know that LDLs do not vary as much as hearing loss does because of the way loudness works in relation to the inner and outer hair cells. For example, if your hearing worsens by 50 dB, your LDL does not go up by 50 dB also (unless it's a conductive loss). There is not a one-to-one relationship. One highly-referenced study by Elberling (1999) estimated that about 70 percent of patients would "satisfied" if they were fit within ± 5 dB with an output based on average loudness growth (using their hearing loss as the predictor). For the remaining 30 percent, which is still fairly high, 13 percent would be "sound sensitive" and 17 percent would be "sound addicts." To elaborate on this study, we can look at Bentler and Cooley (2001) who tell us that the "not satisfied" group is probably a lot larger than 30 percent. They documented on over 500 ears with confirmed hearing losses, that only about 30% of patients fell witin +/- 5 dB of average. If you look at their subjects that had a 50 dB hearing loss (a common loss when fitting hearing aids), LDLs ranged from 72 to 132 dB—that's a 60 dB range! Clearly, not everyone's LDL is the same. It also suggests to me that predicting might be difficult, and that's our next topic.
Predicting LDLs from the hearing loss: So if LDLs are not the same for everyone, can I not just predict it based on the patient's hearing loss and save a lot of time? Aside from pointing out that five to ten minutes of testing will not break your appointment schedule, think about all the different configurations and degrees of hearing loss that exist. While we know that there is a relationship between LDL and hearing loss (it's very unlikely that a person with a 40 dB loss will have the same LDLs as a person with an 80 dB loss), how would you even go about predicting LDLs for all kinds of hearing loss in between? Sure, it would nice if we could predict, and sometimes we have to for the people who have poor cognitive function and cannot perform the test, but does it really work?
The method that is the most widely recognized for predicting hearing aid output is NAL-NL1 (Byrne, Dillon, Ching, Katsch, & Keidser, 2001). Those of you who have used the NAL prescriptive method, at least in its truest form, recognize that you are not able to input a patient's LDLs even if you have the values. When the NL1 was being developed, NAL researchers tested their predictive method and concluded that the predicted output was in the "acceptable" range for 63 percent of their subjects (Storey, Dillon, Yeeng, and Wigney, 1998).
While 63 percent is not bad, the question would be, "Can we do better?" And what's interesting from the Bentler and Cooley (2001) data that I mentioned earlier, is that they revealed that only 30 percent of the data points fell within ± 5 dB of average, meaning that if you figure that you cannot make a mistake larger than 5 dB, you are going to have 70 percent of your population fitted incorrectly.
Author's Comments: It's somewhat debatable what is an "acceptable" fitting for the output. Personally, I like to have the maximum output sitting just below the LDL across frequencies. If it's 10-15 dB below the LDL, I wouldn't consider that "acceptable," as I'm unnecessarily taking away some headroom that the patient might like (and need). This "under fitting" of output actually happens fairly often with the default first-fit algorithm from several manufactures, as low WDRC kneepoints are employed (i.e., the WDRC is limiting the output rather than the AGCo). Will the patient complain that the maximum output is too low? Maybe not.
Clinic versus real world: There are some pretty compelling reasons why you might think the clinical testing of LDL has little relevance to the real world. First off, in the clinic you use pure-tone signals, which we know do not occur meaningfully in the real world. The clinic is a much more sterile environment. When patients are in the clinic they tend to be on their best behavior, and they often know what the right answer should be to one of our questions. Noises in the real world can be annoying because of their spectral content or emotional associations. For example, when someone from your home team scores a touchdown or hits a home run, how loud would the cheer have to be before it becomes uncomfortable? In Denver at Mile High Stadium (Go Broncos) it was measured at 128 dB SPL, which set a Guinness world record. But this kind of elation, although loud, probably didn't bother anyone there, because of the connotation that goes with it. On the other hand, how loud do fingernails on a chalkboard have to be before they are considered uncomfortable?
These are obviously two extremes, but you can imagine there are many sounds that take on a meaning and those meanings can relate to how somebody judges them. It also has to do with mood. When I graduated from high school I had a 1962 Chevy Impala. While this may be shocking to some of you, in college I stayed out a little late at night and when I would drive home in my swanky two-door hardtop, I would have the radio on pretty loud, but it certainly did not exceed my "uncomfortable level." The next day, however, when I got in and started the car, that radio sounded like the #8 rating on the Cox Contour chart—the Chart only goes to #7! The point here is that mood can have a big influence on LDLs.
Author's Comments: It's important to keep the "mood issue" in mind when conducting LDL testing and setting the MPO of hearing aids. A prime example is the Ménière's patient. Often these patients are battling nausea and vertigo, which would put most anyone in a bad mood. Have you ever seen a Ménière's patient with high LDLs?
One well-controlled study which compared clinic testing to real-world loudness judgments was conducted by Munro & Patel (1998), who enlisted 20 subjects who were previously fit with monaural amplification. The hearing aids were government issue, and all had similar programming and MPO. These researchers measured frequency-specific LDLs and then corrected using the patient's RECD so that they would know what the specific output would be in each person's ear. Although the MPO of the hearing aids was the same, because the RECDs were different, and because the subject's LDLs differed significantly, the real-ear MPO exceeded the LDL of 12 subjects and fell below the LDL of 8 subjects by as much as 17 dB. The subjects then used the hearing aids in the real world and completed a questionnaire. The results showed that 83 percent of the people whose output exceeded their LDL stated that sounds were too loud. Only 12 percent of the people whose output fell below their LDL had this complaint. This tells me that clinical tests are pretty good predictors of real-world outcomes.
Another study on this topic, published in JAAA (Shi, Doherty, Kordas, & Pellegrino, 2007) fit individuals according to two different test protocols. The primary difference was that in Protocol B the output was adjusted according to their LDLs, whereas in Protocol A it was not. They then sent the subjects out in the real world for three months, and had them return for a follow-up visit to complete outcome measures for benefit and satisfaction. They found that those who had received Protocol B with LDL information and maybe some subsequent tweaking of the output had the same Abbreviated Profile of Hearing Aid Benefit (APHAB) (Cox & Alexander, 1995) scores as those who did not; so it did not change benefit according to the APHAB. What they did find, however, was that on the Satisfaction of Amplification in Daily Life questionnaire (SADL) (Cox & Alexander, 1999) that they had a more positive score in the area of "negative features" including feedback and uncomfortable sounds. For me, the most interesting part of this study was that they also kept track of the average required adjustments per person based on user's comments. Protocol A people with no LDL adjustments requested 2.5 adjustments, and Protocol B people only 1.5. If you think of this different as "unscheduled visits to your office." the difference can be significant. It's reasonable to believe that if they were fitted correctly to begin with, there is less likelihood that they would request a change, which all factors in to how you use your clinic time. So, it seems to me that there indeed is a relationship between clinical measures and real-world hearing aid use.
Author's Comments: In the past couple years Sergei Kochkin has published several articles relating test protocols to hearing aid satisfaction, part of the MarkeTrak VIII findings. Relating to our discussion above, one thing he examined was the relationship between repeat visits and satisfaction. He also reports on the effect loudness testing has on hearing aid satisfaction. Good reading—check it out at www.betterhearing.org
Let the software get it right: Some people just assume that the manufacturer magically knows how to get the output right for every fitting and every patient. Consider the following scenario. You have just been hired to write the software code for setting the AGCo kneepoint for Siemens. They are paying big bucks. Your company's top customer is ordering hearing aids for her mother, and she will take her business elsewhere if you mess up. Her mother's hearing loss at 2,000 Hz is 50 dB HL. At what 2-cc coupler value will you set the AGCo kneepoint? That is your task. Don't mess up or you are history!
I will give you a clue. Basically, according to the Bentler and Cooley data we discussed earlier, you will set it somewhere between 72 and 132. You might as well go with average and just hope you get lucky, because that is about all a hearing aid manufacturer can do, too. They use the same data and research that we are using- they do not have any special data or inside knowledge about your patient. What are the chances you are going to be right if you just guess? Well, if you look at some studies, maybe 60 percent. If you look at other studies maybe no more than 30 percent.
Another issue related to using this approach is "Would to software-selected-MPO differ from manufacturer to manufacturer? We looked at that a couple years back when we compared the MPO in premier products from the six leading companies (Mueller, Bentler, & Wu, 2008). To observe potential differences we entered at 50 dB loss for all frequencies, and did not enter an LDL. What we found was that at 2000 Hz, the range of output varies by about 20 dB. I don't know who is right, but they cannot all be right, so depending on what manufacturer you pick, you might have a greater chance of being right or wrong. Again, the fact remains that it is very difficult to be consistently right when you are predicting from pure-tone thresholds only.
Questions Answered
Now that we have clearly established the reasons to conduct LDLs, and why the reasons not to do this measure are mostly unfounded, maybe a few of you are excited to get started doing LDL testing with your Monday morning patient. If so, you probably have some questions about the practical aspects of doing this testing:
Question No. 1: When do I do the testing?
This is a common question. From personal experience, I would recommend conducting LDL testing the first time the patient is in the booth and hooked up to the transducers. Even if you think that you may not be fitting hearing aids to this patient, it is much easier to complete the testing when you have the patient in the booth. As you know, what takes up time is getting the patient from the waiting room to the booth, getting them hooked up, participating in idle conversation, etc. Once you have the LDLs, you can keep them in the record. If the patient does not come back for six months or a year, the LDLs are not going to change unless the hearing thresholds change significantly.
Question No. 2: What stimuli do I use?
This is an easy one. You want to have frequency-specific information, so use pulsed pure tones. Speech LDLs are of little use—you need numbers you can use to set the AGCo kneepoints. Some people like using narrowband noise, which is fine assuming that it truly is narrow.
Question No. 3: What psychophysical procedure do I use?
This goes back to hearing science class 101. Remember the method of limits and the method of adjustment? What works the best for LDLs is using an ascending method. It does matter what method you use, but again, all the recent research employs an ascending method. Five-dB steps are fine unless the patient has a small dynamic range, in which case you would want to use 2-dB steps. You want to start around the patient's MCL (your best guess, don't take the time to try to measure it) and increase intensity in 5-dB steps using an ascending method until the patient indicates the sound is uncomfortably loud. Drop back down to MCL again and do another run. Two or three runs should give you a reliable "uncomfortably loud" measure.
Question No. 4: How do I define the point of "uncomfortable?"
This is important and is certainly something you will talk about in your instructions. The important thing is to use loudness anchors. You cannot simply ask them to raise a hand when it is uncomfortable, they cannot tolerate it, or it hurts. You must give the patient a point of reference by which to judge what they are hearing. Figure 1 is the Loudness Chart from the Cox Contour Test (Cox, et al., 1997), which by far are the most common anchors used in the clinic.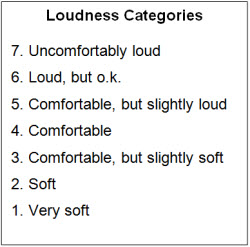
Figure 1. Loudness descriptors from the Contour Test (Cox et al., 1997) for use when measuring LDLs.
When I have made up this chart for my use, I have added to this list a Category number "0." This was not originally published as part of the test, but does have some clinical utility for the purposes of LDL measurement. Number 0 would be "Cannot Hear." It can eliminate confusion for the patient if they are not sure what they are supposed to be hearing, because it gives them an answer. Rather than asking you if they are supposed to be hearing something, while you are talking on your cell phone, they simply can reply, "Zero . . . zero . . ., zero . . ., zero," until you actually begin the test.
Author's Comments: If you were listening to the audio version of this, it hopefully would be obvious that this is a little joke. But adding the "0 Category" really is helpful.
This chart should be large and easy to read and should be handed to the patient so they are holding it when you do the testing. Put it on a large laminated poster board display and during the test they simply call out the number as you work your way up to a seven.
Author's Comments: Calling out the number is common, but I actually like to have the patient point to the number. You can tell a lot about the true judgment by how they point. If they do a drawn out, hesitant point to #7, it's probably not a #7. Up the signal by 5 dB and try again.
Question No. 5: What instructions do I use?
The instructions can definitely change your outcome Because we are using the Cox Contour Test loudness descriptors (Cox, et al., 1997), it is only logical that we use the corresponding instructions that go along with this research-based test. You can obtain these instructions for yourself by going to Dr. Robyn Cox's lab Web page at https://www.memphis.edu/csd/harl/index.htm Once you get to the site, simply click on Clinical Applications which takes you to a page filled with outcome measures and fitting applications. Dr. Cox has kindly supplied several free downloads, including the Contour Test. Under the Contour Test, you are able to download the instructions, loudness categories, and even a little score sheet to keep track of the person's LDL. I recommend that you read the instructions verbatim to the patient and explain important parts if the patient does not understand. The instructions reiterate that an uncomfortable sound is something they would never listen to, no matter what mood they might be in.
Author's Comments: I've always used the Cox Contour instructions and they work well. At the end of Robyn's instructions, however, I've added the following: "It's okay to skip a category and it's okay to repeat a category." After doing the testing with a few hundred patients I found that some thought they had to go up a category every time I raised the intensity by 5 dB. Others, with a small dynamic range, following a #5 rating would feel compelled to give me a #6 for the next signal, even when it truly was a #7. The extra instructions seemed to help for these cases.
Question No. 6: What frequencies should I test?
Because LDLs usually do not change much across frequencies, there is no need to obtain results for a lot of different frequencies, just a couple of important ones. The most important frequency to test, especially for a single channel AGCo, is around the region of the real-ear peak of the hearing aid output: usually 2000-3000 Hz. For a relatively flat loss, LDLs at 500 and 3000 Hz should work just fine. You may even check with your favorite manufacturer to make sure they do not require a specific frequency for their predictive method. You also need to use some common sense, however, and take into account the configuration and degree of hearing loss. For example, you do not need an LDL for a region where there is normal hearing, so save your time. Also, in a downward sloping configuration, if there is a significant high-frequency hearing loss (e.g.,>80 dB) where you are avoiding amplification, then there is no reason to do an LDL at a frequency that you will not amplify anyway. Use your common sense to obtain the LDLs at the most critical and useable frequencies. When in doubt, test at 2K, as it almost always is bad enough, yet good enough for amplification.
What Do I Do With These Numbers?
Now that you have obtained the LDLs, you might wonder what you are supposed to do with them. The clinical applications will be covered in detail in Part 2 of this How Loud is Too Loud series. However, it would be helpful to give you a sneak peek for a head start.
The good news is that you do not even need a paper and pencil to do this. It is basically second-grade math. Let's say your patient has an LDL of 100 dB at 2000Hz (that's HL talk). Because you are a forward-thinking person, you correctly decide that it would be a good idea to limit sounds at that level. Good thinking. You might save the sale. You know that you will accomplish this with the AGCo, so you should know that the AGCo needs to be set at or below 100 dB. Remember, we want the resulting sound to be closer to a #6 than to #7 on the loudness chart, so you might set it about 3 dB below the LDL of 100 dB. But you quickly remember that you are comparing 2-cc coupler measures (how output is displayed in the software) with dB HL (LDLs) and realize you must convert the HL values to a 2-cc value so you can talk to the software.
This is incredibly easy because all you need to do is add the RETSPL. Remember the RETSPL from the beginning of this paper? It is the reference equivalent threshold in SPL. This means that each frequency has an equivalent SPL value that you add to the HL value to arrive at an SPL reference that is used in the test box or 2-cc coupler. This is transducer specific, so be sure you have the correct values. I'm going to assume that you are using insert earphones, so we'll use those RETSPL values. Let's say that you are using an HA-1 coupler, and the reference value at 2000Hz is 2.5 dB. We can round that up to 3 dB and add that to the LDL of 100 dB, to equal 103 dB in 2-cc coupler terms. Now you can go into the fitting software, set the AGCo kneepoint around 101, and you are home free. It is that incredibly easy. Now, if you are using a multichannel AGCo hearing aid, you'll have to do that same math at a couple other frequencies.
More to Come!
Now that you know why LDLs are so important and how to do them, it is only fair that we acknowledge how to use them properly when it comes to fitting and verification. Part 2 of this series will cover the clinical application of LDLs in hearing aid fittings. These topics will specifically include setting the kneepoint and how these measured LDLs interact with the fitting software . . . or not. There are some companies where the LDLs do not interact at all. We will talk about when you use AGCo versus AGCi and how to troubleshoot when the person still has a loudness problem. And lastly, we will talk about verification measures in the clinic after the fitting. This will, of course, include probe-mic measures, speech mapping targets, and open versus closed fittings.
To view Part 2, please register here.
References
Bentler, R.A., & Cooley, L.J. (2001). An examination of several characteristics that affect the prediction of OSPL90 in hearing aids. Ear and Hearing, 22(1), 58-64.
Byrne, D., Dillon, H., Ching, T., Katsch, R., & Keidser, G. (2001). NAL-NL1 procedure for fitting non-linear hearing aids: characteristics and comparisons with other procedures. Journal of the American Academy of Audiology, 12(1), 37-51.
Cox, R.M., & Alexander, G.C. (1999). Measuring satisfaction with amplification in daily life: the SADL scale. Ear and Hearing, 20(4), 306-320.
Cox, R.M., & Alexander, G.C. (1995). The abbreviated profile of hearing aid benefit. Ear and Hearing, 16(2), 176-186.
Cox, R.M., Alexander, G.C., Taylor, I.M., & Gray, G.A. (1997). The contour test of loudness perception. Ear and Hearing, 18(5), 388-400.
Elberling, C. (1999). Loudness scaling revisited. Journal of the American Academy of Audiology, 10(5), 248-260.
Hawkins, D., Walden, B.E., Montgomery, A., & Prosek, R.A. (1987). Description and validation of an LDL procedure designed to select SSPL90. Ear and Hearing, 8(3), 162-169.
Mueller, H. G. & Hornsby, B. (2002). Selection and verification of maximum output. In M. Valente (Ed.), Strategies for selecting and verifying hearing aid fittings (2nd edition). New York: Thieme Medical Publishers, Inc.
Mueller, H.G. (2003). Fitting test protocols are more honored in the breach than in the observance. The Hearing Journal, 56(10), 19-26.
Mueller, H.G., Bentler, R.A., & Wu, Y. (2008). Prescribing maximum hearing aid output: Differences among manufacturers found. The Hearing Journal, 61(3), 30-36.
Palmer, C.V., & Lindley, G.C. (1998). Reliability of the Contour Test in a population of adults with hearing loss. Journal of the American Academy of Audiology, 9(3), 209-215.
Ricketts, T., & Bentler, R. (1996). The effect of test signal type and bandwidth on the categorical scaling of loudness. The Journal of the Acoustical Society of America, 99(4 Pt 1), 2281-2287.
Shi, L.F., Doherty, K.A., Kordas, T.M., & Pellegrino, J.T. (2007). Short-term and long-term hearing aid benefit and user satisfaction: a comparison between two fitting protocols. Journal of the American Academy of Audiology, 18(6), 482-495.
Storey, L., Dillon, H., Yeend, I., & Wigney, D. (1998). The National Acoustic Laboratories' procedure for selecting the saturation sound pressure level of hearing aids: experimental validation. Ear and Hearing, 19(4), 267-279.
How Loud is Too Loud? Using Loudness Discomfort Level Measures for Hearing Aid Fitting and Verification, Part 1
June 20, 2011
This article is sponsored by Signia.
Continued and its subsidiaries provide professional education authored by qualified Subject Matter Experts for continuing education purposes. These materials are intended for educational purposes and do not constitute medical advice or a substitute for individual clinical judgment. Continued is not a clinical healthcare provider; the licensed professional is solely responsible for ensuring that the application of any techniques or information presented is within their legal scope of practice and jurisdictional requirements.


Related Courses
1
https://www.audiologyonline.com/audiology-ceus/course/auditory-wellness-what-clinicians-need-36608
Auditory Wellness: What Clinicians Need to Know
As most hearing care professionals know, the functional capabilities of individuals with hearing loss are defined by more than the audiogram. Many of these functional capabilities fall under the rubric, auditory wellness. This podcast will be a discussion between Brian Taylor of Signia and his guest, Barbara Weinstein, professor of audiology at City University of New York. They will outline the concept of auditory wellness, how it can be measured clinically and how properly fitted hearing aids have the potential to improve auditory wellness.
auditory
129
USD
Subscription
Unlimited COURSE Access for $129/year
OnlineOnly
AudiologyOnline
www.audiologyonline.com
Auditory Wellness: What Clinicians Need to Know
As most hearing care professionals know, the functional capabilities of individuals with hearing loss are defined by more than the audiogram. Many of these functional capabilities fall under the rubric, auditory wellness. This podcast will be a discussion between Brian Taylor of Signia and his guest, Barbara Weinstein, professor of audiology at City University of New York. They will outline the concept of auditory wellness, how it can be measured clinically and how properly fitted hearing aids have the potential to improve auditory wellness.
36608
Online
PT30M
Auditory Wellness: What Clinicians Need to Know
Presented by Brian Taylor, AuD, Barbara Weinstein, PhD
Course: #36608Level: Intermediate0.5 Hours
AAA/0.05 Intermediate; ACAud inc HAASA/0.5; AHIP/0.5; BAA/0.5; CAA/0.5; Calif. SLPAB/0.5; IACET/0.1; IHS/0.5; Kansas, LTS-S0035/0.5; NZAS/1.0; SAC/0.5
As most hearing care professionals know, the functional capabilities of individuals with hearing loss are defined by more than the audiogram. Many of these functional capabilities fall under the rubric, auditory wellness. This podcast will be a discussion between Brian Taylor of Signia and his guest, Barbara Weinstein, professor of audiology at City University of New York. They will outline the concept of auditory wellness, how it can be measured clinically and how properly fitted hearing aids have the potential to improve auditory wellness.
2
https://www.audiologyonline.com/audiology-ceus/course/understanding-patient-empowerment-along-hearing-37890
Understanding Patient Empowerment Along the Hearing Health Journey
Most clinicians recognize the importance of empowerment in the patient journey, but do they know what it really means for a patient to feel empowered? Find out in this engaging and informative podcast with WSA research scientist, Sarah Gotowiec, PhD, who reviews the five dimensions of patient empowerment and how clinicians can apply her research to empower patients more effectively throughout the patient journey. This recent open access article is the focus of her discussion: https://www.tandfonline.com/doi/full/10.1080/14992027.2021.1915509
auditory
129
USD
Subscription
Unlimited COURSE Access for $129/year
OnlineOnly
AudiologyOnline
www.audiologyonline.com
Understanding Patient Empowerment Along the Hearing Health Journey
Most clinicians recognize the importance of empowerment in the patient journey, but do they know what it really means for a patient to feel empowered? Find out in this engaging and informative podcast with WSA research scientist, Sarah Gotowiec, PhD, who reviews the five dimensions of patient empowerment and how clinicians can apply her research to empower patients more effectively throughout the patient journey. This recent open access article is the focus of her discussion: https://www.tandfonline.com/doi/full/10.1080/14992027.2021.1915509
37890
Online
PT30M
Understanding Patient Empowerment Along the Hearing Health Journey
Presented by Brian Taylor, AuD, Sarah Gotowiec, PhD
Course: #37890Level: Intermediate0.5 Hours
AAA/0.05 Intermediate; ACAud inc HAASA/0.5; AHIP/0.5; ASHA/0.05 Intermediate, Professional; BAA/0.5; CAA/0.5; Calif. SLPAB/0.5; IACET/0.1; IHS/0.5; Kansas, LTS-S0035/0.5; NZAS/1.0; SAC/0.5
Most clinicians recognize the importance of empowerment in the patient journey, but do they know what it really means for a patient to feel empowered? Find out in this engaging and informative podcast with WSA research scientist, Sarah Gotowiec, PhD, who reviews the five dimensions of patient empowerment and how clinicians can apply her research to empower patients more effectively throughout the patient journey. This recent open access article is the focus of her discussion: https://www.tandfonline.com/doi/full/10.1080/14992027.2021.1915509
3
https://www.audiologyonline.com/audiology-ceus/course/wireless-technology-in-hearing-aids-40196
Wireless Technology in Hearing Aids
The use of wireless technologies in hearing aids as increased over the years. This course will examine types of wireless technology commonly used in hearing aids.
auditory, textual, visual
129
USD
Subscription
Unlimited COURSE Access for $129/year
OnlineOnly
AudiologyOnline
www.audiologyonline.com
Wireless Technology in Hearing Aids
The use of wireless technologies in hearing aids as increased over the years. This course will examine types of wireless technology commonly used in hearing aids.
40196
Online
PT30M
Wireless Technology in Hearing Aids
Presented by Eric Branda, PhD, AuD
Course: #40196Level: Intermediate0.5 Hours
AAA/0.05 Intermediate; ACAud inc HAASA/0.5; AHIP/0.5; ASHA/0.05 Intermediate, Professional; BAA/0.5; CAA/0.5; IACET/0.1; IHS/0.5; Kansas, LTS-S0035/0.5; NZAS/1.0; SAC/0.5; TX TDLR, #142/0.5 Manufacturer, X
The use of wireless technologies in hearing aids as increased over the years. This course will examine types of wireless technology commonly used in hearing aids.
4
https://www.audiologyonline.com/audiology-ceus/course/breaking-barriers-empowering-social-connections-40197
Breaking Barriers: Empowering Social Connections in Older Adults with Hearing Loss
Hearing loss of gradual onset in older adults affects social connections. Breaking away from the impairment-driven model of hearing healthcare and focusing on a wellness-driven model, this course describes how hearing loss contributes to social disconnection, and how various empowerment strategies can be used clinically to improve the social and emotional well-being of these individuals.
auditory, textual, visual
129
USD
Subscription
Unlimited COURSE Access for $129/year
OnlineOnly
AudiologyOnline
www.audiologyonline.com
Breaking Barriers: Empowering Social Connections in Older Adults with Hearing Loss
Hearing loss of gradual onset in older adults affects social connections. Breaking away from the impairment-driven model of hearing healthcare and focusing on a wellness-driven model, this course describes how hearing loss contributes to social disconnection, and how various empowerment strategies can be used clinically to improve the social and emotional well-being of these individuals.
40197
Online
PT60M
Breaking Barriers: Empowering Social Connections in Older Adults with Hearing Loss
Presented by Brian Taylor, AuD
Course: #40197Level: Intermediate1 Hour
AAA/0.1 Intermediate; ACAud inc HAASA/1.0; ASHA/0.1 Intermediate, Professional; BAA/1.0; CAA/1.0; Calif. SLPAB/1.0; IACET/0.1; IHS/1.0; Kansas, LTS-S0035/1.0; NZAS/1.0; SAC/1.0; TX TDLR, #142/1.0 Manufacturer, X
Hearing loss of gradual onset in older adults affects social connections. Breaking away from the impairment-driven model of hearing healthcare and focusing on a wellness-driven model, this course describes how hearing loss contributes to social disconnection, and how various empowerment strategies can be used clinically to improve the social and emotional well-being of these individuals.
5
https://www.audiologyonline.com/audiology-ceus/course/signia-expert-hearingaid-fitting-nuggets-37894
Signia Expert Series: Hearing Aid Fitting Nuggets Mined From Recent Research
Each year, over 300 articles are published in professional journals related to the function and fitting of hearing aids. Some are rather esoteric, but others have data that provide unique fitting tips that can be applied on Monday morning! We'll review the key findings of some of this emerging research that hopefully will be useful to you and beneficial for your patients.
auditory, textual, visual
129
USD
Subscription
Unlimited COURSE Access for $129/year
OnlineOnly
AudiologyOnline
www.audiologyonline.com
Signia Expert Series: Hearing Aid Fitting Nuggets Mined From Recent Research
Each year, over 300 articles are published in professional journals related to the function and fitting of hearing aids. Some are rather esoteric, but others have data that provide unique fitting tips that can be applied on Monday morning! We'll review the key findings of some of this emerging research that hopefully will be useful to you and beneficial for your patients.
37894
Online
PT60M
Signia Expert Series: Hearing Aid Fitting Nuggets Mined From Recent Research
Presented by H. Gustav Mueller, PhD
Course: #37894Level: Intermediate1 Hour
AAA/0.1 Intermediate; ACAud inc HAASA/1.0; AHIP/1.0; ASHA/0.1 Intermediate, Professional; BAA/1.0; CAA/1.0; Calif. SLPAB/1.0; IACET/0.1; IHS/1.0; Kansas, LTS-S0035/1.0; NZAS/1.0; SAC/1.0
Each year, over 300 articles are published in professional journals related to the function and fitting of hearing aids. Some are rather esoteric, but others have data that provide unique fitting tips that can be applied on Monday morning! We'll review the key findings of some of this emerging research that hopefully will be useful to you and beneficial for your patients.