 From the Desk of Gus Mueller
The spring of 1990! Good memories for some of us. It didn’t get much better than listening to classic Tom Petty music from his 1989 CD, Full Moon Fever. News from Fort Collins, Colorado was about this guy named Jeff Lebesch, who was brewing a unique Belgium beer in his basement called "Fat Tire"—we hear he did okay with that product! And, if you were reading about audiology, you may have picked up the May 1990 issue of The Hearing Journal, and noticed an article entitled, "Introducing MarkeTrak: A consumer tracking survey of the hearing instrument market." The article was based on data collected by the Hearing Industry Association (HIA) a year or so earlier, published in MarkeTrak I.
We can go back to 1984, however, which was when the HIA published a lengthy report based on a survey of hearing aid owners and hearing-impaired non-owners, which set the tone for many of the MarkeTrak surveys that have followed in the past 40 years. To catch you up on the labeling, the first 8 MarkeTrak reports were designated with roman numerals, (e.g., I, II, III, IV, etc). You’ll see MarkeTrak 9 as either 9 or IX. MarkeTrak 10, was only 10, and the past two reports have been labeled based on the year the report was published, i.e., MarkeTrak 2022 and MarkeTrak 2025. This recent change in labeling is helpful, as it gives us a general timestamp for the data—not everyone can remember that MarkeTrak VII was in 2004.
Joining us this month at 20Q to give us a preview of the findings of MarkeTrak 2025 is Bridget Sobek Dobyan, Executive Director of the Hearing Industries Association (HIA), where she leads the organization’s strategic initiatives and advocacy efforts. Prior to this role, she served as HIA’s Director of Public Policy. Ms. Dobyan has a diverse background in nonprofit leadership, federal and state government affairs, and legislative policy. She previously worked on Capitol Hill as Legislative Director for U.S. Representative Dave Trott of Michigan, advised the Michigan Senate on policy matters, and managed government affairs for a Washington, D.C.-based energy efficiency advocacy organization. She holds a J.D. from Michigan State University College of Law.
Through the years, the MarkeTrak surveys have become the "go-to reference" for most anything we'd like to know about the hearing aid market, the opinions of hearing aid owners or hearing-impaired non-owners. You’ll find that Bridget continues this tradition in her excellent review, providing a glimpse at the new data relating to adoption rates, time lapse for adoption, prescription vs. OTC products, reports of benefit and satisfaction, owners versus non-owners, and much more.
Gus Mueller, PhD
Contributing Editor
Browse the complete collection of 20Q with Gus Mueller CEU articles at www.audiologyonline.com/20Q
20Q: Interpreting the Hearing Health Landscape through MarkeTrak - From Insight to Impact
Learning Outcomes
After reading this article, professionals will be able to:
- Describe emerging trends in hearing aid adoption and consumer decision-making.
- Compare current and historical data to identify changes in hearing healthcare over time.
- Integrate insights to improve the consumer experience.

1. I’m familiar with the surveys, but what is the story behind MarkeTrak?
Let me take you all the way back to 1989, when the Hearing Industries Association (HIA) launched the first U.S.-based population study focused on the hearing aid market. This first MarkeTrak, and the seven that followed, were conducted by mail, before moving to an online format beginning in 2015. Through the decades, MarkeTrak has provided deep insights into the consumer experience, including estimating hearing difficulty and adoption rates, motivating factors in identifying, assessing, and addressing hearing loss, features and factors that are most important when considering technology, and more.
A core part of HIA’s mission is to serve as the trusted voice on hearing healthcare for product innovation, public policy, patient safety, and education. The MarkeTrak surveys, conducted every two to three years, are a vital resource for HIA and its members, with insights anticipated by the hearing health community. While the full report is confidential to HIA members, we are pleased to share high-level findings from the most recent MarkeTrak 2025 survey.
With that, let’s dive into the crux of our conversation - MarkeTrak 2025 (MT2025). MT2025 was conducted by Az Marketing Research, Inc. This survey, fielded in late 2024, reached a representative sample of 16,148 households for a total of 42,982 individuals (Figure 1). Of this total, 2,955 respondents reported hearing difficulty. Of this target population, 1,173 are hearing aid owners and 1,782 are non-owners.
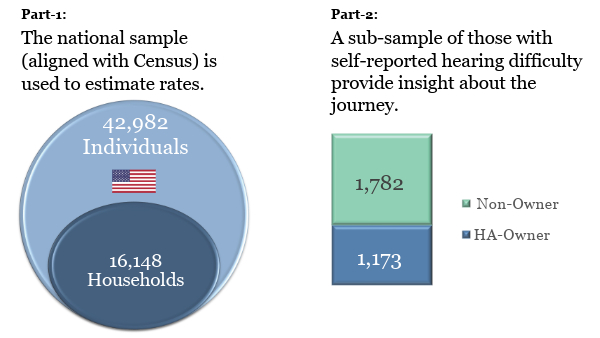
Figure 1. Sampling rate for MarkeTrak 2025 (MarkeTrak, 2025). Click the image for a larger view in a new window.
2. I recall that there was a MarkeTrak survey a few years ago. What’s new in MarkeTrak 2025?
Yes, our last survey was MarkeTrak2022. Looking at our four most recent survey editions, we can see an evolving landscape and consumer demand. For example, starting in 2015, MarkeTrak focused on hearing aids. By 2019, the survey included personal sound amplification products (PSAPs). In 2022, the survey took into account the increase in remote and self-fitting options at the height of the pandemic, expanded insights into implants, and analyzed not only PSAPs but earbuds with hearing improvement features as well. This brings us to 2025, which is the first time the survey has included over-the-counter (OTC) hearing aids, in addition to traditional (or prescription) hearing aids, implants, and other devices including earbuds with hearing improvement features.
3. We have heard a lot about OTC hearing aids the last few years. Do consumers understand the difference between OTC hearing aids and what are now called “prescription” hearing aids?
Great question. This being the first MarkeTrak survey conducted since the OTC hearing aid rule became effective in October 2022, we anticipated the need for revised definitions that are clear and consumer friendly. We conducted an initial test to determine the best terminology and definitions that would most clearly convey the difference between OTC hearing aids and prescription hearing aids, since this is the foundation for later findings in the survey. One example is utilizing the term “traditional hearing aids” instead of “prescription hearing aids” as it resonated more with consumers in the pre-test. This approach, combined with questions that are designed to validate data across multiple points, gave us a clearer picture of OTC users and traditional hearing aid users.
4. Looking at the big picture, have we seen any increase in the hearing aid adoption rate?
According to MarkeTrak, adoption rates have steadily increased since 1997. When looking across all hearing aid categories, adoption has increased from 30.2% in 2015 to 39.1% in 2025 (Figure 2). This number includes traditional hearing aids and OTC devices. When factoring in implants, the 2025 adoption rate jumps to just over 43% in MT2025. Drilling down on these numbers a bit more, we found that slightly more women than men have adopted hearing aids (41% to 39%) and, unsurprisingly, overall adoption rates are highest within the 65-and-up age demographic.
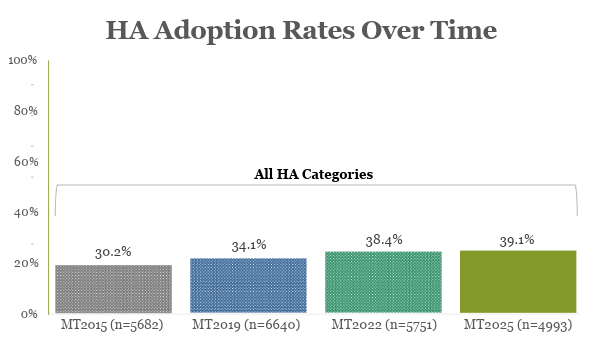
Figure 2. The hearing aid adoption rate for the past four MarkeTrak surveys, showing all hearing aid categories. Click the image for a larger view in a new window.
5. Interesting. I assume that there are some differences between traditional hearing aid users and OTC users?
Yes, there are. To answer this, let’s take a look back to MT2022 and focus in on first-time buyers. The MT2022 data revealed that first-time buyers were relatively consistent across device and channel types. More specifically, those reporting a first-time purchase of any hearing aid came in at 51%, with in-person fitted hearing aid at 51%, remote-fitted hearing aid at 47%, and self-fitting hearing aid at 53%. Personal sound amplification products (PSAPs) were significantly higher with 86% being first-time buyers. As has been hypothesized before, this higher first-time buyer rate for PSAPs may be situational users, such as in background noise environments. If ineffective, PSAP users may move into traditional hearing aids.
In MT2025, the PSAP category has given way to OTC and earbuds with hearing improvement features. So, let’s take a look at the buyer characteristics in each category. At its most basic, overall hearing aid owners do trend older than non-owners and are more likely to be college-educated, retired, and have higher incomes. The highest adoption rates for traditional hearing aids are in the 65 and up age category, while the highest OTC rates are in the 34 and younger demographic. What we are seeing in MT2025 is that OTC owners more closely resemble non-owners, or that these are individuals who may not have otherwise taken steps to address their hearing loss.
Let’s pivot to looking at first-time buyer profiles, an important insight across multiple surveys. More OTC users do tend to be first-time buyers (70% versus 58% of traditional hearing aid owners), owning newer devices. Given that the OTC category is still relatively new, it tracks that OTC hearing aid users have devices that are 1.5 years old compared to traditional hearing aids at approximately 5 years old on average.
A tenet of the OTC category is that the involvement of a licensed professional is not required for purchase, so we do see that OTC users are indeed less likely to get assistance with the evaluation and even fewer are assisted in selecting a device or fitting the device. The good news is that many OTC users are seeing a hearing care professional for an evaluation before making a purchasing decision.
6. Can you give us an update on the time it takes for an individual with hearing loss to take each step before the actual purchase?
We have seen a positive downward trend in past MarkeTrak waves for how many years it takes an individual to take each pathway (such as discussing with a doctor, an ENT, getting an evaluation, visiting a hearing care professional, getting a first hearing aid, and getting a second hearing aid). We saw certain consistencies from MT2022 to MT2025 in the time it takes
In MT2025, we are pleased to share that the positive downward trend continues (Figure 3). It is taking less time for respondents to discuss hearing difficulty with their doctor and getting a professional test, from 4 years in MT2022 down to 3 years in MT2025, after becoming aware of hearing difficulty. Additionally, the time it takes to visit their first HCP is now 3 years (down from 4 years after first becoming aware of hearing difficulty in MT2022). Consistent with the last MarkeTrak wave, it takes a person about 4 years to get their first hearing aid after becoming aware of hearing difficulty.
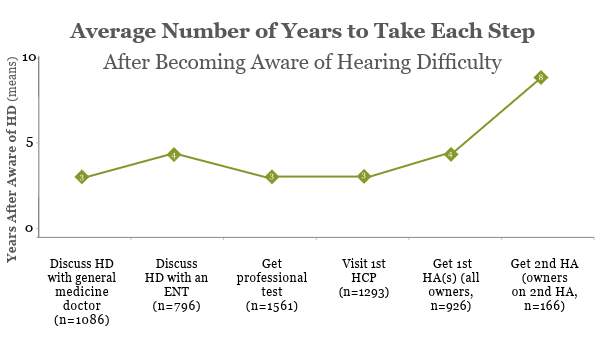
Figure 3. The average number of years to reach each milestone in the hearing aid journey after becoming aware of hearing difficulty. Click the image for a larger view in a new window.
7. That’s great news—patients are moving faster in obtaining hearing aids. Do we know why?
There are several potential motivating factors, so let’s highlight a few of those. In 2019, ahead of the OTC hearing aid rule, HIA launched the Hear Well campaign that included digital resources developed in close collaboration with professional organizations and consumer advocacy groups. The campaign objectives are to correct misperceptions about hearing loss, hearing care, and hearing aids; educate consumers about the value of hearing health and implications of hearing loss; and promote the value and role of the hearing care professional in addressing hearing loss. In 2024, this campaign enjoyed its strongest annual performance to date, with nearly 11 million people reached, over 26 million ads delivered, and more than 1.3 million were driven to find more information at Hearing.org, where resources on hearing care professionals, devices and technology, a hearing screening tool, and how to find a provider are provided.
In addition to the Hear Well campaign, our PSA campaign continues to evolve and thrive. We just wrapped up “Happy Dance 1.0,” which ran for just over 2 years and resulted in earned media value of over $23 million. As the name indicates, the campaign features different people dancing (“doing the happy dance”) while sharing the positive message of the importance of hearing health and seeing a hearing professional. Positive messaging resonates!
Beyond public awareness efforts, we must also discuss the technological innovations and improvements. From MT2025, we know that certain hearing aid features have increased over the last few waves. We also know that more hearing aid owners are utilizing these features or are aware of them. Those features include volume control, program buttons, rechargeability, “linking” to a smartphone or streaming, and downloadable apps for smartphones. When looking at repeat purchasers, the more important features are sound quality, feedback reduction, and wireless connectivity.
8. As we talk about features and what’s important to new and current hearing aid users, what role does cost play?
Another great question! In MT2022, insurance coverage that would cover some or more of the cost of treatment was one of the leading experiences to motivate an individual. That being said, even with total coverage, fewer than one in five respondents would “definitely not” or “probably not” purchase a hearing aid.
In MT2025, among hearing aid owners, the top sources of coverage are Medicare Advantage, insurance or HMO, followed by Military/VA. Nearly one in three non-owners who have received a hearing aid recommendation cite no coverage or not enough coverage as a reason for not taking the next step in their hearing loss journey.
9. You mentioned information and awareness campaigns earlier. Where are consumers getting their information about hearing aids?
A few different places, to say the least. MT2025 shows that those with hearing loss are active on social media, with Facebook and YouTube topping the list. We know that online searches, discussions with medical or hearing care professionals, and input from family, friends, and coworkers all play a role. That’s in addition to traditional advertising, such as radio, television, and newspaper ads, or sources like articles or informational events. Interestingly, more people than you would think go into the experience without searching for or getting information on hearing aids beforehand.
10. Have we seen a change in the overall perception or impact of using hearing aids?
We have. We continue to see differences between hearing aid owners and non-owners with respect to general safety (86% of owners versus 73% of non-owners) and participation in social activities (58% of owners versus 43% of non-owners). Further, hearing aid owners report feeling less physically and mentally exhausted than non-owners. Hearing aid owners also tend to assume more of a connection between hearing loss and conditions such as tinnitus, falling or balance issues, cognitive issues, and depression.
We could go on all day about the positive impacts of addressing hearing loss, but it’s important to note that hearing aid users report better overall ability to communicate effectively, engage, and participate, which contributes to improved work performance, relationships, confidence, independence, sense of self and safety, and mental and physical health. MT2025 findings show that six in ten respondents indicated that hearing aids improve their quality of life regularly and another one in three indicated occasional improvement in quality of life. Only 2% answered that hearing aids never improve their quality of life.
That improved quality of life is reflected in the overall satisfaction with hearing aids themselves. In MT2022, over eight in ten individuals reported satisfaction with their hearing aids. The satisfaction with hearing aids remains steady in MT2025, with 82% reporting overall satisfaction (Figure 4). Notably, hearing aid owners who received assistance from a hearing care professional were more satisfied than those who did not receive assistance.
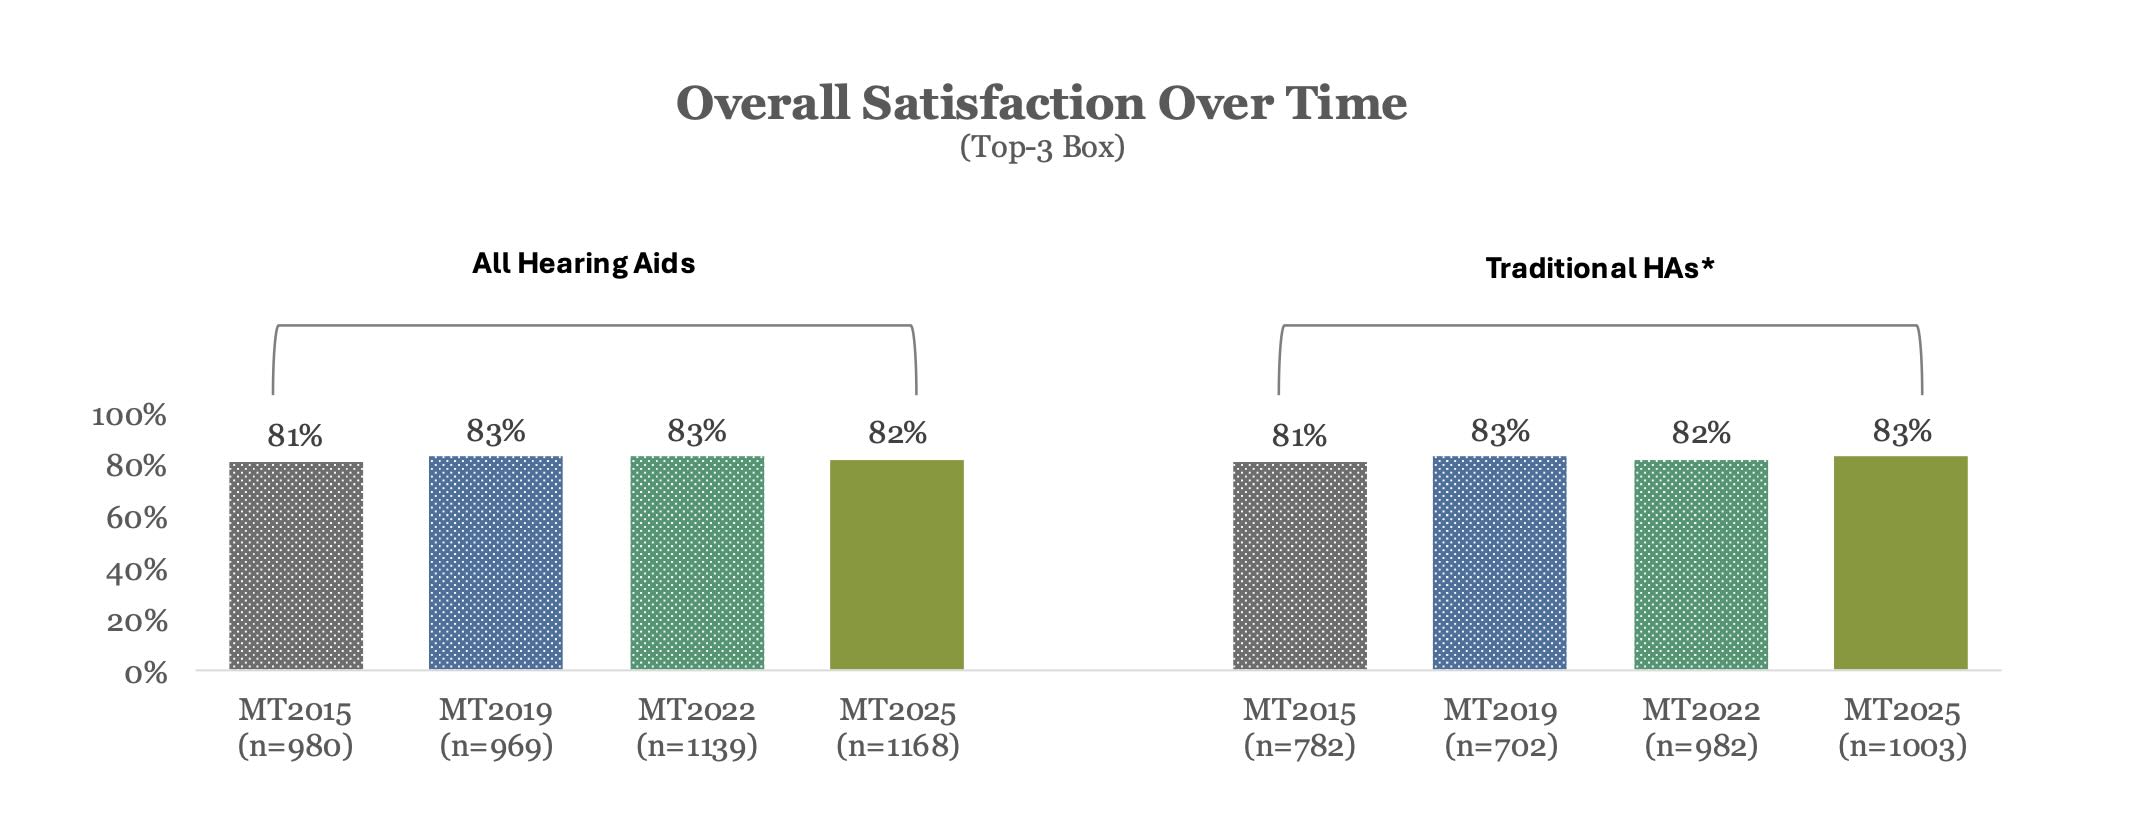
Figure 4. Overall hearing aid satisfaction over time. Click the image for a larger view in a new window.
11. Now that is interesting. What have you learned about professionals and the value of the guidance and services they provide?
Hearing care professionals continue to enjoy a high rate of satisfaction from their patients, with nine in ten individuals reporting they are satisfied with their HCP. Breaking that down a bit, 67% of hearing aid owners (traditional and OTC with assistance) felt that a hearing professional helped a great deal and another 24% felt a hearing professional was of moderate help. What’s interesting is that almost 60% of OTC owners who did not receive professional assistance felt that it would have been beneficial along the way.
When it comes to the specific areas where professional assistance was most valuable, respondents value the expert advice from HCPs, followed by good service and support, and help with fitting, adjustment, and programming. As you might recall, in MT2022, respondents reported feeling least comfortable with troubleshooting, assessing hearing loss, and selecting an appropriate hearing aid.
12. What about remote services or telehealth?
MT2022, which was fielded about a year into the COVID-19 pandemic, found that of those individuals who are looking to purchase a hearing aid now, the vast majority would lean towards a hearing aid fitted in-person by a hearing care professional. Coming in second would be a remote fitting by an HCP. In MT2025, 85% of all hearing aid owners would purchase in-person with assistance from an HCP. Non-owners had a likewise high intent to purchase in-person with HCP assistance (74%). What’s interesting is that we can break out the owners and non-owners by traditional and OTC, and out of the OTC owners who plan to purchase new hearing aids in the next few years, over half think that they will buy in-person from an HCP.
Additionally, we see an increase in those with hearing difficulty who had a professional hearing test within the last year, up 2 points to 39% versus 37% in MT2022. Of those who screened their own hearing loss, it is an even split between an online tool or using an app on a smartphone or tablet.
We see that screening tools may be utilized, but the vast majority of individuals with hearing difficulty have a professional hearing test.
13. In this very connected world, are hearing aids keeping up with Bluetooth, streaming, or other connectivity features?
You are correct, consumers demand connectivity. When looking to hearing aids with wireless capabilities, 7 in 10 hearing aid owners reported having hearing aids with some type of wireless capability. This is an increase from 42% back in 2015 when we first started tracking this feature. We are also seeing an increase in streaming directly from a smartphone, rather than through an additional accessory. Looking more specifically at the ability to stream directly from a smartphone, over half of owners who obtained their hearing aids within the last 5 years reported this feature. That’s compared to just over one in three who report using an additional accessory to stream from a TV, cell phone, or computer.
Since streaming involves a smartphone, let’s take a look at those data. For smartphones ranging from new to over six years old, the percentage of hearing aid owners who regularly use their smartphone with their hearing aid is approximately half. Tying this back to the hearing aid itself, MT2025 finds that satisfaction is higher for those who regularly use their smartphone and hearing aid together (89%) than overall hearing aid satisfaction alone (83%).
There are new connectivity features and technologies, like Auracast, being adopted and incorporated so this will be an area to keep an eye on in the next MarkeTrak.
14. Features are great, but how are we doing on sound quality?
I’ll answer your question with a question: At the end of the day, what do people want from their hearing aid? You guessed it, they want to hear! MT2025 takes a look at satisfaction with different aspects that factor into the sound of a hearing aid, including clarity, richness, directionality, background noise minimization, and more. Now, listening to birds sing is not the #1 sound on my list, but for a lot of people, it just might be, so technology that supports comfortable and authentic listening is important.
The good news is that hearing aid owners report high rates of satisfaction with these key sound situations. Nearly 8 in 10 hearing aid owners (with hearing aids purchased in the last 5 years) report satisfaction with: sound clarity, ability to manage whistling or other feedback sounds, how natural sounds are, richness, and directionality. Background noise is still a challenge for hearing aid owners, but nearly 7 in 10 are satisfied with this attribute overall.
15. To change the subject a little—What about implants?
Let’s pop back up and revisit adoption rates. As a reminder, nearly four in ten (39.1%) of individuals with self-reported hearing difficulty have a traditional, OTC, or other hearing aid. When we add in those with implants (cochlear, etc.), the rate increases to 43.4%. Of those, over half got their hearing implants within the last year and over six in 10 in have a single implant.
Among those who wear implants, the average daily usage is an average of 6.4 hours per day, with four in 10 using their implants daily. Similar to hearing aids, over 8 in 10 implant users report satisfaction with their devices. Looking a bit more closely at those elements contributing to satisfaction, top areas are when watching TV, in the workplace, in one-on-one conversations, using a cell phone, when at home with family members, talking to children, and talking on the telephone (Table 1). Similar to hearing aids, most implant owners feel their quality of life has improved and would recommend implants to friends or family members. These rates somewhat decreased from MT2022, which found that over half felt their implant regularly improved quality of life and 7 in 10 would recommend to family or friends.
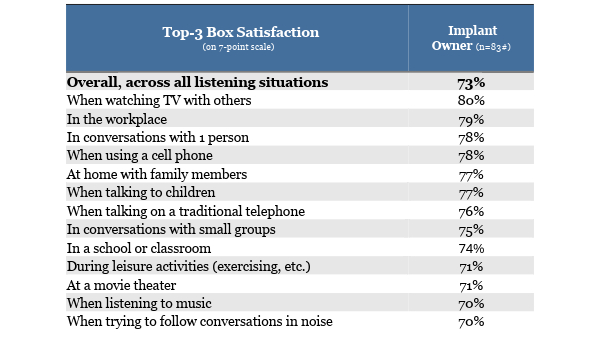
Table 1. Implant owner satisfaction with listening situations.
With eligibility criteria for cochlear implantation expanding in recent years, there could be more individuals entering the category who may not have otherwise been candidates. This could impact the expectations and, therefore, usage, quality of life, and satisfaction metrics.
16. With categories and eligibility expanding, are we seeing wearing or using habits changing?
We discussed implant user habits in MT2025, including four in ten implanted individuals using their implants daily, with the average daily wear time of 6.4 hours. This is a change from MT2022, where 51% of those with implants used them daily. However, on days worn, the average wear time was only 5.5 hours.
Let’s take a look at hearing aid usage habits by starting with where we were in MT2022. For hearing aids (remember, OTC was not a category at this time), over six in 10 hearing aid owners wore their hearing aids daily. PSAP owners showed significantly less daily usage at just four in 10. The average hours per day (on days worn) was just over 8 hours for hearing aids and 5.5 hours for PSAPs.
Now jumping back to MT2025. For all hearing aids, daily usage increased a few percentage points to nearly 7 in 10 traditional hearing aid owners, and those who wear their hearing aids daily do so for over 10 hours per day. The average across the board is 9 hours per day. Let’s break that down to see habits between traditional hearing aid owners and OTC owners. Nearly 7 in 10 (69%) of traditional hearing aid owners wear their hearing aids daily while just over half (55%) of OTC owners do so. This indicates that OTC owners may be more situational users, with less wear time per day as well.
17. Let’s go back to non-owners, or people with hearing difficulty who don’t move forward in purchasing or using hearing aids. What can you tell us about why they don’t take those steps?
We know that everyone’s hearing health journey is different. A positive trend is that two-thirds of respondents with self-reported hearing difficulty have taken steps forward in addressing or understanding their hearing loss. However, let’s talk about those who stall out in the process and some of the reasons. Of those who have never had a professional hearing test, the biggest factors were that they were not ready, felt the cost was too high, or that their loss was not significant enough (Figure 5). Of non-owners who had received a hearing aid recommendation, the top reasons were high out-of-pocket costs, they did not have any or enough coverage, or were not ready. Hearing aid owners that do not use their hearing aids feel that their hearing aids do not provide enough benefit or their hearing aids are uncomfortable.
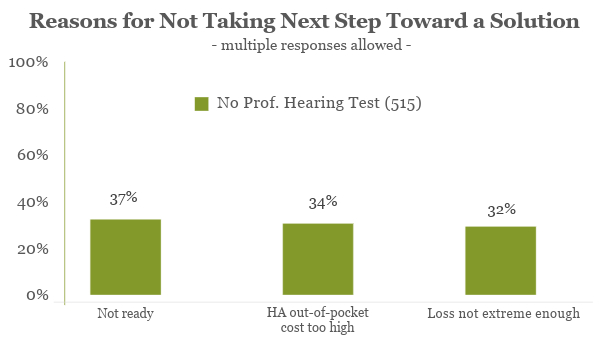
Figure 5. Reasons for not taking next step toward a solution (non-owners without a professional hearing test).
As coverage programs continue to evolve, including availability of some type of hearing benefit across nearly all Medicare Advantage plans, and expanding state insurance coverage mandates, this is an opportunity to continue to educate on the available options for consumers, particularly those who have received a recommendation for hearing aids.
If we look at future purchase intentions, more current hearing aid non-owners are open to purchasing within the next few years (on average) than in 2022. This rate increases for non-owners with greater degrees of hearing loss. With approximately four in 10 individuals with self-reported hearing difficulty actually adopting hearing aids, there is more work to be done to engage non-owners.
18. I seem to recall that roughly one in 10 individuals report having some degree of hearing loss. Does MT2025 support those data?
You are correct that through the last three MarkeTrak waves, the self-reported difficulty has hovered right around that one in 10 mark. However, MT2025 found a decrease to just over 9%. While not a significant decrease, this is the first time the rate has dropped below 10% within recent MarkeTrak waves. There are multiple hypotheses that could factor into this change, including the timing of the study and whether response fatigue might factor in (fielding took place around election time when political campaign outreach is at a high), a corresponding reduction in other reported conditions under MT2025, or perhaps education and awareness campaigns around noise protection and the importance of hearing health are showing results. Given that this is the first decrease in the self-reported hearing difficulty rate in four MarkeTrak waves, this warrants additional study.
19. We have talked about device features, but it seems like with more bells and whistles comes a higher possibility of the device having repair issues. Does MarkeTrak also look at repairs?
It does! The good news is that MT2025 reflects the durability of hearing aids even as they continue to innovate. In MT2022, around 1 in 3 hearing aid owners who got their hearing aid in the last 5 years had it repaired. In MT2025, that rate dropped to about 1 in 5 hearing aid owners. This is important, as so many hearing aid owners utilize their devices in their everyday lives, so reliability is key. In fact, MT2025 also shows that over 8 in 10 hearing aid owners are satisfied with the reliability of their hearing aid.
20. Always looking ahead to the next MarkeTrak, are there areas that you anticipate digging into?
We just finished this one, let us catch our breath! No, of course we are always looking ahead to the next one. As in the last wave of MarkeTrak, MT2025 included questions about earbuds with hearing improvement features. These included examples such as AirPod Pros and other earbuds with “conversation boost” or another type of hearing enhancement. Participation in this category increased in MT2025 versus MT2022, which makes it an interesting segment to track and analyze further in future surveys.
Since this is a market and consumer behavior survey, future waves of MarkeTrak will continue to evolve to take into account new players, innovations, access pathways, and coverage options. And, since this was the first MarkeTrak just two years after the effective date of the OTC hearing aid rule, it will be interesting to see if adoption rates change since we saw a strong trend toward traditional hearing aids and professional assistance in the journey.
Citation
Dobyan, B. (2025). 20Q: Interpreting the hearing health landscape through MarkeTrak - from insight to impact. AudiologyOnline, Article 29350. Available at www.audiologyonline.com