
 From the Desk of Gus Mueller
I think most all of us would agree that knowing the real-world outcome of our hearing aid fittings is the most important component of the entire fitting process. Yet, outcome measures have not become routine clinical practice. Why is this?
There was a time, as recent as the 1970s, when outcome measures were considered part of “rehab audiology”—often a different clan of audiologists than “the hearing aid fitters.” But that has changed. The groups have more or less merged, and outcome measures have been part of best practice recommended hearing aid fitting protocols for the past 30 years.
There also was a time when there were only a limited number of well-validated self–assessment scales available. That certainly has changed. We have a tool kit full of excellent scales which can be used to assess use, benefit, handicap, satisfaction, loudness normalization, special features, personality, emotion, quality of life and most anything else related to hearing aid use.
And yes, there are some that say that outcome measures simply take too much time. This too has changed with the advancement of computers, the Internet and smartphone applications. As discussed by one of our previous 20Q authors, Yu-Hsiang Wu, we even can use the patients’ hearing aids to assist in the momentary real-world assessment in their everyday listening situations.
So why haven’t outcome measures become routine practice among audiologists? That’s what our guest 20Q author will talk about, and he even has a new outcome scale to add to your list. John E. Tecca, PhD, is a practicing audiologist/owner of Hearing Services & Systems in Portage, MI. He has held faculty appointments at West Virginia University and Western Michigan University.
John has authored several research articles and book chapters, and was one of the first audiologists to write clinically relevant articles related to probe-mic measures. His straightforward clinical insights on outcome measures are equally valuable.
It’s funny, but not in a “ha-ha” way, that today, many audiologists are more aware of how they are being rated by their Uber drivers, than how they are being rated by their hearing aid patients. That doesn’t seem quite right. This article will hopefully encourage some of you to give outcome measures a try.
Gus Mueller, PhD
Contributing Editor
Browse the complete collection of 20Q with Gus Mueller CEU articles at www.audiologyonline.com/20Q
Learning Outcomes
After this course, readers will be able to:
- Define outcome measure as it relates to audiology practice.
- Describe the purpose of outcome measures in audiology clinical practice, and list some outcome measures for assessing hearing aid benefit.
- Describe a practical protocol for implementation of an outcome measure for assessing hearing aid benefit.

John E. Tecca
20Q: Outcome Measures in Clinical Practice
1. By outcome measures, do you mean the real-ear probe microphone measures that I’m doing?
No, you are mixing up verification and validation. Probe microphone measures are verification. I live and breathe real ear measures. They tell us if we are giving an appropriate pattern of gain and output in the patient’s ear canal. By the way, I'm really glad you are using your probe microphone system. Despite the evidence that this is the only way to accurately assess the adequacy of your prescriptive fitting (Hawkins & Cook, 2003; Sanders, Stoddy, Weber, & Mueller, 2015) less than 50% of audiologists use probe measures (Mueller & Picou, 2010). But I'm getting off track here. Outcome measures are designed to obtain the patient perspective after some period of use. That's validation. Check out Gus Mueller's November 20Q article (Mueller, 2017) for a very nice and more detailed discussion of the difference. Cox, Johnson and Xu (2016, p. e228) put it this way, “In the long run, it is the performance in daily living in the circumstances of the particular listener that determines the usefulness of a hearing aid fitting.”
2. But if I fit to a validated prescriptive target, can’t I assume that a good real-world outcome is likely?
Not necessarily. Fitting to target is absolutely the right way to start your hearing aid fitting so you verify audibility. All prescriptive formulae provide targets that are based on averages from large groups. I don't know about your patients, but mine never seem to be average. There are going to be different preferences for sound in and out of the clinic. If you rigidly adhere to target fitting you are going to be right on the average, but you are going to have some unhappy folks who just don't fit the mold. I might also add that listening is an aesthetic experience. I used to like pounding bass in my rock and roll but not so much these days. There is room for listener preference for sound quality while still attending to your targets. In other words, your verification may be spot on, but your validation may fail miserably. You need both.
3. And this is where outcome measures enter the picture?
Exactly. The outcome measure is a survey used to assess the patients’ perspective on how they are doing with their hearing aids in various situations. I bet you do this informally all the time when you talk to your patients in your office. "How do you hear conversations at home?" "How well do you understand in a busy restaurant?" "Is the ear mold comfortable?" "Is the hearing aid easy to handle?" Stuff like that. The outcome measure is a formalized survey that the patient completes after some period of use.
4. Do many audiologists use outcome measures?
Not really. Something like 30% of practices reported using some type of outcome measure in two different studies (Lindley, 2006; Brook, 2013). My bet is that's an optimistic number. However, the routine use of outcome measures is considered best practices by two major organizations representing audiologists (Valente, 2006; ASHA, 1998).
Things are quite different in the research world. Nearly every study that has a “real world” component uses one or more outcome measure to determine if something significant has occurred. That something might be benefit from unilateral vs bilateral hearing aids (Cox, Schwartz, Noe, & Alexander, 2011), benefit from directionality (Picou, Moore, & Ricketts, 2017; Picou, Moore, & Ricketts, 2014), benefit from different levels of technology (Cox, Johnson, & Xu, 2016; Johnson, Xu, & Cox, 2016), preference for different styles of hearing aids (Smith et al., 2013), benefit from over the counter vs audiologist fit hearing aids (Humes et al., 2017), etc. The point is that the scientists who are helping expand our knowledge base incorporate outcome measures in their experimental design. Unlike using KEMAR, an anechoic chamber, or other complicated and expensive electroacoustic devices you probably do not own, this is something you can do as soon as you decide what you want to measure.
5. Are there many outcome measures available?
Almost too many to count. Take a look at the text, Hearing Aids, 2nd edition (Dillon, 2012). There is an extensive chapter which includes a review of surveys that are available. The list continues to grow. You may find a survey that will meet your objectives. There are also some nice articles offering guidelines to help your selection (Bentler & Kramer, 2000; Humes, 2004). You should carefully consider the items in each survey. If it doesn't give you information you believe will be helpful in your practice, why would you use it?
6. I understand that you created a new outcome measure? Why did you do that if there are already a lot?
My colleague, Kristy K. Deiters, AuD, and I wanted a brief survey that could be administered by paper and pencil with very simple instructions, suitable for mailing to our patients (Tecca & Deiters, 2017a). We wanted it to include domains of hearing aid use (e.g. ease of handling, comfort, hours of use), benefit (e.g. ability to hear in various situations) and quality of life. We wanted to be able to review and score it by "eyeball" without computer assistance. We didn't find a survey that seemed to fit these requirements and we really didn’t want to combine surveys. For many years, we have used a check list that includes most of these things to help structure our in-office follow up visits. We modified and expanded this list to create the Hearing Aid Follow-Up Survey (HAFUS). The final version has 18 items with responses made on a 7-point Likert scale plus a N/A option (except item one with four options for daily use time). Check it out in Figure 1.
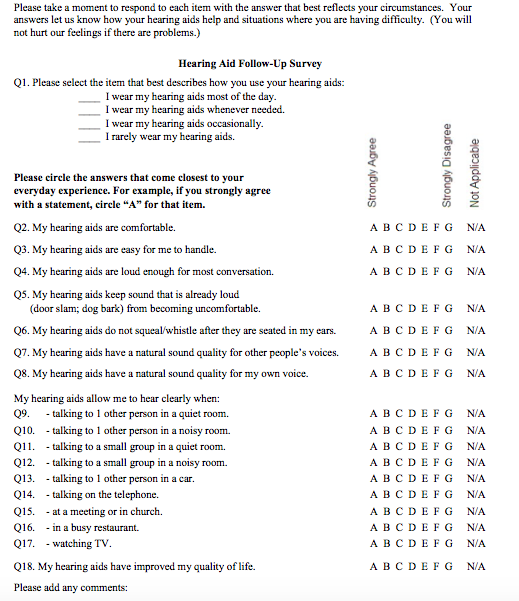
Figure 1. The Hearing Aid Follow Up Survey (HAFUS). Click here for a larger version in pdf format.
7. Okay, it seems like a reasonable measure. Tell me how you use it.
We mail it to our patients 2-3 months post fitting, along with a cover letter and a stamped and addressed return envelope. We believe this time frame allows time for possible acclimatization, to experience a wide variety of communication situations and simply to get used to their new devices (Cox & Alexander, 1992; Humes, Halling & Coughlin, 1996). We put an original signature on each letter and sometimes hand write a personal note at the end. This also gives us the chance to delay sending a survey to a patient that has taken longer to be fitted to our satisfaction. When the HAFUS comes back we review it. If all looks good, we make a chart note and call it a wrap. If we don't think the outcomes measure up to our expectations, we contact the patient to try to help. Sometimes all that is needed is a phone call, but often we ask the patient to come back to the office as we try to “fix” whatever went wrong between the last office visit and the completion of the survey. I have had a few cases where the responses on the HAFUS looked really bad. On the phone, the patient said, “I love my hearing aids. I think responses in the middle of the scale range are very good!” So much for grade inflation. I also want to clarify that when I use the term "fix", sometimes it really means counseling the patient on realistic expectations or stage management to better structure the situation for effective communication.
8. What do you mean "measure up to expectations"?
This is really a 2-part answer. First, do the responses compare favorably to the normative data? Our normative group consisted of 303 patients with diverse age, hearing loss and types of hearing aids. The mean age for these patients was 76.01 (standard deviation = 14.36) and the mean 4-frequency pure tone average was 50.76 (standard deviation 14.21). Table 1 shows the means and standard deviations for all 18 items plus "quiet" and "noise" subscales. We expect responses to the use and "easy" communication items to be “A” or “B”. Responses for the more difficult items may range from “B” to “D”.
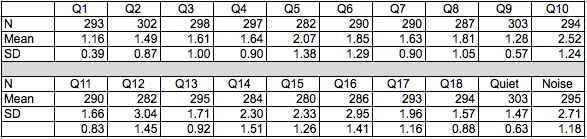
Table 1. Descriptive statistics for the original data set. Q1 - Q18 refer to the items on the HAFUS. Quiet refers to the subscale including items 9 and 11. Noise refers to the subscale including items 10, 12, 15 and 16.
Table 2 shows the cumulative percentage of patients responding A-E for each item.
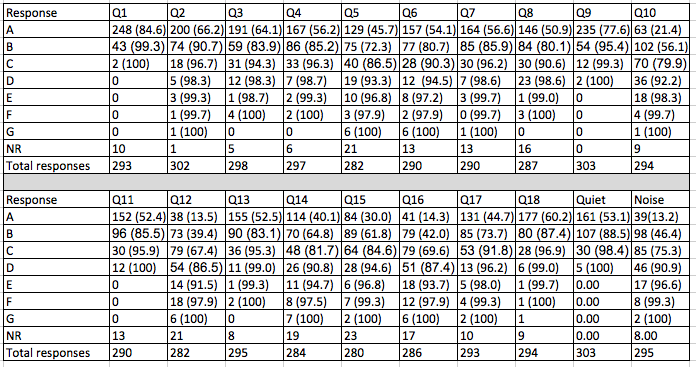
Table 2. Number of responses for each item with cumulative percentage in parenthesis. Q1 - Q18 refer to the items on the HAFUS. Quiet refers to the sub scale including items 9 and 11. Noise refers to the subscale including items 10, 12, 15 and 16.
I think it will be clear why I am recommending those cut off points. Second, it is not reasonable to expect everyone to do that well. A 90-year-old with a severe hearing loss may have tremendous improvement but still not have the same functional benefit as a 50-year-old with a moderate loss. So, more subjectively, we consider their responses to the communication items considering what “seems reasonable” given what we know about the patient.
This also seems like a good time to tell you that you can quantify the HAFUS score if you want. Though we normally leave the responses in alpha form clinically, it was necessary to get numeric scores for statistical analysis. We assign A = 1, B = 2,...G = 7. Obviously, a low score is good on the HAFUS.
9. Do most of your patients send back a completed survey?
We get 80-85% responses with 60-65% coming with the first mailing and another 20% from the second mailing. We think the prompt that comes from the second mailing is worthwhile to pick up the additional responses. You know a lot of people intend to act but just put things off. The second mailing lets them know we think it's important and really want to know how they are doing. I also think it helps to tell the patient about the HAFUS at their last follow up visit. I let them know we look at every survey and we consider their responses important in determining the success of the fitting.
10. That sounds like a lot of work and a lot of expense. What does it cost you?
You are right, there is expense. It works out to about $1.40 per piece mailed (letter and survey front/back on one piece of letterhead, two envelopes, two stamps). There is staff time involved to run the report to create the mail list from our practice management software and merge it to our letter template. We also add the names to a spreadsheet for tracking responses. Letters are signed by the audiologists, then stuffed and mailed by staff. As the surveys are returned to us, our staff notes the response on the spread sheet and routes them to the audiologist for review. The audiologist then decides if further action is needed. Each time a new group of patients is created, the previous list is reviewed to send out second letters and surveys to the non-responders. Staff time is less than 1 hour for each group mailed and received. This fills otherwise dead time in the day, so it does not add to overhead expenses. Audiology time also is handled during regular administrative time. Obviously, expenses will vary by the process in each office. For a practice dispensing hearing aids to 20 patients per month it would cost about 40 bucks (20 first time surveys mailed + 8 second mailings to non-responders = 28 x $1.40 = $39.20).
As you can probably tell by now, we have a clearly defined process for making this happen. Everyone involved knows their role. It took a while to get the kinks worked out, but everyone has bought in to the importance of the HAFUS. If you are casual in your assignments, it's probably going to be hit or miss.
11. I'll bet you hate it when you get an unfavorable survey back! What do you do?
Sure, we want all our patients to have exceptional outcomes. However, the survey is valuable because sometimes the outcomes are not so hot. The final follow-up visit occurs when we believe the patient is doing well or when they decline to come back. The survey gives us a glimpse 2-3 month down the road to see if we were right. This allows us to take another shot at improving subpar outcomes. I could write a whole column on surprising outcomes, and I bet you could too. For example, I have had HAFUS responses indicating the hearing aids are uncomfortable. When the patient arrived at the office I found they were being worn in the wrong ears! So, what seemed a fit issue was a training issue that required attention to achieve good outcomes.
12. Have you ever used the HAFUS on the same person over time?
Yes, both with different hearing aids and the same hearing aids on different dates. We have short term reliability data gathered from a group of patients who completed the HAFUS twice with about one month in between (Tecca & Deiters, 2017a). The 90% critical difference was < .69 scale units and the 95% critical difference was <.84 scale units (Table 3). A conservative approach is to consider an item change of one or more scale units as significant.
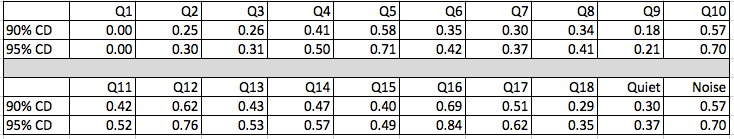
Table 3. Critical differences for individual HAFUS items. Q1-Q18 refer to the items on the HAFUS. Quiet refers to the subscale including items 9 and 11. Noise refers to the subscale including items 10, 12, 15 and 16.
We also have seen what happens several years later (Tecca & Deiters, 2017b). We’ve been using the HAFUS long enough now that we have results from some patients who are now using their second set of hearing aids. It is interesting to compare outcomes separated by several years with different hearing aids for the same person. It’s a lot like looking at serial audiograms. In most cases the surveys don’t change all that much. Our interpretation is that well-fitted hearing aids give good outcomes even with several generations of technology change. This notion is consistent with the updated APHAB norms for WDRC hearing aids, which weren’t much different for the communication subscales than the original normative data generated with analog hearing aids 10 years previously (Johnson, Cox, & Alexander, 2010).
The post fitting HAFUS also serves as a baseline reference for patient visits years into the future. For example, imagine you have a patient return 3 years post-fitting. The patient complains that he has never liked his hearing aids and they are of no benefit. As you review the chart, you find the patient has not returned since the immediate post-fitting follow up visits. However, the HAFUS was completed two months post-fitting. The responses indicated that the patient was consistently wearing the hearing aids without problem and even reported reasonable benefit in situations with background noise. Resist the temptation to make this a "gotcha" moment. I find it helpful, however to share these HAFUS responses with the patient. This gives us a starting point to figure out what changed and how we can get things back on track. Patients typically respond very positively to this approach to problem solving.
13. I want to back you up just a little. Did you say that based on your HAFUS findings people do as well with old hearing aids as new hearing aids?
You are putting words in my mouth. I said for many of our patients, all with verified fittings, the HAFUS results didn’t change significantly with new devices. This is not necessarily a bad thing. It means we did it well the first time, but the updated technology really may have provided marginal additional benefit. I think audibility + no loudness discomfort + comfort of fit are key to a successful fitting.
We have some pretty cool data comparing HAFUS results over time with the same devices (Tecca & Deiters, 2017b). Two times a year we host a “cleaning day” for our patients with refreshments and fun. It’s intended to be a maintenance clinic for those doing well with their hearing aids. Our patients love it. On a couple of occasions, we have asked patients to complete the HAFUS when they arrived at the office. This generated a lot of data in a short time (the staff wasn’t too crazy about this idea). For many of these folks, we had their HAFUS that was completed when the aids were new. Figure 2 shows results from two groups of patients, our normative group of 303 patients and a group of 162 patients who completed the HAFUS during “cleaning day,” when their aids were months to years old. The scores weren’t much different over time for the 11 items that we compared. Essentially no changes were noted for those with aids only about 2 years old. For those with older hearing aids there was some indication that they were no longer loud enough and that they weren’t helping quite as much in noisy situations. There are many possible explanations, including changes in hearing or hearing aid function (e.g. high frequency roll-off) that we could not explore at the time. These findings do indicate the HAFUS is sensitive to changes in perceived benefit.
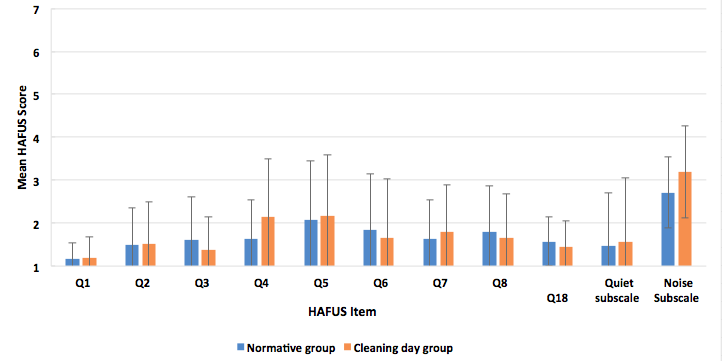
Figure 2. Mean HAFUS scores for 2 groups separated by time after fitting that the scale was completed. Group one (blue bars), the normative data set of 303 patients and group two (orange bars), 162 patients who completed the scale an average of 3-4 years post fitting. Error bars = 1 standard deviation. Q1 = hearing aid wear time; Q2 = comfort of fit; Q3 = ease of handling; Q4 = hearing aids are loud enough for conversation; Q5 = hearing aids are not uncomfortably loud; Q6 = squeal/feedback; Q7 = others voices have natural sound quality; Q8 = own voice has natural sound quality. Quiet subscale = hearing in quiet, items 9, 11; Noise subscale = hearing in noise/reverberation. items 10, 12, 15, 16.
14. Have you looked at outcomes with different types of patient?
Certainly. We sorted our normative group every which way (Tecca & Deiters, 2017b). Briefly, we found no difference in outcomes based on gender or payment method (about 1/2 of our patients have some insurance contributing to the hearing aid cost). We did find a gradual reduction in performance on HAFUS noise items with increasing age (Figure 3) and with increasing hearing loss (Figure 4). However, statistical significance was reached only in comparing the oldest (> 90 years) and youngest (< 59 years) age groups and those with the biggest (> 70 dB HL) and least (< 39 dB HL) hearing loss.
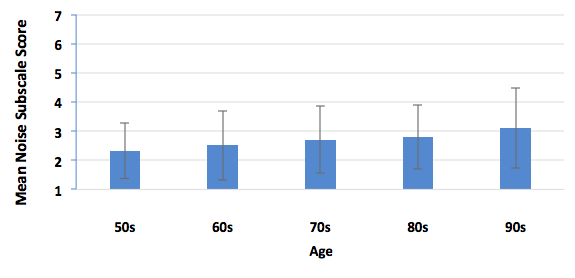
Figure 3. Mean HAFUS score on the noise subscale for patients separated by age decade. Error bars = 1 standard deviation. 50s = patients 59 years and younger; 60s = patients age 60-69 years; 70s = patients 70-79 years; 80s = patients 80-89 years; 90s = patients age 90 years and older.
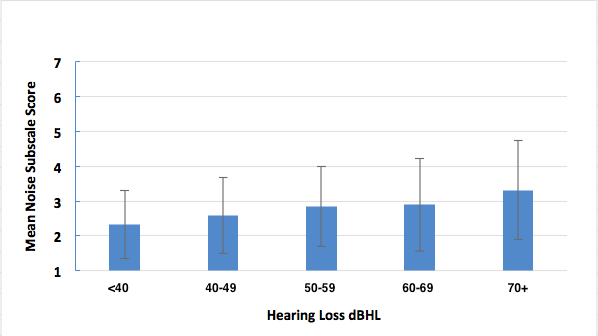
Figure 4. Mean HAFUS score on the noise subscale for patients separated by 4 frequency average (500 Hz, 1 kHz, 2 kHz, 4 kHz) degree of hearing loss. Error bars = 1 standard deviation.
15. Did you compare first time versus experienced hearing aid users? I’ll bet the experienced users did better.
Yes, we did and no they did not. Our normative group had 69% previous hearing aid wearers and 31% first timers. We compared them on the HAFUS hearing in noise subscale (items 10, 12, 15, 16, averaged). The newbies did significantly better (t (293) = -3.032, p = .003) than the experienced users but the effect size of .41 on Cohen’s d was small. Figure 5 is a bar graph showing the similar performance. The groups both averaged 76 years old but the likely explanation was the newbies had about 12 dB less hearing loss. This may surprise you but both groups reported wearing their hearing aids most of the time with less than .25 mean scale unit separating the groups.
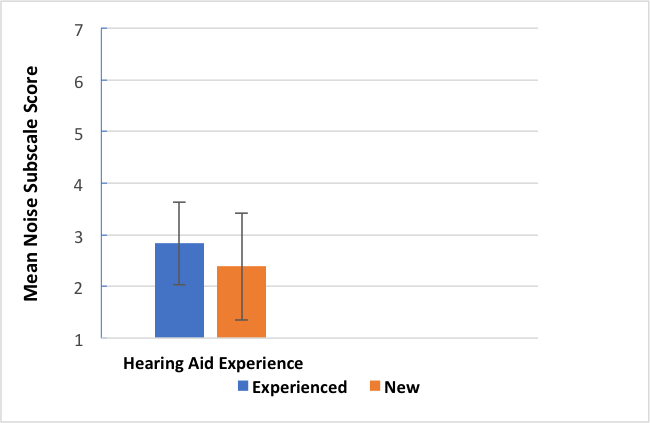
Figure 5. Mean HAFUS score on the noise subscale for patients separated by level of hearing aid experience. Error bars = 1 standard deviation; Blue bar = experienced hearing aid wearers; Orange bar = first time hearing aid wearers.
16. What about one vs two hearing aids?
Yes, we’ve looked at that too. We have quite a few patients who wear only one hearing aid for a variety of reasons. In our normative group there were 72% bilateral wearers and 28% unilateral wearers. We compared these groups on wear time (Q1), loudness of average and strong sound (Q4, Q5), sound quality of own and others’ voices (Q7, Q8), hearing in quiet (Q9, Q11) and hearing in noise/reverberation (Q10, Q12, Q15, Q16). None of the comparisons using the t-test were statistically significant (p >.05). Figure 6 gives a nice visual of the similarities. Now before you scream blasphemy and stop reading, these findings are consistent with recent research by Cox, et al. (2011) who found that 46% of their subjects preferred one over two hearing aids. We think that in most cases, patients prefer and do better with two aids (McArdle, Killion, Mennite, & Chisolm, 2012). However, some folks only want to wear one hearing aid and the evidence shows that they should not be denied this opportunity.
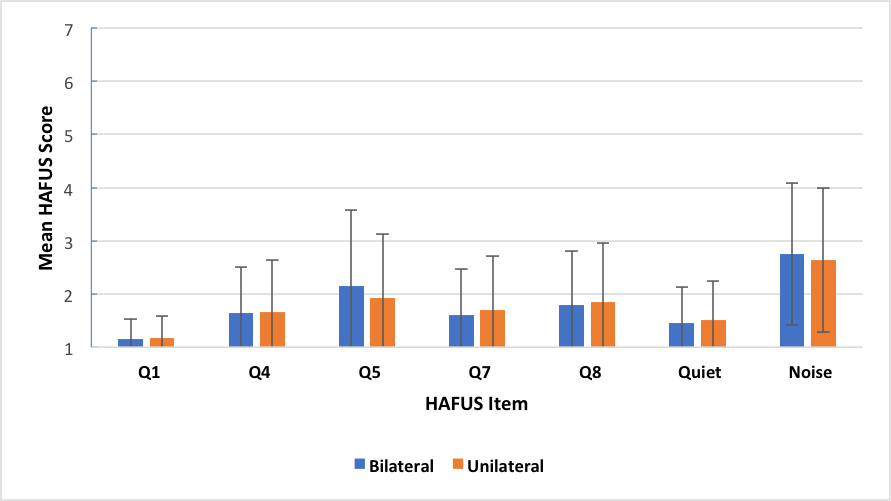
Figure 6. Mean HAFUS score for groups separated by bilateral (blue bars) or unilateral (orange bars) hearing aid use. Error bars = 1 standard deviation. Q1 = hearing aid wear time; Q4 = hearing aids are loud enough for conversation; Q5 = hearing aids are not uncomfortably loud; Q7 = others voices have natural sound quality; Q8 = own voice has natural sound quality; Quiet = hearing in quiet, items 9, 11; Noise = hearing in noise/reverberation, items 10, 12, 15, 16.
17. Have you looked at different outcomes with different levels of technology?
Yes. Four different levels of technology were available to our patients during the period that HAFUS normative data were analyzed. As you know, more sophisticated hearing aids provide more features. The primary reason our patients are attracted to higher levels of technology is for more automatic adaptation to their ever-changing acoustic environments, especially with regard to management of background noise. Comparisons were made on the HAFUS noise subscale for patients fit with basic, standard, advanced and premium technology devices. The difference between the best and worst group scores was less than .5 scale units and the most sophisticated technology was not the winner. There were no significant differences on ANOVA testing (p > .05). This is consistent with others, who have found more sophisticated hearing aids did not produce better outcomes (Cox, Johnson, & Xu, 2016; Johnson, Xu, & Cox, 2016; Humes, Kinney, & Thompson, 2009; Humes, Ahlstrom, Bratt, & Peek, 2009). There are some individuals who perform better with more sophisticated hearing aids. However, it seems the masses should have the opportunity to try more moderately featured (and priced) products before taking them to the top of the line.
18. Is it possible to use the HAFUS as a prefitting measure?
Yes, again. After using the HAFUS for a few years, we modified items 9-18 to be used as a prefitting measure (Figure 7). We incorporated it to our intake procedure with all new patients.
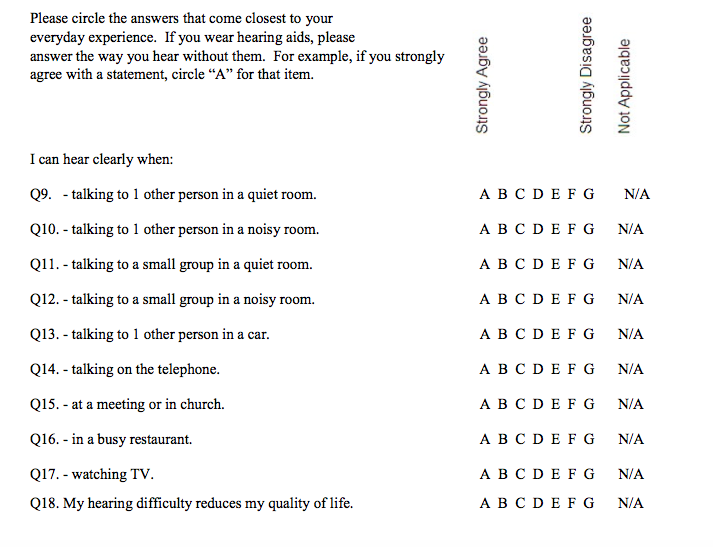
Figure 7. HAFUS pre-fitting version. Click here for a larger pdf version.
We can then obtain a benefit score by subtracting the results of the aided item from the same unaided item. (Remember, A = 1, B = 2, etc). For item 18, the unaided score is reversed such that A is a negative response. So, you first must subtract it from 8 (e.g., A = 1, 8 – 1 = 7, a really bad response). Figure 8 shows prefitting and post-fitting results for 58 consecutive patients fit with various styles of hearing aids. Remember, bigger scores on the HAFUS mean poorer outcomes. The difference for every item was significant beyond the .001 level for t-tests for paired items and the effect sizes were medium to large for Cohen's d. Let me beat the dead horse just a bit. Items 10, 12, 15 and 16 deal with hearing in noise. These show the greatest difficulty in the prefitting surveys, as you might expect. But look at the post fitting surveys. The change is huge! These patients are clearly hearing better in noise with their aids than without. Yes, noise is still their biggest complaint but it's significantly better than unaided. Do you think this type of information could be helpful in documenting the value of what we do?
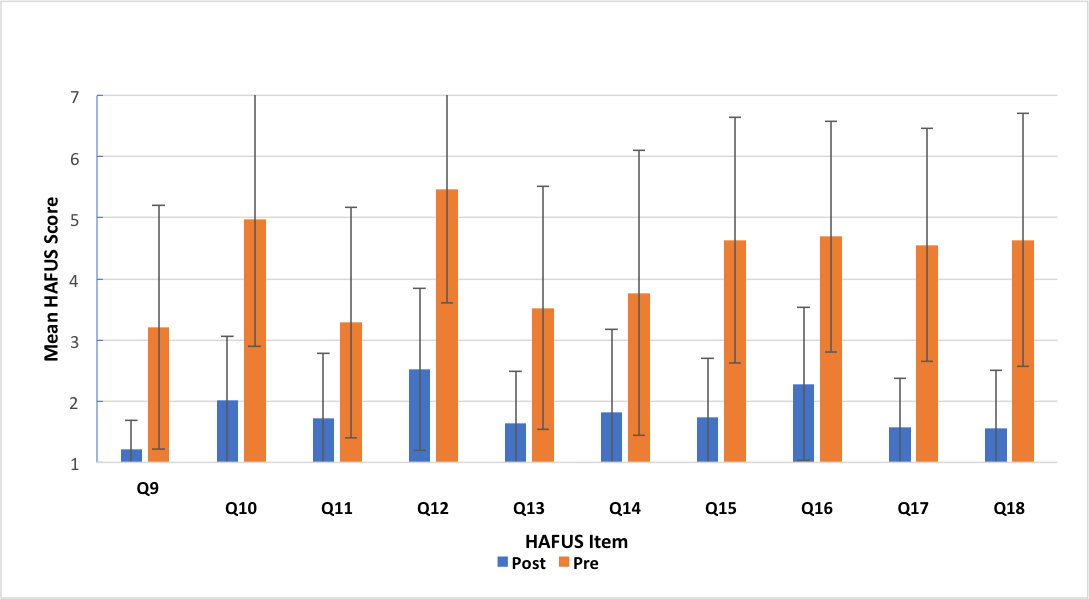
Figure 8. Mean scores for HAFUS items 9-18 administered to 58 consecutive patients as both a prefitting (orange bars) and a post-fitting (blue bars) measure. The items are included in Figure 1 and Figure 7.
19. You are suggesting I start using a new procedure that will take more time and money and may question the tenets I hold near and dear. Am I missing something?
Yeah, like the big picture. Using an outcome measure will give you knowledge and power. It will keep you in touch with what’s really happening with your patients. It will help you decide if those fancy new hearing aid features are worthwhile. It will give you the data to prove you are as good as you think! And with a proper diet and regular exercise you will be unstoppable! I think much of what I have shown you in this article demonstrates the value of what we do. Properly fit hearing aids with adequate follow-up care generally give patients a lot of help. I don’t know about you, but I’m pretty sure these kinds of outcome aren’t going to happen with some off-the-shelf do-it-yourself approach. I guess we're going to find out in the near future.
20. What's my take away if I want to start using outcome measures ASAP?
Don’t be in such a rush. After all, you’ve probably waited longer than the 7 years it took your new hearing aid wearers to move ahead. Decide what you would like the outcome measure to do. Find one of the many good choices that seem like it will work for you. Ask a few patients to try it while you are off cleaning their hearing aids or having a cup of coffee. When you find one that feels right to you, establish a protocol that will be easy to fit into your routine and go for it! And don’t forget to use your probe microphone system to verify prescriptive targets!
Acknowledgements
The figures and tables in this article were adapted from Tecca and Deiters, 2017a and 2017b, with permission from the American Academy of Audiology. Our project was approved by the Human Subjects Institutional Review Board of Western Michigan University.
References
American Speech-Language-Hearing Association. (1998). Guidelines for hearing aid fitting for adults. Available from www.asha.org/policy.
Bentler, R.A. & Kramer, S.A. (2000). Guidelines for choosing a self-report outcome measure. Ear and Hearing, 41(4), 37S-49S).
Brook, G. (2013). Audiology survey report: Clinical focus patterns 2006-2012. Available from www.asha.org
Cox, R.M., & Alexander, G.C. (1993). Maturation of hearing aid benefit: subjective and objective measurements. Ear and Hearing, 13(3), 131-141.
Cox, R.M., Johnson, J.A., & Xu, J. (2016). Impact of hearing aid technology on outcomes in daily life: the patients’ perspective. Ear and Hearing, 37, e224-e237.
Cox, R.M, Schwartz, K.L, Noe, C.M & Alexander, G.C. (2011). Preference for one or two hearing aids among adult patients. Ear and Hearing, 32(2), 181-197.
Dillon, H. (2012). Hearing aids (2nd ed.). New York: Thieme.
Hawkins, D.B., & Cook, J.A. (2003). Hearing aid software predictive gain values: How accurate are they? Hearing Journal, 56(7), 26-34.
Humes, L. (2004). As outcome measures proliferate, how do you choose which ones to use? Hearing Journal, 57(4), 10,12,16-17.
Humes, L.A., Ahlstrom, M.S., Bratt, G.W., & Peek, B.F. (2009). Studies of hearing-aid outcome measures in older adults: A comparison of technologies and an examination of individual differences. Seminars in Hearing, 30(2), 112-129.
Humes, L.A., Halling, D., & Coughlin, M. (1996). Reliability and stability of various hearing-aid oriented outcome measures in a group of elderly hearing-aid wearers. Journal of Speech and Hearing Research, 39, 923-935.
Humes, L.A., Kinney, D., & Thompson, E. (2009). Comparison of benefits provided by various hearing aid technologies in older adults. In L. Hickson (ed),, Hearing care for adults 2009 – The challenge of aging, Proceedings of the Second International Adult conference (pp. 131-138).
Humes, L.E., Rogers, S.E., Quigley, T.M., Main, A.K., Kinney, D.L., & Herring, C. (2017). The effects of service-delivery model and purchase price on hearing –aid outcomes in older adults: A randomized double-blind placebo-controlled clinical trial. American Journal of Audiology, 26, 53-79.
Johnson, J., Cox, R.M., & Alexander, G.C. (2010). APHAB norms for WDRC hearing aids. Ear and Hearing, 31(1), 47-55.
Johnson, J.A., Xu, J., & Cox, R.M. (2016). Impact of hearing aid technology on outcomes in daily life II: Speech understanding and listening effort. Ear and Hearing, 37(5), 529-540.
Lindley, G. (2006). Current hearing aid fitting protocols: Results from an online survey. Audiology Today, 18(3), 19-22.
McArdle, R.A., Killion, M., Mennite, M.A., & Chisolm, T.H. (2012). Are two ears not better than one? Journal of the American Academy of Audiology, 23(3), 171-81.
Mueller, H.G. (2017, November). 20Q: Hearing aid verification - can you afford not to? AudiologyOnline, Article 21716. Retrieved from www.audiologyonline.com
Mueller, H.G., & Picou, E.M. (2010). Survey examines popularity of real-ear probe-microphone measures. Hearing Journal 63(5), 27-32.
Picou, E.M., Aspell, E., & Ricketts, T.A. (2014). Potential benefits and limitations of three types of directional processing in hearing aids. Ear and Hearing, 35(3), 339-352.
Picou, E.M., Moore, T.M., & Ricketts, T.A. (2017). The effects of directional processing on objective and subjective listening effort. Journal of Speech, Language, and Hearing Research, 60, 199-211.
Sanders, J., Stoody, T., Weber, J.E., & Mueller, H.G. (2015). Manufacturers’ NAL-NL2 fittings fail real-ear verification. Hearing Review, 21(3), 24-32.
Smith, S.L., Ricketts, T., McArdle, R.A., Chisholm, T.H., Alexander, G.A., & Bratt, G. (2013). Style preference survey: A report on the psychometric properties and a cross-validation experiment. Journal of the American Academy of Audiology, 24(2), 89-104.
Tecca, J.E., & Deiters, K.D. (2017a). The use of outcome measures in clinical practice: Part 1. Audiology Today, 29(3), 50-59.
Tecca, J.E., & Deiters, K.D. (2017b). The use of outcome measures in clinical practice: Part 2. Audiology Today, 29(4), 28-37.
Valente, M. (2006). Guideline for audiologic management of the adult patient. AudiologyOnline, Article 966. Retrieved from www.audiologyonline.com
Citation
Tecca, J.E. (2018, March). 20Q: Outcomes measures in clinical practice. AudiologyOnline, Article 22332. Retrieved from www.audiologyonline.com

