University of Kansas
Medical Center
Kansas City, KS
John A. Ferraro, Ph.D.
Professor and Chairman, Hearing and Speech Department, University of Kansas Medical Center
Associate Dean for Research, School of Allied Health
Co-Director, University of Kansas Intercampus Program in Communicative Disorders
Hearing and Speech Department
University of Kansas Medical Center
39th and Rainbow Blvd.
Kansas City, KS 66160-7605
(913) 588-5937
[email protected]
Introduction
As the term implies, "Electrocochleography" (ECochG) is a method for recording the electrical potentials of the cochlea. Practically speaking however, ECochG generally involves measurement of the stimulus-related cochlear potentials (as opposed to the resting potentials), and often includes measurement of the whole nerve or compound action potential (AP) of the auditory nerve.
The product of ECochG (i.e., an"electrocochleogram" or ECochGm) is shown in Figure 1. As depicted in this figure, the constituents of an ECochGm may include the cochlear microphonic (CM), cochlear summating potential (SP), and AP measured independently or in various combinations. The reader is referred to Ferraro (2000) for a more thorough review of the history of these potentials as recorded in humans.
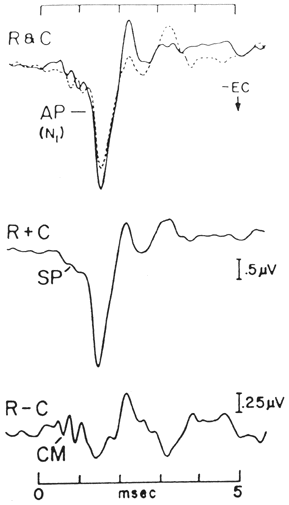
Figure 1. Components of the human electrocochleogram evoked by click stimuli. Top tracings display responses to rarefaction (R) and condensation (C) polarity clicks. Adding separate R and C responses (middle tracing) enhances the cochlear Summating Potential (SP) and auditory nerve Action Potential (AP). Subtracting R and C responses (bottom tracing), enhances the Cochlear Microphonic (CM) (from ASHA, 1988, pg. 9, based on data from Coats, 1981).
Although available to the hearing scientist/clinician for over 50 years, ECochG's emergence as a clinical tool (as well as all other auditory evoked potentials) was rekindled in part by the discovery, application and popularity of the auditory brainstem response (ABR). Another important factor, which has facilitated the recent clinical popularity of ECochG in particular, is the development and refinement of non-invasive recording techniques. Early electrocochleographers (e.g., Ruben, et al., 1960; Yoshie, Ohashi, and Suzuki, 1967; Aran and LeBert, 1968) performed their measurements on patients undergoing middle ear surgery and/or used a non-surgical approach that involved passing a needle electrode through the tympanic membrane (TM) to rest on the cochlear promontory. Although this "transtympanic" (TT) approach to ECochG is still used widely in Europe, invasive recording methods have not been well accepted in the United States. Fortunately, ECochG components can also be measured non-invasively from "extratympanic" (ET) sites such as the ear canal or, preferably, from the lateral surface of the TM. Sohmer and Feinmesser (1967), Coats and Dickey (1970), and Cullen et al. (1972), performed pioneering work in this area. A more thorough description and discussion of TT versus ET recording approaches are presented later in this article.
The technical capability to record cochlear and auditory nerve potentials in humans has led to a variety of clinical applications for ECochG. These applications, in turn, will expand as we continue to learn more about transduction processes in the cochlea, and also as we refine our recording approaches to make them more sensitive and reliable. The most popular applications for ECochG at the present time, however, include the:
- diagnosis/assessment/monitoring of Meniere's disease/endolymphatic hydrops and the assessment/monitoring of treatment strategies for these disorders;
- enhancement of wave I of the ABR in the presence of hearing loss or less than optimal recording conditions;
- measurement and monitoring of cochlear and auditory nerve function during surgery involving the auditory periphery (Ruth, Lambert and Ferraro, 1988; Ferraro and Krishnan; 1997).
CM, SP and AP
As indicated in the preceding section, the potentials most often recorded via ECochG include the CM, SP and AP. Detailed descriptions of these electrical events are abundant in the hearing science literature and beyond the scope of this article. The reader is urged to review this literature to gain a better understanding and appreciation of the specific features of these potentials and their relevance to hearing function. Some of the key features related to the recording of the CM, SP and AP in humans are presented below in "bullet" form.
CM
- An alternating current (AC) voltage that mirrors the waveform of the acoustic stimulus at low-moderate levels of stimulation.
- Generated predominantly by the outer hair cells of the organ of Corti.
- Reflects predominantly basal-end cochlear activity when recorded from the round window and more remote sites.
- Phase and duration are stimulus dependent.
- Often difficult to separate from stimulus artifact in non-invasive recordings.
- Is inhibited in response to stimuli presented in alternating polarity.
- Effectiveness in the differential diagnosis of inner ear/auditory nerve disorders has yet to be established, but has received recent attention in the diagnosis of auditory neuropathy.
- A Direct Current (DC) that reflects the time-displacement pattern of the cochlear partition in response to the stimulus envelope (Dallos, 1973).
- Generated predominantly by the outer hair cells of the organ of Corti
- Seen as a DC (unidirectional) shift in the CM baseline. The direction of this shift (i.e., positive or negative) is dependent on a complex interaction between stimulus parameters and the location of the recording electrodes.
- SP duration is dependent on the duration of the acoustic stimulus.
- Independent of stimulus phase, but tends to be obscured by the CM or stimulus artifact when recorded in response to stimuli presented in condensation or rarefaction polarity.
AP
- An AC potential that represents the summed response of the synchronous firing of several thousand auditory nerve fibers.
- Dominated by the contributions of high-frequency nerve fibers when generated in response to transient stimuli with rapid onsets (such as broad-band clicks) (Kiang, 1965)
- Occurs at the onset of the stimulus, even for tonebursts.
- Characterized by a series of brief, predominantly negative peaks. N1 and N2 (the first and second negative peaks of the AP) are virtually the same components as waves I and II of the ABR.
- Independent of stimulus phase and duration.
Currently, perhaps the most popular application of the AP involves the measurement of its magnitude in comparison to that of the SP in patients suspected of having MD/ELH. As described earlier, an enlarged SP often characterizes the ECochGms of patients with MD/ELH. The clinical consistency of this finding, however, improves considerably when the SP amplitude is compared to the amplitude of N1 to form the SP/AP amplitude ratio (Coats, 1981). It is now widely accepted among those of us who routinely perform ECochG that an enlarged SP/AP amplitude ratio is a positive finding for ELH.
Recording Techniques
Transtympanic versus Extratympanic ECochG
As mentioned in the introduction, there are two, general approaches for recording ECochG: Transtympanic (TT) and Extratympanic (ET). TT ECochG is an invasive procedure that involves passing a needle electrode through the TM to rest on the cochlear promontory. During surgeries that expose the middle ear space, TT recordings can also be made with a ball electrode on the round window via the surgical field. Most audiologists who perform ECochG in the clinic prefer ET approaches, wherein recordings are performed with an electrode resting against the skin of the ear canal or surface of the TM. For the latter recording site, the procedure is also referred to as "Tympanic (or TM) ECochG" (Ferraro and Ferguson, 1989), even though this approach is still considered to be ET. Figure 2 is a drawing of the TM electrode used in our clinic/laboratory. Details regarding its fabrication and placement can be found in Ferraro (1997; 2000). As noted in Figure 2, the electrode tip consists of a small piece of foam rubber impregnated with conductive gel. Recently, we have replaced the foam rubber with soft cotton and achieved excellent results with less discomfort to the patient.
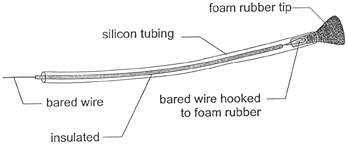
Figure 2. Construction of the Tymptrode (foam rubber tip can be replaced with soft cotton).
Both TT and ET approaches to ECochG have advantages and disadvantages. The primary advantage of the TT approach is that the close proximity of the recording electrode to the response generators provides for a very favorable signal-to-noise ratio. This "near-field" situation results in large components with relatively little signal averaging. The major limitation of TT ECochG is that it is invasive and requires the assistance of a physician in a medical setting. In addition, penetrating the TM with a needle tends to be painful, even when local anesthetics are used.
By comparison, ET recordings require more signal averaging and the components tend to be smaller in amplitude than their TT counterparts. However, ET approaches are generally painless and can be performed by audiologists in non-medical settings without the use of sedation/local anesthesia.
As indicated above, we favor the TM as a recording site for ECochG. The TM offers a good compromise between ear canal and TT placements with respect to component magnitudes and signal averaging time, and the procedure remains non-invasive and, if done correctly, painless (Lambert and Ruth, 1988; Ferraro, Thedinger, et al., 1994; Ferraro, Blackwell, et al., 1994; Schoonhoven, Fabius and Grote, 1995). We also have shown that the waveform patterns leading to the interpretation of the ECochGm are preserved in TM recordings when compared to TT measurements (Ferraro, Thedinger, et al., 1994). Care must be taken, however, when placing the electrode on the highly sensitive TM. This approach sometimes can result in more patient discomfort than is customary for other, non-invasive approaches, but certainly not as much as is usually associated with TT ECochG. Also as mentioned earlier, using soft cotton as opposed to foam rubber for the tymptrode tip alleviates/eliminates patient discomfort.
Recording Parameters
ECochG components generally occur within a latency epoch of 10 milliseconds (ms) following stimulus onset, and are therefore considered to be in the family of "early- or "short-latency" AEPs (Picton, Hillyard, et al., 1974). Table 1.illustrates the parameters used in our laboratory/clinic for recording the SP and AP together, which are the components of interest when ECochG is used in the diagnosis of MD/ELH. These parameters are similar to those used for recording the ABR, with the following exceptions:
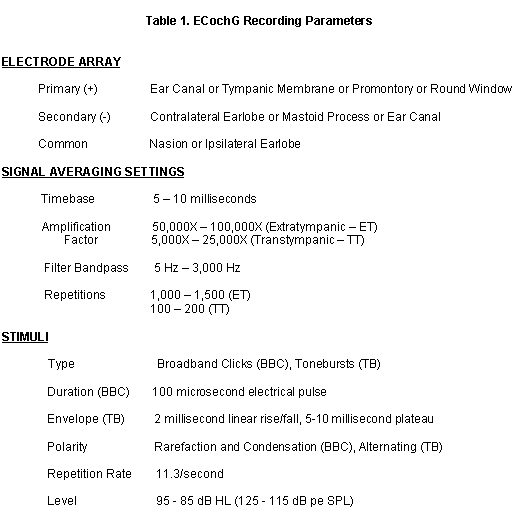
- the primary/non-inverting/(+) recording electrode is designed for placement on the TM as opposed to the scalp/earlobe. This configuration will display the AP as a negative or downward deflection (it is conventional to display ABR components as upward/positive deflections);
- the low frequency setting of the bandpass filter is lowered to accommodate the SP (a DC component).
The broadband click tends to be the most popular stimulus for short-latency AEPs because it excites synchronous discharges from a large population of neurons to produce well-defined components. Likewise, 100 microseconds is a popular choice for the duration of the rectangular pulse that produces the click because the first spectral null for a click of this duration occurs at 10,000 Hz. (i.e., 1/100 microseconds). In reality, the spectrum of the acoustic signal reaching the cochlea is not flat, nor as wide as 10,000 Hz due to the limited frequency range of the acoustic transducer as well as the filtering effects of the outer and middle ears.
The brevity of the click makes it a less-than- ideal stimulus for studying cochlear potentials, since the duration of both the CM and SP are stimulus-dependent. Both of these components appear as brief deflections when evoked by clicks (see Figure 1). Despite this limitation, the use of clicks has proven effective in evoking the SP-AP complex for certain ECochG applications, even though the duration of the SP is abbreviated under these conditions (Durrant and Ferraro, 1991).
Although the click continues to remain popular for ECochG, the use of tonal stimuli also has been applied in several recent studies. (Levine, Margolis et al., 1992; Ferraro, Blackwell et al., 1994; Ferraro, Thedinger et al., 1994; Koyuncu, Mason and Shinkwin, 1994; Margolis, Rieks et al., 1995). Tonal stimuli generally provide for a higher degree of response frequency specificity than clicks, and the use of extended-duration stimuli such as tonebursts allows for better visualization of the SP and CM (Durrant and Ferraro, 1991).
Stimulus polarity is an important factor for ECochG. Presenting clicks or tonebursts in alternating polarity inhibits the presence of stimulus artifact and CM, which are both dependent on stimulus phase. Stimulus artifact can sometimes be large enough to obscure early ECochG components, and the CM can overshadow both the SP and AP. Since both the SP and AP are independent of stimulus phase, the use of alternating-polarity stimuli is preferable when the amplitudes of these components are of interest (such as in the diagnosis of MD/ELH). Recording separate responses to condensation and rarefaction clicks also has been shown to be useful in the diagnosis of MD/ELH, as certain subjects with this disorder display abnormal AP latency differences to clicks of opposing polarity (Margolis and Lilly, 1989; Levine, Margolis, et al., 1992; Margolis, Levine, et al., 1992; Orchik, Shea and Ge, 1993; Margolis, Rieks, et al., 1995; Sass, Densert, et al.,1997). We measure responses to condensation and rarefaction clicks separately to assess the AP-N1 latency difference, then add the waveforms together off-line to derive the SP and AP amplitudes and their ratio.
For ECochG, as with many signal-averaged AEPs, it is important that the cochlear/neural response to one stimulus be complete before the next stimulus is presented. Increasing this rate beyond 10 - 30/second may cause some adaptation of the AP (Suzuki and Yamane, 1982). Theoretically, rates on the order of 100/second cause maximal suppression of the AP while leaving the SP relatively unaffected. Gibson, Mofffat and Ramsden (1977) and Coats (1981) applied this approach to maximize visualization of the SP. Unfortunately, the use of very fast stimulus repetition rates has not proven to be very successful in the clinic, in part because the AP contribution is not completely eliminated and the SP may also be reduced (Durrant and Ferraro, 1991). Additionally, rapid clicks presented at loud levels tend to be obnoxious for patients.
When ECochG is performed to help diagnose MD/ELH, the signal should be intense enough to evoke a well-defined SP-AP complex. Thus, for this application we begin stimulus presentation at a level near the maximum output of the stimulus generator. Unfortunately, as mentioned earlier, there is a lack of standardization for AEP stimuli regarding signal calibration and dB reference. Common references include dB Hearing Level (HL, or Hearing Threshold Level ((HTL))), dB Sensation Level (SL), and dB peak equivalent Sound Pressure Level (pe SPL). We calibrate ECochG signals in both HL and pe SPL. 0 dB HL represents the average behavioral threshold of a group of normally hearing subjects to the various stimuli used for ECochG (e.g., clicks, and tonebursts). For dB pe SPL, we use an oscilloscope to match the level of the click to that of a 1,000 Hz continuous sinusoid. Consistent with the findings of Stapells et al. (1982), 0 dB HL for clicks corresponds to approximately 30 dB pe SPL.
Masking of the contralateral ear is not a concern for conventional ECochG since the magnitude of any electrophysiological response from the non-test ear is very small. In addition, ECochG components are generated prior to crossover of the auditory pathway.
A final note regarding stimuli relates to stimulus artifact, which can be quite large for ECochG because of the nature of ET (especially TM) electrodes. These wire devices also serve as antennae that are very receptive to electromagnetic radiation from the transducer and other electrical sources in the environment. The following suggestions are offered to help to reduce stimulus artifact:
- use a tubal insert transducer;
- separate the transducer and its cables from the electrode and its cables;
- braid the electrode cables;
- test subjects in sound booth with the examiner and AEP unit located outside of the booth; the windows of the booth should be shielded with a copper screen;
- plug the AEP unit into an isolated socket equipped with a true-earth ground;
- use a grounded cable for the primary electrode (such cables are commercially available);
- turn off the lights in the testing room and unplug unnecessary electronic equipment (it also may be necessary to turn off the lights in the examiner room);
- consider encasing the transducer in grounded Mu metal shielding.
Figure 3 depicts a normal ECochGm to click stimuli recorded from the TM. Stimulus level was 95 dB HL, and click polarity was alternated to favor the SP and AP. For TM ECochG we prefer to measure the "absolute" or peak-to-peak amplitudes of the SP and AP (left panel) as opposed to using a baseline reference (right panel) advocated by others (e.g., Margolis, Levine, et al., 1992; Ruth, 1994). The reason for this choice relates to the considerable lability of the baseline amplitude for ET recordings. Using peak-to-peak values from our laboratory, normal SP amplitudes measured from the TM to 95 dB HL clicks range from 0.1 - 0.8 microvolts, with a mean of 0.4 microvolts. AP amplitudes range from 0.6 - 2.7 microvolts, with a mean of 1.4 microvolts. AP-N1 latency is measured from stimulus onset to the peak of N1 and should be identical to the latency of ABR wave I. At 95 dB HL, our normal N1 latencies generally range from 1.3 - 1.7 ms with a mean of approximately 1.5 ms. When using a tubal insert transducer, these values will be delayed by approximately 0.9 ms. Although labeled in our figure, N2 has received little interest for ECochG applications.
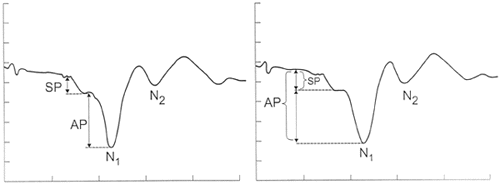
Figure 3. Normal electrocochleogram from the tympanic membrane to clicks presented in alternating polarity at 80 dB HL. The amplitudes of the Summating Potential (SP) and Action Potential (AP) can be measured from peak-to-trough (left panel), or with reference to a baseline value (right panel). Amplitude/time scale is 1.25 microvolts/1 millisecond per gradation. Insert phone delay is 0.90 milliseconds.
Also as shown in Figure 3, SP and AP amplitudes are made from the leading edge of both components. The resultant values are used to derive the SP/AP amplitude ratio.
Our mean SP/AP amplitude ratio to click stimuli for normal subjects is approximately 0.25 + 0.10 standard deviations (SD). Although our normal range for this value extends from 0.10 - 0.50, we consider an SP/AP amplitude ratio greater than 45 % (2 SDs above the norm) to be enlarged.
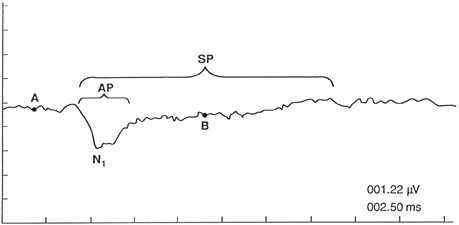
Figure 4. Normal electrocochleogram from the tympanic membrane to a 2,000 Hz toneburst presented in alternating polarity at 80 dB HL. Action Potential (AP) and its first negative peak (N1) are seen at the onset of the response. Summating Potential (SP) persists as long as the stimulus. SP amplitude is measured at midpoint of response (point B), with reference to a baseline value (point A). Amplitude (microvolts)/time (milliseconds) scale at lower right (from Ferraro, Blackwell et al., 1994, pg. 19).
Figure 4 depicts a normal electrocochleogram evoked by a 90 dB HL, 2,000 Hz toneburst (2 ms rise/fall, 10 ms plateau, alternating polarity). As opposed to click-evoked responses where the SP appears as a small shoulder preceding the AP, the SP to tonebursts persists as long as the stimulus. The AP and its N1, in turn, are seen at the onset of the response. We measure SP amplitude at the midpoint of the waveform to minimize the influence of the AP, and with reference to baseline amplitude. Figure 5 illustrates toneburst SPs at several frequencies recorded from both the TM and promontory (TT) of the same patient. An important aspect illustrated in this figure is that the amplitudes of toneburst-SPs are very small in normally hearing subjects. Another noteworthy aspect of Figure 5 is that although the magnitudes of the TM responses are approximately ¼ that of the promontory responses (note amplitude scales), the corresponding patterns of the TM and TT recordings at each frequency are virtually identical.
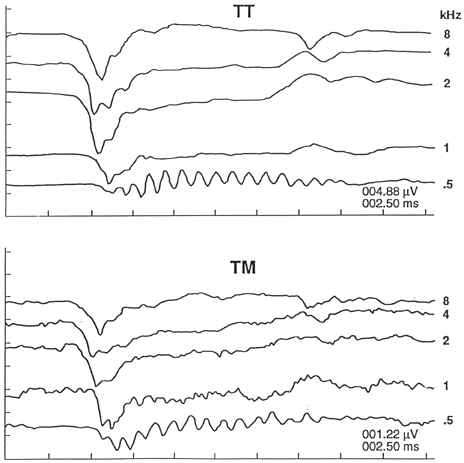
Figure 5. Electrocochleograms evoked by tonebursts of different frequencies presented at 80 dB HL. Stimulus frequency in kHz indicated at the right of each waveform. Amplitude (microvolts)/time (milliseconds) scale at lower right (from Ferraro, Blackwell et al., 1994, pg. 20).
Clinical Applications
MD/ELH
As mentioned earlier in this chapter, ECochG has emerged as one of the more powerful tools in the diagnosis, assessment and monitoring of MD/ELH, primarily through the measurement of the SP and AP. Examples of this application are shown in Figures 6 (click-evoked ECochGm), 7 (toneburst-evoked ECochGms). The upper tracings in both figures were measured from the promontory (TT), whereas the lower waveforms represent TM recordings. For the click-evoked ECochGms in Figure 6, the SP/AP amplitude ratios (based on absolute SP and AP amplitudes) were approximately 1.0 and 2.0 for the TT and TM recordings, respectively. Both values are enlarged beyond our normal limit of 0.45. Thus, despite different recording approaches that led to different values for the SP/AP amplitude ratio, both TT and TM ECochGms were positive for MD/ELH. Also notable in Figure 6 is the instability of the TM waveforms' baseline voltages compared to those of the TT recordings. As mentioned in the previous section, this instability is the reason we prefer to measure absolute as opposed to baseline-referenced component amplitudes. Had the SP and AP amplitudes been measured with respect to a baseline voltage, SP/AP amplitude ratios would have been approximately 0.50 (TT) and 0.75 (TM).
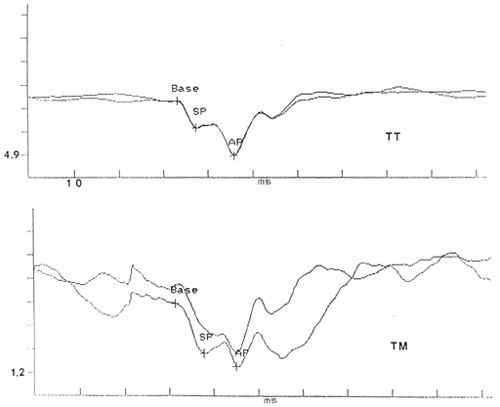
Figure 6. Abnormal responses to clicks recorded from the promontory (TT) (upper panel) and tympanic membrane (TM) (lower panel) of the affected ear of the same patient. Both TT and TM responses display an enlarged Summating Potential (SP)/Action Potential (AP) amplitude ratio. "Base" indicates reference for SP and AP amplitude measurements. Amplitude (microvolts)/time (milliseconds) scale at lower right. Stimulus onset delayed by approximately 2 milliseconds (from Ferraro, Thedinger, et al., 1994, pg. 27).
SP amplitudes for the toneburst ECochGms in Figure 7 vary slightly across frequencies. However, a pronounced SP trough is seen in all tracings, once again regardless of recording approach. In addition, the measurement of interest for toneburst responses is the magnitude of the SP trough rather than the SP/AP amplitude ratio.
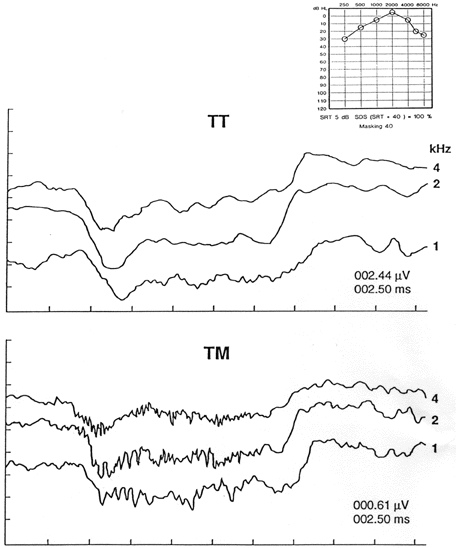
Figure 7. Abnormal responses to tonebursts recorded from the promontory (TT) (upper panel) and tympanic membrane (TM) (lower panel) of the affected ear of the same patient. All tracings show an amplitude-enlarged Summating Potential. Toneburst frequency in kHz indicated at the right of each tracing. Amplitude (microvolts)/time (milliseconds) scale at lower right. Puretone audiogram at upper right (from Ferraro, Thedinger et al., 1994, pg. 26).
The reported incidence of an enlarged SP and SP/AP amplitude ratio in the general Meniere's population is only approximately 60%-65% (Coats, 1981; Gibson, Moffat and Ramsden, 1977; Kitahara, Takeda, Yazawa, et al., 1981; Kumagami, Nishida and Baba, 1982). Thus, researchers continue to seek ways to improve the sensitivity of ECochG (i.e., the percentage of MD/ELH patients who display positive ECochGms).
One way to make ECochG more sensitive is to test patients when they are experiencing symptoms of MD/ELH. Ferraro, Arenberg and Hassanein (1985), for example, found positive ECochGms in over 90% of patients who were symptomatic at the time of testing and whose symptoms included aural fullness and hearing loss.
Other approaches to increasing the sensitivity of ECochG have been directed towards the parameters associated with recording and interpreting the ECochGm. As mentioned earlier, an example of such a method involves measuring the AP-N1 latency difference between responses to condensation versus rarefaction clicks. According to Margolis, Rieks, et al. (1995) a difference greater than 0.38 ms. is a positive finding for endolymphatic hydrops. We have recently begun to measure the SP/AP area ratio in an effort to make ECochG more sensitive (Ferraro and Tibbils, 1999). This approach is illustrated in Figure 8. The waveforms in the left panel are from a normal subject, whereas the right tracings are from a patient suspected of having MD/ELH.
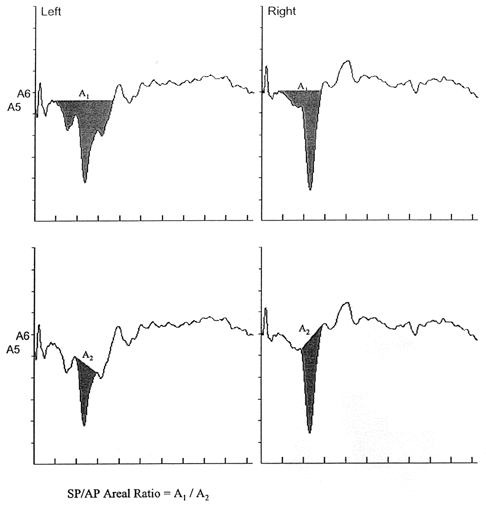
Figure 8. Method for measuring the areas of the Summating Potential (SP) and Action Potential (AP) to click stimuli to derive the SP/AP area ratio. Shaded portions represent the area of each component. Electrocochleogram in the left panel is from a normal subject. Electrocochleogram in the right panel is from a patient suspected of having Meniere's disease and displays an enlarged SP area and SP/AP area ratio (from Ferraro and Tibbils, 1999, pg. 24).
As a final note regarding the use of ECochG in the diagnosis of MD/ELH, enlarged SP/AP amplitude ratios also have been reported for perilymphatic fistulae (Kobayashi, Arenberg, et al., 1993; Ackley, Ferraro and Arenberg, 1994). Thus, the underlying feature to which ECochG may be specific is the fluid pressure of the scala media, which can be altered by pressure changes in the scalae vestibuli and tympani (as in a fistula) or ELH.
Enhancement of Wave I
In hard of hearing subjects, including those with acoustic tumors, wave I of the ABR may be reduced, distorted or absent despite the presence of an identifiable wave V (Hyde and Blair, 1981; Cashman and Rossman, 1983). This situation significantly reduces the diagnostic utility of the ABR since the I-V and III-V interwave intervals (IWIs) are immeasurable. Under these and other "less than optimal" recording conditions (e.g., noisy electrical and/or acoustical environment, restless subject), simultaneous recording of the AP-N1 via ECochG and the ABR has been applied (Ferraro and Ferguson, 1989; Ferraro and Ruth, 1994). Figure 9 illustrates the combined ECochG-ABR approach. Wave I is absent in the presence of wave V in the conventionally recorded ABR for this patient (top tracings). However, when the ABR is recorded using a vertex (+)-to-TM (-) electrode array (bottom tracings), N1 is identifiable, permitting the measurement of the N1-V IWI.
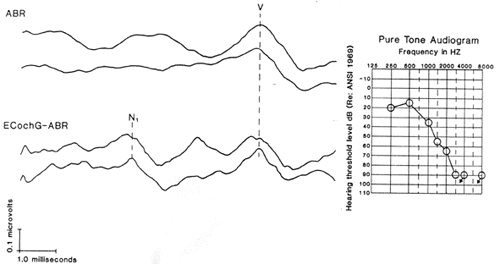
Figure 9. ABR recorded with a vertex (+)-to-ipsilateral earlobe (-) electrode array, and ECochG-ABR recorded with a vertex (+)-to-ipsilateral tympanic membrane (-) electrode array from a patient with hearing loss. Wave I is absent in the conventional ABR tracings but recordable with the ECochG-ABR approach (From Ferraro and Ferguson, 1989, pg. 165).
Intraoperative Monitoring
Intraoperative monitoring of inner ear and auditory nerve status during surgeries that involve the peripheral auditory system has become an important application for ECochG. Such monitoring usually is done to help the surgeon avoid potential trauma to the ear/nerve in an effort to preserve hearing (Lambert and Ruth, 1988; Ferraro and Ruth, 1994). In addition, intraoperative ECochG recordings may be helpful in the identification of anatomic landmarks (such as the endolymphatic sac) (Gibson and Arenberg, 1991). Finally, ECochG monitoring has been examined as a method to help predict post-operative outcome, especially for patients undergoing endolymphatic decompression/shunt surgery for the treatment of MD/ELH (Gibson, Arenberg and Best, 1988; Gibson and Arenberg, 1991; Arenberg, Gibson and Bohlen, 1993; Wazen, 1994; Mishler, Loosmore, et al., 1994).
Auditory Neuropathy
As indicated earlier in this article, the use of the ECochG (or an ECochG approach to recording the ABR) has attracted recent interest as a tool in the diagnosis of auditory neuropathy/auditory processing disorders (AN). Some studies have shown that the presence of CM in the absence of ABR components may uncover AN in children (Berlin, Bordelon, St. John, Wilensky, Hurley, Kluka & Hood., 1998; Starr, Sininger, Nguyen, Michalewski, Oba & Abdala, 2001). Figure 10 from Starr, et al. (2001, page 93). Illustrates this approach. In these tracings, the ABR was recorded in response to condensation (C) and rarefaction (R) clicks from a normally hearing child, and a 4-year old with auditory neuropathy. The normal tracings indicate ABR components along with CM and SP, which can be enhanced or reduced by adding or subtracting responses to C and R clicks. The top tracings in the auditory neuropathy recordings (C & R) illustrate early, cyclic activity whose phase appears to be dependent on stimulus polarity, but no, discernible ABR components. When these tracings are added together (C + R), the phase-dependent activity (i.e., CM) is cancelled, leaving only the SP component, which is independent of stimulus phase. When the tracings are subtracted (C-R), the CM is enhanced. The implication here is that the presence of CM and/or SP (i.e., cochlear hair cell potentials) in the absence of subsequent ABR components is a positive finding for AN. Although this approach holds some promise as a diagnostic indicator for AN, caution must be exercised in the interpretation of the CM. That is, electromagnetic artifact from the stimulus transducer also introduces cyclic activity that mirrors the acoustic waveform and reverses its phase with stimulus polarity. The keys to differentiating between stimulus artifact and CM are:
- stimulus artifact is seen at the very onset of the waveform, whereas the CM appears after a brief ( 1 - 1.5 ms) latency period due to stimulus travel time through the sound tube and outer and middle ears; and
- stimulus artifact will persist and CM will disappear when the sound tube is clamped, but left in place.
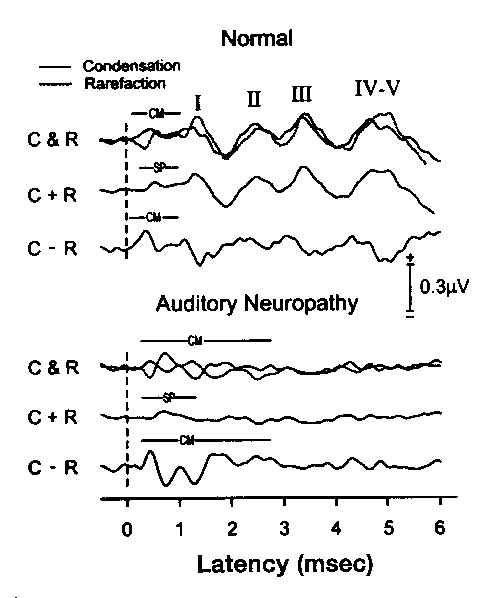
Figure 10. ABR recorded in response to Condensation (C) and Rarefaction (R) clicks from a normal child and a 4 year-old with auditory neuropathy. The normal tracings illustrate ABR components along with cochlear microphonic (CM) and summating potential (SP), which can be enhanced or reduced by adding or subtracting responses to C and R clicks. In the auditory neuropathy tracings, CM and SP are seen in the absence of ABR components (from Starr, Sininger, Nguyen, Michalewski, Oba and Abdala, 2001, page 93).
In our laboratory, we have found it necessary to shield the stimulus transducer with Mu metal and use a grounded electrode cable to minimize electromagnetic artifact when recording the CM.
Other Applications
The most popular applications for ECochG are those described above. However, other uses, such as estimation of hearing thresholds, have been reported (Laureano, Murray, et al. 1995). Ferraro and Ferguson (1989) found no differences between TM-recorded AP and conventionally recorded wave V thresholds in normally hearing individuals. Wave V threshold, of course, often is used to estimate hearing sensitivity in infants and other difficult-to-test populations.
Despite the above studies, it is unlikely that ECochG will emerge as a "tool of choice" for estimating hearing sensitivity. In most cases, other electrophysiological and behavioral approaches that tend to be more accurate and are easier and take less time to administer, are available. This is not to say, however, that the relationship between ECochG and hearing status should not continue to be studied. Lilly (personal communication), for example, has reported on the utility of ECochG for estimating hearing reserve in cochlear implant candidates. Schoonhoven, Fabius and Grote(1995), found a relationship between the slopes of AP input-output functions measured from the TM and cochlear recruitment. Keith, Kereiakes, et al., (1992) used ECochG to assess the integrity of the inner ear prior to stapedectomy surgery in a patient who was unable to be tested behaviorally.
In summary, ECochG continues to useful in the evaluation of inner ear and auditory nerve function for a variety of clinical applications. This basic premise persists in the face of continued controversy regarding how ECochG is recorded, interpreted and used. Increased attention to resolving these controversies and to expanding current applications of ECochG are apparent in the recent literature, which bodes well for the future of this very useful, clinical tool.
References
Ackley RS, Ferraro JA, Arenberg IK. (1994). Diagnosis of patients with perilymphatic fistula. Seminars in Hearing 15:37-41.
American Speech-Language-Hearing Association (1988). The short latency auditory evoked potentials: a tutorial paper by the Working Group on Auditory Evoked Potential Measurements of the Committee on Audiologic Evaluation.
Aran JM, Lebert G. (1968). Les responses nerveuse cochleaires chex l'homme, image du fonctionnement de l'oreille et nouveau test d'audiometrie objectif. Revue de Laryngologie, Otologie, Rhinologie (Bordeaux) 89:361-365.
Arenberg IK, Gibson WPR, Bohlen HKH. (1993). Improvements in audiometric and electrophysiologic parameters following nondestructive inner ear surgery utilizing a valved shunt for hydrops and Meniere's disease. Proceedings of the Sixth Annual Workhops on Electrocochleography & Otoacoustic Emission, International Meniere's Disease Research Institute, pp. 545-561.
Berlin CI, Bordelon J, St. John P, Wilensky D, Hurley A, Kluka E, Hood L (1998). Reversing click polarity may uncover auditory neuropathy in infants. Ear and Hearing 19:37-47.
Cashman M, Rossman R. (1983). Diagnostic features of the auditory brainstem response in identifying cerebellopontine angle tumors. Scand Audiol 12:35-41.
Coats AC. (1981). The summating potential and Meniere's disease. Arch Otolaryngol 104:199-208.
Coats AC. (1986). Electrocochleography: Recording technique and clinical applications. Seminars in Hearing 7:247-266.
Coats AC, Dickey JR. (1970). Non-surgical recording of human auditory nerve action potentials and cochlear microphonics. Ann Otol Rhinol Laryngol 29:844-851.
Dallos P. (1973). The auditory periphery: Biophysics and physiology. New York: Academic Press.
Dallos P, Schoeny ZG, Cheatham MA (1972). Cochlear summating potentials: Descriptive aspects. Acta Otolaryngologica 301(suppl.):1-46.
Davis H. (1968). Mechanisms of the inner ear. Ann Otol Rhinol Laryngol 77:644-656.
Durrant, JD (1986). Combined ECochG-ABR approach versus conventional ABR recordings. Seminars in Hearing, 7:289-305.
Durrant JD, Ferraro JA (1991). Analog model of human click-elicited SP and effects of high-pass filtering. Ear and Hearing 12:144-148.
Engebretson AM, Eldridge DH. (1968). Model for the nonlinear characteristics of cochlear potentials. J Acoust Soc Am 44:548-554.
Ferraro JA. (1997). Laboratory Exercises in Auditory Evoked Potentials. San Diego: Singular Publishing Group, Inc.
Ferraro JA (2000). Electrocochleography. In RJ Roeser, M Valente and H Hosfort-Dunn (Eds.). Audiology Diagnosis. New York/Stuttgart: Thieme, pp. 425-450.
Ferraro JA, Arenberg IK, Hassanein RS. (1985) Electrocochleography and symptoms of inner ear dysfunction. Arch Otolaryngol 111:71-74.
Ferraro JA, Best LG, Arenberg IK. (1983). The use of electrocochleography in the diagnosis, assessment and monitoring of endolymphatic hydrops. Otolaryngol Clin No Am 16:69-82.
Ferraro JA, Blackwell W, Mediavilla SJ, Thedinger B. (1994). Normal summating potential to tonebursts recorded from the tympanic membrane in humans. J Am Acad Aud 5:17-23.
Ferraro JA, Ferguson R. (1989). Tympanic ECochG and conventional ABR: A combined approach for the identification of wave I and the I-V interwave interval. Ear and Hearing
3:161-166.
Ferraro JA, Krishnan G. (1997). Cochlear potentials in clinical audiology. Audiology & Neuro-Otology 2:241-256.
Ferraro JA, Thedinger B, Mediavilla SJ, Blackwell W. (1994). Human summating potential to tonebursts: Observations on TM versus promontory recordings in the same patient. J Am Acad Aud 6:217-224.
Ferraro JA, Tibbils R. (1999). SP/AP area ratio in the diagnosis of Meniere's disease. Am J Aud 8:21-27.
Gibson WPR. (1978). Essentials of Electric Response Audiometry. New York:Churchill and Livingstone.
Gibson, WPR, Arenberg IK, Best LG. (1988). Intraoperative electrocochleographic parameters following nondestructive inner ear surgery utilizing a valved shunt for hydrops and Meniere's disease. In: Nadol JG, ed. Proceedings of the Second International Symposium on Meniere's Disease. Amsterdam: Kugler and Ghedini Publications, pp. 170-171.
Gibson WPR, Arenberg IK. (1991). The scope of intraoperative electrocochleography. In: Arenberg IK, ed. Proceedings of the Third International Symposium and Workshops on the Surgery of the Inner Ear. Amsterdam: Kugler Publications, pp. 295-303.
Gibson WPR, Moffat DA, Ramsden RT. (1977). Clinical electrocochleography in the diagnosis and management of Meniere's disorder. Audiology 16:389-401.
Goin DW, Staller SJ, Asher DL, Mischke RE. (1982). Summating potential in Meniere's disease. Laryngoscope 92:1381-1389.
Gulick WL, Gescheider GA, Frisina RD. (1989). Hearing: Physiological Acoustics, Neural Coding, and sychoacoustics. New York: Oxford University Press.
Hyde ML, Blair RL. (1981). The auditory brainstem response in neuro-otology: Perspectives and problems. J Otololaryng 10:117-125.
Keith RW, Kereiakes TJ, Willging JP, Devine J. (1992). Evaluation of cochlear function in a patient with 'far-advanced' otosclerosis. Am J Otol 13:347-349.
Kiang NS. (1965). Discharge patterns of single nerve fibers in the cat's auditory nerve. Research Monograph 35. Cambridge, MA: MIT Press.
Kitahara M, Takeda T, Yazama T. (1981). Electrocochleography in the diagnosis of Meniere's disease. In: Volsteen KH, ed. Meniere's Disease, Pathogenesis, Diagnosis and Treatment. New York: Thieme-Stratton, pp. 163-169.
Kobayashi H, Arenberg IK, Ferraro JA, Van der Ark G. (1993). Delayed endolymphatic hydrops following acoustic tumor removal with intraoperative and postoperative Auditory Brainstem Response improvements. Acta Otolaryngol (Stockh) 504(suppl.):74-78.
Koyuncu M, Mason SM, Shinkwin C. (1994). Effect of hearing loss in electrocochleographic investigation of endolymphatic hydrops using tone-pip and click stimuli. J Laryngol Otol 108:125-130.
Kumagami H, Nishida H, Masaaki B. (1982). Electrocochleographic study of Meniere's disease. Arch Otol 108:284-288.
Lambert P, Ruth RA. (1988). Simultaneous recording of noninvasive ECoG and ABR for use in intraoperative monitoring. Otolaryngology - Head and Neck Surgery 98:575-580.
Laureano AN, Murray D, McGrady MD, Campbell KCM. (1995). Comparison of tympanic membrane-recorded electrocochleography and the auditory brainstem response in threshold determination. Am J Otol 16:209-215.
Levine SM, Margolis RH, Fournier EM, Winzenburg SM. (1992). Tympanic electrocochleography for evaluation of endolymphatic hydrops. Laryngoscope 102:614-622.
Lilly DJ. (1997). Personal communication.
Margolis RH, Levine SM, Fournier MA, Hunter LL, Smith LL, Lilly DJ. (1992). Tympanic electrocochleography: Normal and abnormal patterns of response. Audiology 31:18-24.
Margolis RH, Rieks D, Fournier M, Levine SM.(1995). Tympanic electrocochleography for diagnosis of Meniere's disease. Arch Otolaryngol Head & Neck Surg 121:44-55.
Margolis RH, Lilly DJ. (1989). Extratympanic electrocochleography: Stimulus considerations. Asha 31:183(A).
Mishler ET, Loosmore JL, Herzog JA, Smith PG, Kletzker GK. (1994). The efficacy of electrocochleography in monitoring endolymphatic shunt procedures. Ann Meet Am Neuro-Otol Soc , p. 45(A).
Moriuchi H., Kumagami H. (1979). Changes of AP, SP and CM in experimental endolymphatic hydrops. Audiology 22:258-260.
Morrison AW, Moffat DA, O'Connor AF. (1980). Clinical usefulness of electrocochleography in Meniere's disease: An analysis of dehydrating agents. Otolaryngologic Clin No Am 11:703-721.
Orckik DJ, Shea JJ Jr., Ge X. (1993). Transtympanic electrocochleography in Meniere's disease using clicks and tone-bursts. Am J Otol 14:290-294.
Orchik JG, Ge X, Shea JJ. (1997). Action potential latency shift by rarefaction and condensation clicks in Meniere's disease. Am J Otol 14:290-294.
Picton TW, Hillyard SH, Frauz HJ, Galambos R. (1974). Human auditory evoked potentials. Electroenceph Clin Neurophysiol 36:191-200.
Ruth RA. (1990). Trends in electrocochleography. J Am Acad Aud 1:134-137.
Ruth RA. (1994). Electrocochleography. In: Katz J, ed. Hanbook of Clinical Audiology, Fourth Edition. Baltimore:Williams & Wilkins, pp. 339-350.
Ruth RA, Lambert PR, Ferraro JA. (1988). Electrocochleography: Methods and clinical applications. Am J Otol 9:1-11.
Ruben R, Sekula J, Bordely JE. (1960). Human cochlear responses to sound stimuli. Ann Otorhinolaryngol 69:459-476.
Sass K, Densert B, Arlinger S. (1997). Recording techniques for transtympanic electrocochleography in clinical practice. Acta Otolaryngol (Stockh) 118:17-25.
Schmidt P, Eggermont J, Odenthal D. (1974). Study of Meniere's disease by electrocochleography. Acta Otolaryngologica 316(suppl.):75-84.
Schoonhoven R, Fabius MAW, Grote JJ. (1995). Input/output curves to tonebursts and clicks in extratympanic and transtympanic electrocochleography. Ear & Hearing 16:619-630.
Sohmer H, Feinmesser M. (1967). Cochlear action potentials recorded from the external canal in man. Ann Otol Rhinol Otolaryngol 76:427-435.
Stapells D, Picton TW, Smith AD. (1982). Normal hearing thresholds for clicks. J Acoust Soc Am 72:74-79.
Starr A, Sininger Y, Nguyen T, Michalewski HJ, Oba S, Abdala C (2001). Cochlear receptor (Microphonic and summating potentials, otoacoustic emissions) and auditory pathway (auditory brains stem potentials) activity in auditory neuropathy. Ear and Hearing 22:91-99.
Suzuki JF, Yamane H (1982). The choice of stimulus in the auditory brain stem response test for neurological and audiological examinations. Annals of the New York Academy of Science 388:731-736.
Tasaki I, Davis H, Eldridge DH. (1954). Exploration of cochlear potentials in guinea pig with a microelectrode. J Acoust Soc Am 26:765-773.
Whitfield IC, Ross HF (1965). Cochlear microphonic and summating potentials and the outputs of individual hair cell generators. J Acoust Soc Am 38:126-131.
Wazen JJ. (1994). Intraoperative monitoring of auditory function: Experimental observation, and new applications. Laryngoscope 104:446-455.
Yoshie N, Ohashi T, Suzuki T. (1967). Non-surgical recording of auditory nerve action potentials in man. Laryngoscope 77:76-85.

