Introduction
New and experienced hearing aid users often describe listening to music as difficult and unnatural. In order to provide the most natural listening experience while listening to music, hearing aid manufacturers continue to develop and refine dedicated music programs, aiming to fulfill the needs and desires of the hearing aid wearer. The effects of hearing instrument processing on musical signals and on the perception of music have received very little attention in research (Wessel, Fitz, Battenberg, Schmeder, & Edwards. 2007). Listeners with hearing loss are no less interested in music than normal hearing listeners, therefore, it is not surprising that those who wear hearing aids often wish to be able to enjoy listening to music with their device rather than removing them because of reduced sound quality (Chasin & Russo, 2004). Listening to music enhances a person’s quality of life, provides a medium for human interaction and models social structures and social competence (Cross, 2006). With these thoughts in mind, the launch of the new Phonak Venture platform aims to address the many needs of today’s countless challenging listening environments, but also pays close attention to the wishes of new and experienced hearing aid users to enjoy the unique characteristics of music. To evaluate the effectiveness of the Phonak Venture music program, an adaption of the ideal profile method (IPM), developed by Worch and colleagues (2013, 2014) has been employed for a study.
Study
Objective
The primary objective of this study was to investigate the Phonak Venture platform music program. The second objective was to perform a benchmark study with other hearing devices in the market. For this purpose, an “ideal profile” has been developed which describes the ideal ratings according to several attributes relevant for investigating the performance of hearing devices when listening to music. Examples of attributes typically encountered in hearing aid music perception can be found in Legarth and colleagues (2012).
Methods
Thirteen subjects (9 males and 4 females, ages ranged from 65 – 81 years) with moderate hearing loss (N3 hearing profile as defined by IEC 60118-15 [Bisgaard, Vlaming & Dahlquist, 2010]) participated in this study. Average audiograms can be seen in Figure 1. All participants were experienced hearing aid users and trained on subjective assessments on acoustical demonstrations as part of their work in evaluating acoustic systems. The methodology was designed, executed, analyzed and interpreted by DELTA SenseLab, a company who specializes in subjective testing of audio and visual stimuli by perceptually evaluating a broad spectrum of systems.
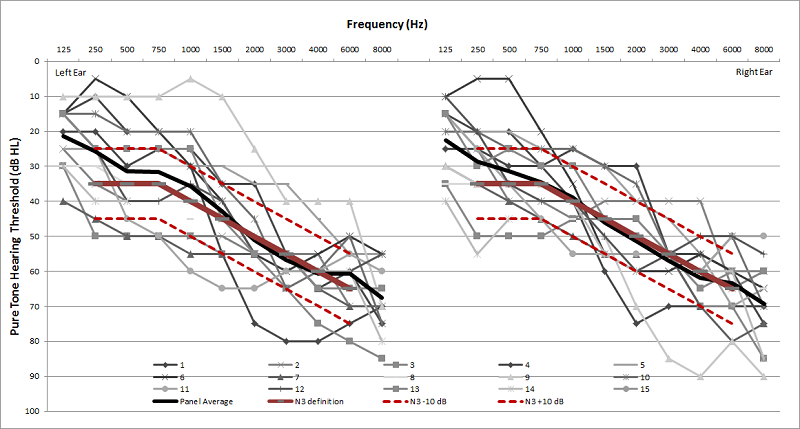
Figure 1. Pure tone audiograms for the hearing impaired listening panel. The thick black line represents the panel average and the thick red line indicate the defined N3 hearing loss profile (Bisgaard, Vlaming, & Dahlquist, 2010). The dashed red lines are marking the +/- 10 dB deviation from the N3 curve.
The study consisted of two parts: the first part identified the sound attributes specific to music that, when optimized, are relevant in acquiring a pleasurable experience with music. The second part was to rate the different test devices according to the defined attributes from part one and to define an “ideal point.” The “ideal point” was defined by using the attributes from part one to symbolize the rating that is most favorable when listening to music with hearing devices with a N3 hearing loss.
Six different hearing aids/settings (D1, D2, D3, D4.1, D4.2, D4.3) were investigated and programmed based on the N3 hearing profile and the special music program of the test devices. The setting of the Phonak Venture devices were modified compared to the standard music program used in the former generation Quest devices by introducing a dual compression approach including fast acting and slow acting dynamic compression, based on the results of a study prior to the work described in this paper. Additionally, different modifications to improved music perception have been investigated, such as varying the high and low frequencies, to check for the influence of bass boost or the equalization (flattening) of the frequency response. A detailed description can be found in Figure 2.
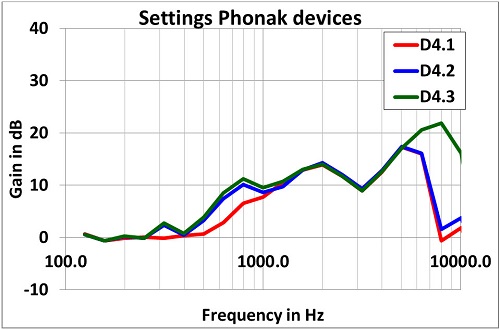
Figure 2. Average frequency response of the three settings of the Phonak V90-312 device (D4.1, D4.2 and D4.3).
A pre-study was performed allowing a hierarchical cluster analysis, and general profile plots were developed to differentiate product characteristics in order to identify similarities and differences between products and to identify those music genres which are primarily relevant. Three different sound samples were utilized representing different music genres (classical, pop, and jazz). Hearing aid recordings were made on a Bruel & Kjaer HATS 4128C placed in the center of a calibrated ITU-R BS.1116-1 stereo loudspeaker set up in a standardized listening room (ITU-R BS. 1116-2)] shown in Figure 3. An experienced fitter placed the hearing aids on the HATS ensuring the dome was centered in the mannequin’s ear canal and that the backend of the dome was securely in the ear canal with the hearing aid case resting on the pinna and flush with the side of the head. The acoustical parameters were selected based on settings most appropriate for the hearing loss and the first fit suggestion of the fitting software (for each device). Verification of the hearing aid music program selection and insertion of a fresh battery was completed prior to each recording, which included compensation for ear canal and headphone frequency responses. In part one of the study (attribute definition), test subjects were provided written instruction and their understanding of the task to find which attributes of a music sample are relevant for judging different musical samples was verbally confirmed. Elicited words noted by the test leader were collected to form a working list that led to the final attribute list used to evaluate the music programs in the various hearing aids used in this study.
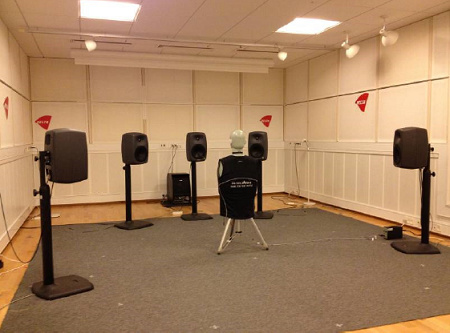
Figure 3. The setup in DELTA’s EBU 3276 standardized listening room for the hearing aid recordings.
The second part of this study included a training session for each attribute using one representative sound sample. A second training session was provided to the subjects to familiarize them with the software program. Both of these sessions were completed prior to testing. Subjects made judgments for all test devices according to the eight attributes (identified in Figure 4) identified in the first part of the study by moving a sliding bar towards the corresponding profile on the scale for each device and for each music genre. After performing all ratings, the subjects were asked to mark the preferred profile on the scale for the attribute being assessed, the “ideal profile”. The "ideal profile" is a projection of the subjects’ desired product characteristics, based on their internal reference and the products currently under evaluation. For determining the “ideal point” no recording was played.
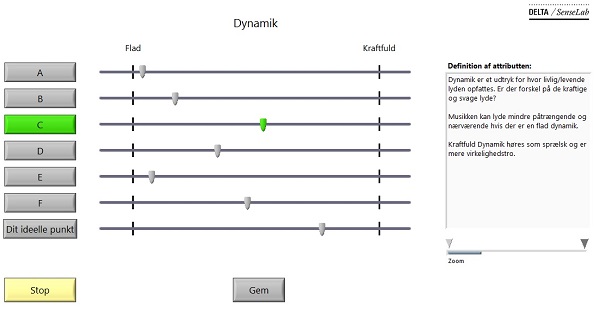
Figure 4. Software screen developed by Delta SenseLab showing the attributes to be rated on the top, a short description of the attribute and the sliders for each test device to be adjusted.
Each individual participated in two one-hour sessions for two days to complete this study. Subjects were instructed to break when necessary and also received reminders every 20 minutes from the software. If the subject was unable to complete the task within one session the test was resumed at the beginning of the next session.
Upon completion of testing, statistical data analysis of the defined attributes included an Analysis of Variance (ANOVA), a principle component analysis (PCA) (a multivariate analysis providing visual clustering of the products with respect to similarities and dominating sound characteristics) and a TUKEY HSD significance test, amongst other analyses. To check for test-retest reliability of the methodology, the ratings of some test devices were conducted twice and the ideal points were determined twice to allow for this comparison.
Results & Discussion
Part One
The attribute list was derived in a consensus attribute process with eight participants.
The following attributes and their respective description were selected:
Timbre balance (scale from “dark” to “bright”). Timbre balance relates to the general perception of the sound reproduction ranging from dark to bright. If the sound is perceived as thin, tenuous, or lacking fullness, it is rated as bright. If the sound is perceived as very bass-heavy and deep, and the bright tones are lacking, the sound should be rated as dark.
Can sound (scale from “a little” to “a lot”). Can sound resembles the sound of old-fashioned phones, or radio broadcasts from the 40’s-50’s. If a lot of can sound is present, the sound is not perceived as being well balanced, due to lack of dark and bright tones. If the sounds is well balanced and no can sound is perceived, it should be placed on the far end left side of the scale.
Shrill (scale from “a little” to “a lot”). Shrill is typically perceived in the reproduction of bright tones from violins, flutes, women’s voices etc. If the sound has a lot of shrillness it is placed on the right side of the scale. If there are no passages where the sound is shrill, it is placed on the far left side of the scale.
Reverberation (scale from “a little” to “a lot”). Reverberation describes whether the sound source is being ‘colored’ by the room. Does it sound like the music is being played in a bathroom, in-door pool, church, or a more damped room like a bedroom? If no reverberation is present in the sample, it is placed on the far left side of the scale.
Loudness (scale from “soft” to “loud”). The overall perceived loudness of the device.
Dynamics (scale from “flat” to “powerful”). Dynamic describes how lifelike the sound is perceived. Are there differences between soft and loud sounds? The music will sound less present if it has flat dynamics. Powerful dynamics will be perceived as more alive and more realistic.
Source separation (scale from “muddy” to “separated”). Source separation describes whether the instruments (including vocal) can be separated from each other in the overall sound image. If the instruments are perceived as being blended and hard to separate, the sound should be assessed close to muddy on the left hand side of the scale. If there is good source separation and the details are easily perceived, the sample should be assessed towards the right end of the scale (separated).
Treble shadow (scale from “a little” to “a lot”). Treble shadow can be perceived as a whisper or hissing on the bright instruments or the vocal. This sounds like there is a sound shadow after the bright tones making them imprecise and less defined. If the treble is very fuzzy, the sound is placed towards the right end of the scale. If the treble is clean and not fuzzy at all, the sound should be assessed at the far left end of the scale.
Part Two
After the ratings in part two were completed, the subjects scored the music recordings according to the "ideal point" that was identified earlier. It is important to mention that the subjects did not listen to the different sound samples when defining the ideal points. The average ratings and the 95%-confidence interval for the ideal points are presented as a spider plot in Figure 5. This figure illustrates all attributes and each scale in one picture. The characteristics of the "ideal profile" can be described as:
- Timbre balance: giving a slightly dark sound
- Very low can sound, treble shadow and shrillness
- Moderate loudness and small reverberation
- High level of source separation and dynamics
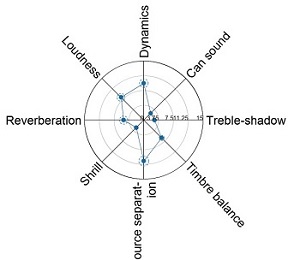
Figure 5. Spider diagram showing the optimal ratings of the subjects when listening to music; this is defined as the “ideal point”.
The rating of the different test devices was made relative to the “ideal point” ratings. Almost all devices were rated equally and on a high level. A spider plot has been provided to differentiate the average ratings and the 95% confidence interval to demonstrate the device ratings (Figure 6). Ratings of the test devices can be described as:
- D1: Device has lowest rating on dynamics, loudness, shrill, reverberation and source separation. Timbre balance is perceived as slightly dark.
- D2: Device has ideal loudness level but with a slightly bright and shrill sound.
- D3: Device shows characteristics close to the "ideal profile" with good source separation and dynamics, low shrillness and can sound and ideal loudness. The timbre balance is slightly brighter than in the "ideal profile".
- D4.1: Device has similar characteristics as D3 but slightly more treble shadow and shrillness and less source separation, but also less reverberation.
- D4.2: Device has very similar profile as D3 and D4.1 but higher on loudness and can sound.
- D4.3: Device has very similar profile as D3 but higher on loudness and slightly more shrill.
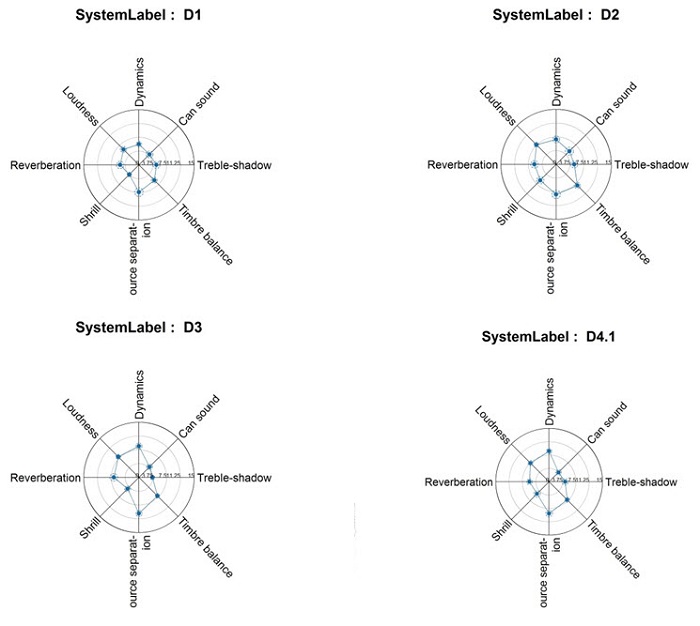
Figure 6. Profile plot of the average ratings of 4 hearing aids/settings for comparison to the "ideal profile" for all 3 music samples.
When comparing the ideal point (Figure 5) with the spider plots shown in Figure 6 it is obvious that the ratings for D3 and D4.1 are closest to the “ideal point”. To statistically confirm this observation, a Principle Components Analysis (PCA) was performed, which should provide a complimentary interpretation. The results are shown in Figures 7 through 10. The PCA resulted into three main dimensions, which explain together 65% of the variance. Dimension 1 (29%) is dominated by the attributes shrill, treble shadow, and can sound. Dimension 2 (23%) embraces the attributes loudness and timbre balance (Figure 7) and Dimension 3 (13%) is related to reverberation (Figure 8). Figures 9 and 10 display the area spanned by Dimension 1 and Dimension 2, and by Dimension 2 and Dimension 3, respectively. They show the average values and 95% confidence interval ellipses of the 6 test devices and the "ideal point" and allows an easy interpretation of the data. It can be concluded that all test devices are statistical different from the "ideal point". Consequently, neither receives the desired ratings of the presented dimensions as the confidence intervals of the "ideal point" and all of the test devices do not overlap. Furthermore, the figure provides a clear statement that test device D3 and D4.1 are closest to the "ideal point", which leads to the conclusion that these devices are rated best. The overlap of the confidence intervals of both devices confirms that their ratings are not significantly different from each other, but on the same level.
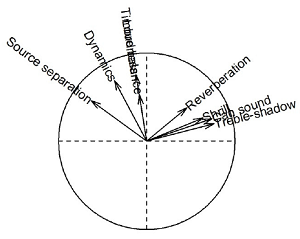
Figure 7. Result of the PCA for all test devices and all sound samples showing the sections of the attributes. Two dimensions were found to combine several attributes with each other. Dimension 1 incorporates the attributes shrill, treble shadow and can sound and explains 29% of the variance. Dimension 2 incorporates the attributes loudness and timbre balance, explaining 23% of the variance.
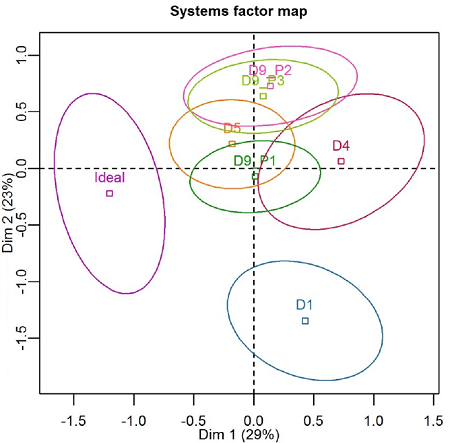
Figure 8. Average and the 95%-confidence intervals of all test devices and the "ideal point“. Their arrangement relative to each other according to Dimension 1 and Dimension 2 together explains 52% of the variance.
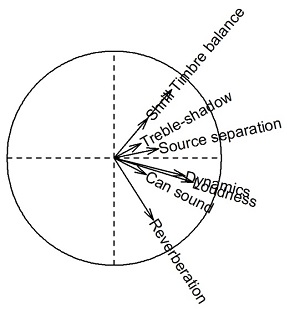
Figure 9. Result of the PCA for all test devices and all sound samples: The picture shows the sections of the attributes. Two dimensions were found to combine several attributes with each other. Dimension 2 loudness and timbre balance explain 23% of the variance. Dimension 3 relates to reverberation, explaining 13% of the variance.
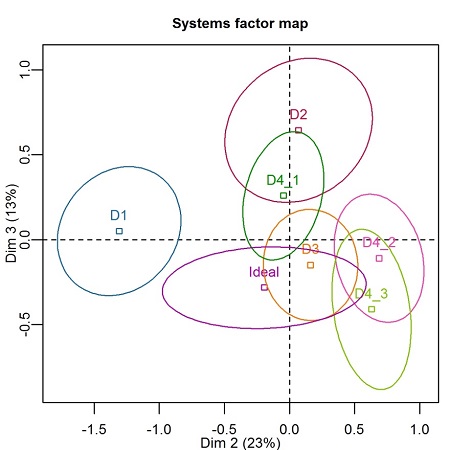
Figure 10. Average and the 95%-confidence intervals of all test devices and the "Ideal Point“. Their arrangement relative to each other according to Dimension 2 and Dimension 3 together explains 36% of the variance.
To further confirm these findings, a Tukey HSD significance test was performed to find the test devices that are statistically different from the "ideal point" and from each other. Table 1 illustrates the results of the Tukey HSD for all devices (rows) in relation to test device 3 for all attributes (columns), the device that has been found to be closest to the ideal point in the pre-study mentioned above. The white fields represent statistically significant differences and red fields represent those that are not statistically different. This analysis confirms the trend implied by the PCA that test devices D3 and D4.1 are not significantly different from each other. All other test devices differ from D3 by at least one attribute.
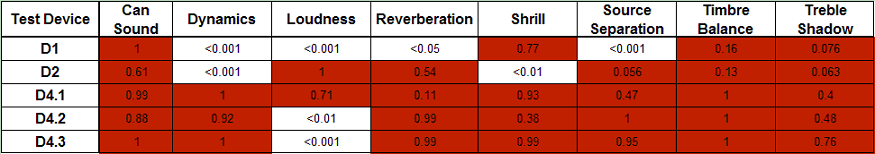
Table 1. Results of the TUKEY HSD for all devices in relation to device D3 which turned out in a pre-test to be rated closest to the ideal point and which is currently perceived as the best hearing instrument in market when listening to music.
Conclusion
A benchmark test of six hearings aids/settings was conducted using an attribute test, the Ideal profiling method (Worch, Le, Punter, & Pages, 2013; Worch, Crine, Gruel, & Le, 2014) for three different music samples by 13 trained assessors with a diagnosed N3 hearing loss (Bisgaard, Vlaming, & Dahlquist, 2010). The hearing aids were programmed according to the N3 hearing profile and then evaluated with the manufacturer’s dedicated music listening program activated. The hearing aids were evaluated on eight different attributes that were defined over two consensus attribute sessions with a subgroup from the assessors' panel. The results from the hearing aid listening tests were analyzed to identify the perceived differences in the six products/settings using music samples. The product profiles were also related to the ideal profile that was defined by the listening panel during the test. The ANOVAs revealed significant system effects for most all attributes. Test devices D3 and D4.1 had the closest match to the ideal profile. For further improvement, it would be constructive if the test devices would reduce the shrillness and the treble shadow to get closer to the ideal profile.
In general, it can be concluded that the ideal profile identified by the subjects in this study can promote future implementation and refinement of dedicated music programs in hearing aids. Based upon the results of this study, it can be noted that of the six hearing aid music programs assessed, there is a general agreement on what is required to improve the experience of listening to music with hearing aids. Continued improvements and adjustments to current hearing aid music programs utilizing subjective feedback is beneficial and essential in achieving overall satisfaction of listening to music through hearing aids.
Acknowledgment
The authors would like to thank Megan Novak very much for her valuable contribution during writing of the manuscript.
References
Bisgaard, N., Vlaming, M.S., & Dahlquist, M. (2010). Standard audiograms for the IEC 60118-15 measurement procedure. Trends in Amplification, 14(2), 113-20.
Chasin, M. & Russo, F.A. (2004). Hearing AIDS and music. Trends in Amplification, 8(2),35-47.
Cross, I. (2006). The origins of music: Some stipulations on theory. Music Perception, 24(1), 79-81.
International Telecommunications Union Radiocommunication Assembly (ITU-R). (2014). Methods for the subjective assessment of small impairments in audio systems (Recommendation BS.1116-2 06/2014). Retrieved from https://www.itu.int/
Legarth, S., Simonsen, C.S., Dyrlund, O., Bramsløw, L & Jespersen, C.T. (2012, August). Establishing and qualifying a hearing impaired expert listener panel. Poster at the International Hearing Aid Research Conference, Lake Tahoe, California.
Wessel, D., Fitz, K., Battenberg, E., Schmeder, A. & Edwards, B. (2007). Optimizing hearing aids for music listening. Conference Paper at 19th International Congress on Acoustics, Madrid, Spain.
Worch, T., Crine, A., Gruel, A. & Lê, S. (2014). Analysis and validation of the Ideal Profile Method: Application to a skin cream study. Food Quality and Preference, 32, 132-144.
Worch, T., Lê, S., Punter, P. & Pagès, J. (2013). Ideal Profile Method: the ins and outs. Food Quality and Preference, 28, 45-59.
Cite this content as:
Legarth, S.V., Zacharov, N., Latzel, M., & Kauhnel, V. (2014, December). Hearing aids and music. AudiologyOnline, Article 13170. Retrieved from: https://www.audiologyonline.com