
 From the Desk of Gus Mueller

A 1980 statement regarding audibility by audiologist David Pascoe is probably the most overused quote in the hearing aid literature, but that is not going to stop me from tossing it out one more time:
Although it is true that mere detection of a sound does not ensure its recognition, it is even more true, that without detection the probabilities of correct identification are greatly diminished.
Perhaps one reason why this quote lives on is that four decades after it was first published, hearing aids are still often fitted in a manner that does not provide sufficient audibility, especially for soft-speech inputs. Calculations of audibility frequently are ignored. Why is this?
Methods to calculate the audibility of speech have been available since the 1940s—most notably the Articulation Index (AI). Admittedly, the math of the AI is not really conducive for routine clinical use. In an attempt to simplify things and encourage clinical calculation of audibility, in 1990 Mead Killion and I created the Count-The-Dots audiogram. When the Speech Intelligibility Index (SII) came along, we revised the dots accordingly and published a new audiogram in 2010. The only math required was the ability to count to 100.
Today, math skills are not an issue at all, as our probe-microphone equipment calculates the real-ear SII for us. To help us understand how this fitting tool can become a useful clinical companion we’ve brought an expert on the topic to our 20Q column, Susan Scollie, PhD. Her research has included the development of normative data and age-related corrections for use with the SII.
Dr. Scollie is Professor and Director of the National Centre for Audiology at Western University in London, Ontario, Canada. She has been actively involved in the training of clinical audiologists since 2003 at Western’s clinical program, including management of the training curriculum and implementation of experiential learning courses.
Among her many achievements, Dr. Scollie is recognized for leading the UWO team in the refinement of the DSL prescriptive method, and the implementation of multiple applications that are now used throughout the world. Her unique expertise in translating evidence-based science behind the DSL method to clinical applications, and her personal collaborations with hearing aid manufacturers and manufacturers of diagnostic hearing aid analyzers, have brought DSL 5.0 into routine clinical practice. Children around the world thank her!
Dr. Scollie has received numerous awards, including the 2015 Innovator of the Year title by WORLDiscoveries, and in 2018 she was honored with the prestigious Academy of Audiology’s Marion Downs Award for Excellence in Pediatric Audiology.
While much of Susan’s work involves high-level signal processing and sophisticated algorithms, she also is very aware of the importance of the “S” in DSL—Audibility!
Gus Mueller, PhD
Contributing Editor
Browse the complete collection of 20Q with Gus Mueller CEU articles at www.audiologyonline.com/20Q
20Q: Using the Aided Speech Intelligibility Index in Hearing Aid Fittings
Learning Outcomes
After this course, readers will be able to:
- Define and describe the Speech Intelligibility Index (SII).
- Discuss how audiologists can integrate the SII into hearing aid fittings using probe-microphone measures.
- Explain how and when the aided SII may differ between adults and children, across hearing aid fitting prescriptions, and across test systems.

Susan Scollie
1. I’m hearing more and more about the Speech Intelligibility Index – why does it seem to be coming up lately?
I’ve noticed that too! The Speech Intelligibility Index (SII) certainly isn’t a new tool, in fact, the most recently changed standard was published in 1997 and actually was not changed when the ANSI committee re-reviewed it in 2017. Ben Hornsby reviewed the Speech Intelligibility Index (SII) in 2004, so it has been around for a while. I think the difference these days is that it is now more widely available in probe-microphone systems, so it is gaining more attention.
2. You know, I hate to admit it, but I really don't understand exactly how the SII works. Can you give me a brief review?
Sure. Let me start by saying that it measures the amount of speech that is available to a listener. First, it estimates how much energy is present from speech (this can be unaided speech, or aided speech from the hearing aid). Then, it calculates how much of that energy is loud enough to be audible, across frequencies. It places more weight on the mid-frequencies, assuming that they are most important. This all gets summed up across frequencies, so the final result is just one number that can be a proportion (between 0 and 1) or a percentage (between 0 and 100%). The percentage of speech that is available is a nice way to summarize a hearing aid fitting. It provides a simple number, and that is sometimes easier for non-clinicians to understand. In the ANSI standard, there is an explanation of how it can also be calculated with a background noise masker, although this is not typically done in our clinical verification equipment. We tend to use it for speech in quiet, and it can be a nice counseling tool to summarize how much speech is available with or without the hearing aids.
3. That’s an interesting idea – I’m starting to think about using it in my counseling too. But really, isn’t the SII the same as the old Articulation Index (AI) or the Count-the-Dots audiogram?
Yes, actually they are similar. The old AI was simply renamed the Speech Intelligibility Index when ANSI re-standardized it in 1997. This was a terminology change, alongside a number of technical updates, but the underlying concepts and methods are essentially the same. Similarly, the Count-the-Dots audiogram was constructed to allow a fast, easy calculation of the unaided AI or SII. The most recent version (Killion & Mueller, 2010) was designed to display dots in alignment with the importance weights in the SII (ANSI/ASA, R2017). This supports good agreement between a calculated SII and the estimate of the SII from counting the dots for unaided speech. I’ve used the count the dots audiogram when working with speech-language professionals who are learning about the impact of hearing loss on speech audibility. Here’s one example: a person with a flat 40 dB hearing loss, perhaps a child with middle ear effusion, will have only about 28 dots audible, or 28% SII, while a person with normal hearing will have all the dots, or 100%. Remember to count the correct dots: in the upside-down world of hearing level (HL), “above” threshold are those that are towards the bottom of the audiogram.
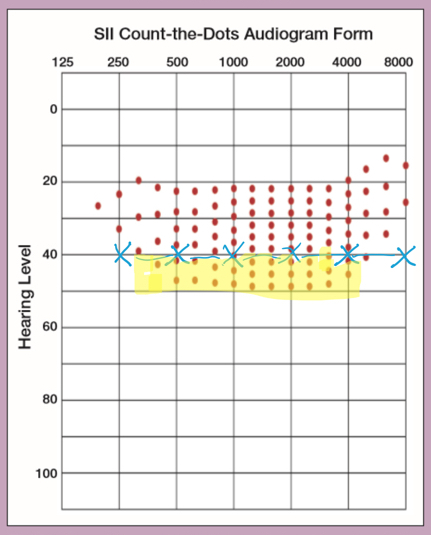
Figure 1. Killion and Mueller's 2010 version of the Count-The-Dots audiogram. On it, we see the thresholds from a flat 40 dB HL audiogram. Dots at higher HL levels are highlighted in yellow, and would be counted as audible.
4. I like the Count-the-Dots audiogram too. But if they agree, why do we need the SII?
There are a few reasons, mostly linked to using the SII in your hearing aid test systems. Most probe microphone/test box systems these days offer measurement of the SII alongside measurements of aided speech. This has a few advantages. First, you can see what happens to speech across different levels. The Count-the-Dots method uses speech with an overall level of 60 dB SPL, which is a good estimate of conversation-level speech. If I use the same 60 dB SPL speech input with my Verifit2, it gives me an unaided 30% SII for the same flat 40 dB HL shown in Figure 1. I got 28 dots when I counted . . . maybe I missed one or two! The same audiogram, however, results in different values for 65 dB and 75 dB SPL speech inputs: 45% for a slightly raised vocal effort at 65 dB and a whopping 85% for loud speech at 75 dB SPL. This could be helpful when explaining why someone can hear if people talk loudly enough, yet a hearing aid may help with soft or distant speech.
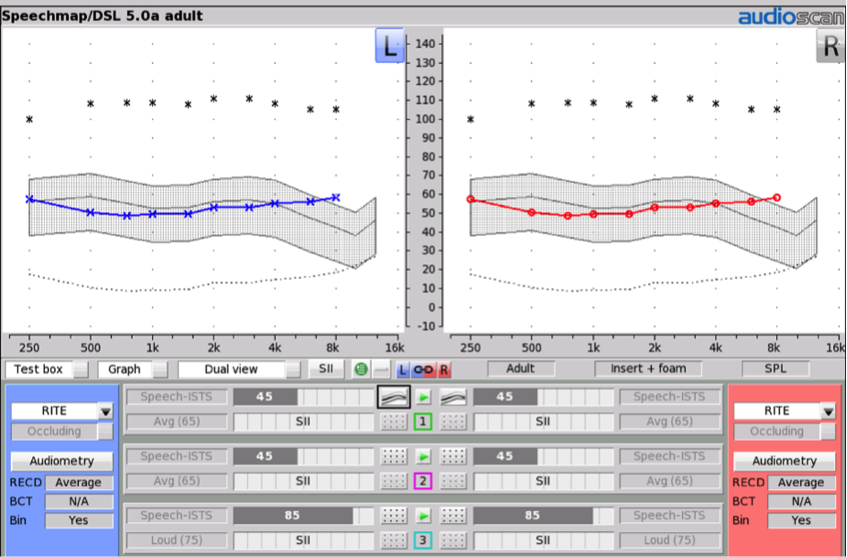
Figure 2. Example of a 40 dB HL audiogram (entered for both the left and the right ears), converted to ear canal sound pressure level (dB SPL) using an Audioscan Verifit2 hearing aid analyzer. The grey shaded region depicts unaided levels of speech at 65 dB SPL. The associated SII value (45%) is indicated in the grey bar associated with Test 1.
5. That seems like a lot of work. Did you have to run extra tests to get those unaided SIIs for different levels of speech?
Not necessarily. Some probe-mic systems will automatically include unaided SIIs for you, and as in Figure 2, they appear automatically for the test level in each of the tests. You won’t see SIIs for other types of test signals: for example, the maximum output test doesn’t use speech, so it wouldn’t be meaningful to calculate an SII for that test. Here’s a trick: If you have a test system that doesn’t pre-calculate the unaided SII for you, you can obtain this value by placing the reference and coupler mics in the test box, in the calibration position (remove the hearing aid coupler!) and measure unaided speech. The “aided” SII will now be calculated for the unaided speech.
6. Okay, so I see that this could be useful in counseling for some people. But mostly I am thinking about my hearing aid fittings. Can’t I just plot the aided thresholds on the Count-the-Dots audiogram?
The short answer is no. The nice thing about today’s probe-mic systems is that they offer calibrated speech as a test signal. When you are verifying and fine tuning with speech, you will automatically be given the aided SII value. So, going back to the booth to measure aided thresholds isn’t necessary after you finish your probe-mic verification. Not only is it not necessary to measure aided thresholds, in most cases, it won’t be accurate either. The vast majority of hearing aids fitted today use some kind of automatic gain control (WDRC, non-linear processing, etc. - pick your favorite term). As you drop the input level, the gain of the hearing aid goes up. So, when you are testing aided thresholds with those really low-level sounds, the gain of the hearing aid is probably close to maximum. That can run the risk of over-representing the aided SII. I’d much rather measure that aided SII value with a real speech test signal at the correct level.
7. I see. I understand that the aided SII values are computed at the same time as I’m programming the hearing aid, because they are both using the aided speech measurement. But where do I find the SII values on my verification screen?
I’m glad you asked. It does vary a little bit across the different test systems. I’ll start with the fitting system and example we talked about earlier. In this example, we’ve fitted a receiver-in-the-ear hearing aid to a flat 40 dB HL audiogram. The unaided SII for soft speech improves from a mere 15% to 46%, while conversation-level speech improves from 45% to 78%. Loud speech, which was audible even without hearing aids at 85% improves a tiny bit to 89%. You can read this information from the bars shown on the right-hand side of this Verifit2 display (Figure 3). Each of the unaided values is shown in grey, while the aided values are in the colors corresponding to each aided response curve.
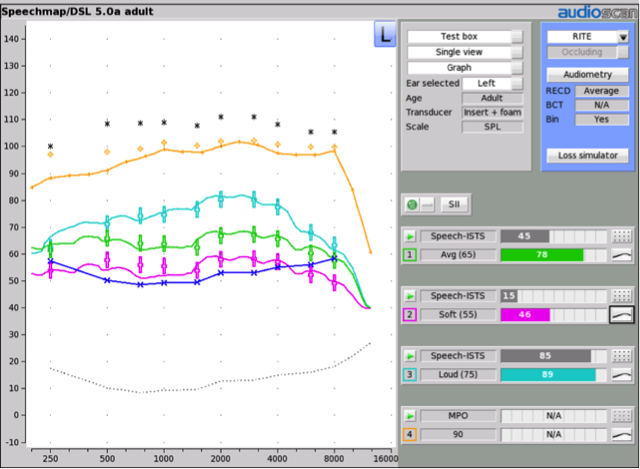
Figure 3. Hearing aid responses for speech at 55, 65, and 75 dB SPL, fitted to the DSLv5 prescription for an adult with a flat 40 dB HL hearing loss. The unaided and aided SII values for each test level are shown on the bars to the right.
8. Is that similar to how the aided SII is displayed in other verification systems?
There are some similarities. Figure 4 shows an example of a different fitting as measured on an Aurical Freefit/PMM system. I’ve tested the hearing aid with 55 and 65 dB speech, and the aided SII values are shown in the table below the verification curves. Again, the values are color-coded to match each test curve, making it easier to see which SII corresponds to which measurement. On both systems, the SII is not produced for the tests of maximum output: as we said earlier, we don’t calculate SII for non-speech signals.
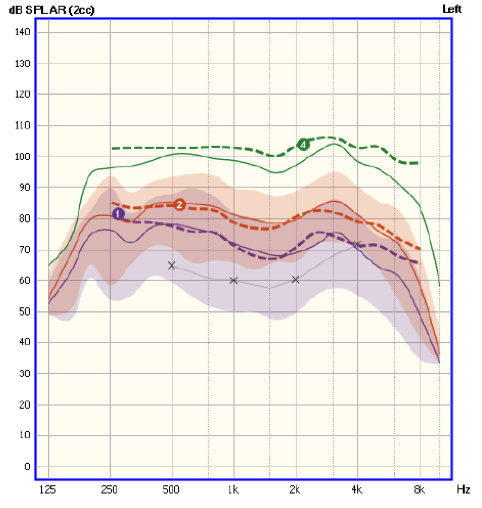
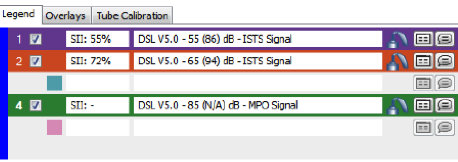
Figure 4. Hearing aid fitting and verification completed on an Aurical Freefit/PMM system. Measurements of aided speech were completed at input levels of 55 and 65 dB SPL. The associated aided SII values are shown in the table below the graph.
9. Makes sense that the aided SII gets measured automatically, as long as we are verifying our hearing aids. What should the desired SII be - 100%?
I’m happy you asked, and no, the goal is not to reach an SII of 100%. A few years ago, my colleagues Marlene Bagatto and Sheila Moodie partnered with a group of Canadian audiologists to gather normative data on this very question. For pediatric fittings that closely matched DSLv5 prescriptive targets, they saw a clear trend in aided SII for 55 and 65 dB SPL (Moodie et al., 2016). For mid-level speech and a well-aided mild loss, we’d expect aided SIIs of about 80% or better. For fittings to losses above about 30 dB HL, this drops about 8% for every 10 dB increase in hearing level. So, for a 70 dB loss, we’d expect aided SII values of 50% or better.
10. Wow, that’s a huge difference! If fitting to target can result in SIIs from 80% to 50%, how can I know I have achieved a good fitting in terms of SII?
Marlene Bagatto has incorporated an aided SII score sheet into her UWO PedAMP protocol (Bagatto et al., 2011), so there’s a handy form that you can use to see if your aided SII falls within the expected range of values. The most recent version of the score sheet is version 2.0, and is freely downloadable from www.dslio.com, (look for the PedAMP section). The norms themselves are also now embedded in the Verifit2 system: if the aided SII falls within the overlaid black bars, that means it is within the ranges on Marlene’s score sheet. This gives you a convenient way to judge if the aided SII is “typical” for that degree of hearing loss.
11. Why do the SII values drop so much as hearing loss increases?
That’s a really common question. You’d think that because we are programming more gain into the hearing aids as they are fitted for more hearing loss, that the hearing loss should be fully offset – and that all the aided SIIs should be really large numbers, even close to 100%. If the SII was only considering raw audibility, maybe that could happen. However, the SII has a number of other corrections built into it: upward spread of masking is one, and distortion for high-level speech is another. The distortion factor really brings the SII values down. It isn’t from distortion in the hearing aid but rather distortion in the ear itself. Remember, the SII was originally developed for unaided listening, and really doesn’t include specific methods for hearing aid users. So even though we certainly present speech at high levels with hearing aids, the SII considers that the normal cochlea will have some distortion at those high levels. This means that for some fittings, even when speech is quite audible, the aided SII values may look a little bit lower than you expect. We notice this most for fittings in the moderately-severe and severe-to-profound ranges.
12. So, it is normal for the SII to be different for different degrees of hearing loss. That’s important to know when I am interpreting my aided SII values. How do you use the aided SII score sheet in clinical practice?
We know from recent studies that providing and maintaining well-fitted hearing aids is an important factor in good long-term outcomes for children with hearing loss (McCreery et al., 2013; 2015). In fact, when kids’ hearing aids were fitted very well to targets, their aided SIIs tended to be high, with many falling in the top portion of the range shown on Marlene Bagatto’s SII form (Figure 5). Maintaining regular hearing aid use and keeping the SIIs high as the children’s hearing and ear acoustics changed over time were both important for long-term development. In our clinical program, we monitor the aided SII as one indicator of the quality of the fitting itself. We also can use it to explain the impact of the hearing aid fitting for caregivers. For example, if a child has an unaided SII of 8% but an aided SII of 78% as shown below in Figure 5, that is a simple yet powerful illustration of how the hearing aid impacts access to speech. The improvement in SII with well-fitted amplification is an important conversation.
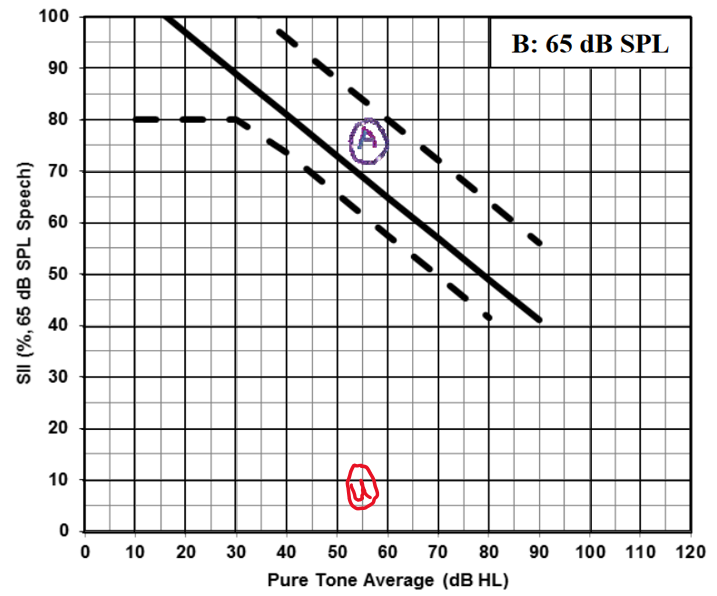
Figure 5. Typical ranges for aided SII, for speech at 65 dB SPL. These ranges were based on fittings to the DSL5-child prescriptive target. The unaided and aided SII values for a specific fitting are shown as "u" and "a", respectively.
13. Is it fair to say that a higher SII value is always better?
The SII is a good tool to have in the toolbox, but not the only one. Because the SII is importance-weighted, it counts the mid-frequency range much more than it does the extreme low or high frequencies. This makes the SII really sensitive to mid-frequency audibility, and less sensitive to high-frequency audibility. Figure 6 shows an example: two fittings for the same flat 40 dB HL audiogram, but one has had all of the gain set to negative values at 5000 Hz and above. Notice how little the SII changes: it only drops by 2 to 5% between the two fittings. This doesn’t mean the two fittings are equal in terms of sound quality or speech sound access. It really just reflects the low weighting that the SII assigns to these high frequencies.
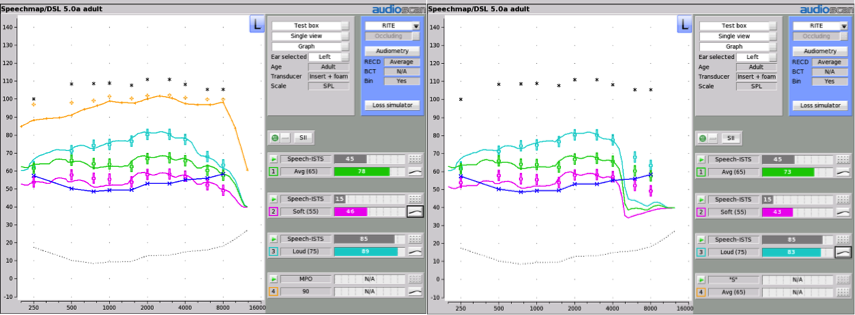
Figure 6. Two different fittings for the same flat 40 dB HL audiogram. In panel A, the hearing aid has been fitted to full bandwidth and a close fit to the DSL5-adult target. In panel B, the hearing aid has had the gains turned all the way down at 5000 Hz and above, rolling off the high frequencies. The associated SII values are shown to the right of each fitting.
14. Makes sense. But does a higher SII lead to a better fitting?
All else being equal, yes. However, with speech recognition, all else is rarely equal – a listener’s performance at a specific SII is dependent on many factors, including the task, the listener’s proficiency, whether or not there is noise or reverberation, and other factors too numerous to list here. It is tempting to try to make the SII as big as possible, but this is very much tied to your prescriptive target. We need to choose a prescriptive target based on the hearing aid outcomes goals that are appropriate for the hearing aid user. If you have chosen to work with a prescription, presumably that means that you know that the prescription has been evaluated to provide comfortable loudness and good speech recognition. Fitting gain in excess of the target to chase a higher SII may improve SII but may also be too loud. Consider the fitting in Figure 7 – the aided response for soft speech is almost at average targets, and the aided response for average speech is halfway to the targets for loud. Loud speech output is well over target. Maybe this fitting produces a higher SII, but probably it is too loud and the wearer will simply turn down the volume control. This is why we’ve chosen to look at typical SII ranges for a given prescriptive target, rather than saying that the SII has to be at a specific value.
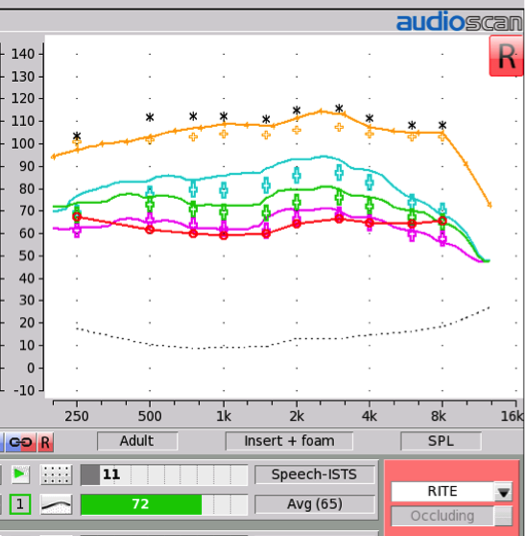
Figure 7. Example of a fitting that is over targets. The associated aided SII value is shown in the bars below.
15. I see – we need to balance off the loudness and the SII of the fitting. But still, isn’t more SII a good thing?
As long as it isn’t too loud, sure. One recent study reviewed the literature on the SII and other methods of predicting speech intelligibility, and looked at how much audibility is required to achieve certain levels of speech recognition performance (Letowski & Scharine, 2017). Now, this study was aimed mainly at listeners with normal hearing but bear with me because it’s really an interesting concept. They worked backwards from performance-intelligibility curves to figure out how much SII you need to have precise understanding of speech including understanding of each syllable, versus lower, but still functional, levels of understanding.
16. What did they find?
For “minimal understanding”, in which the listener would need to use contextual information to understand about 90% of sentences (especially if they are standard phrases), the listener could probably get by with only 37% SII. However, if the listener needed better understanding at 98% of sentences and all of digits, then they would recommend 57% SII. For full understanding of all speech including every syllable, 72% SII or better would be recommended. If you think about how you listen in a challenging listening environment, this makes a lot of sense: even if you don’t actually hear all of the parts of speech, you can fill in with context. High aided SII values, especially when they are achieved via a broadband hearing aid fitting (see Pittman & Gustafson, 2010 for an interesting experiment on this), usually mean good provision of a wide range of speech cues.
17. Good point. What ranges of aided SII values should I be looking for in my adult fittings?
Sandra Baker and Lorienne Jenstad (2017) shared typical aided SII ranges from a large sample of real clinical fittings in adults. The fittings were within 5 dB of targets for most frequencies, and all were verified with probe-microphone measurements. They provide their aided SII values for the DSL5-adult targets as well as the NAL-NL1 targets, for speech input levels ranging from 55 through 75 dB SPL. Similar to our ranges for children, the aided SIIs decrease as the unaided hearing levels increase. For example, they reported average aided SIIs for the DSL5-adult fittings ranging from 79% to 63% to 47% for mild, moderate, and moderately-severe patient groups. This is slightly lower than Marlene Bagatto’s children’s ranges. This is because the DSL5-adult gains are lower than the DSL5-children’s target.
18. Those are helpful ranges. What did the ranges for the NAL targets look like?
They reported ranges for NAL-NL1, with aided SIIs averaging around the mid 70% range for mild and moderate losses for mid-level speech. This is fairly similar to the range of values reported for NAL-NL2 by Johnson & Dillon (2011), who also reported similar predicted aided SII values for NAL-NL1 and NAL-NL2. Differences between prescriptions tend to vary a bit with the type of audiogram: flat mild losses are more similar while severe and sloping losses have more differences in SII between prescriptions.
19. Interesting. Can I see an example of the differences in SII between prescriptions?
Sure. Figure 8 shows an example for a child with a sloping hearing loss, fitted to DSLv5-child targets in green, and to another prescription in pink. You can see that the DSL fitting is closely shaped to targets, and that the aided SII value therefore falls within the expected range shown by the vertical markers. The other fitting has a much lower aided SII (56 vs 80%), and is a prescriptive target not intended for use with children. So, although it had a good fit to targets, the targets themselves are different. I notice these differences more for children’s fittings and also more as the degree of hearing loss increases. An adult with a mild loss will receive a more similar SII across prescriptions than shown by this example.
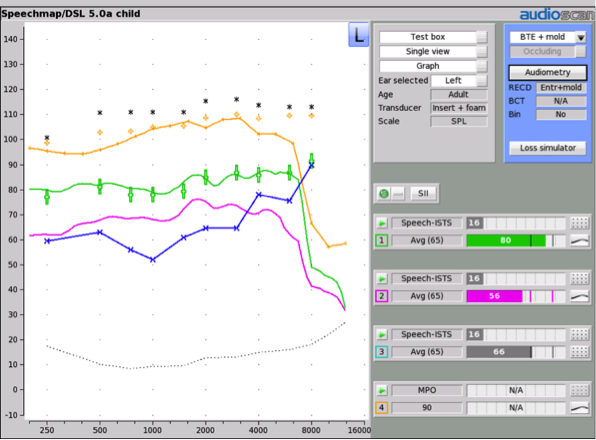
Figure 8. Two different hearing aid fittings for a child with a moderately-severe sloping hearing loss. The green curve has been fitted to the DSL v5-child target. The pink curve was fitted to an alternative prescription that is not intended for use with children. The aided SII values for each fitting are shown by the green and pink bars to the right.
20. Any take-home messages?
Yes, I can give you three: 1.) The SII is an automatically computed, standardized summary number, but does not optimize the fit to targets or audible bandwidth - that’s your job!; 2.) The SII may help non-fitters by providing easy-to-consume percentages that summarize the amount of speech that is available, unaided or aided. It can illustrate the difference between unaided and aided speech access; 3.) Lower-than-typical aided SII values are a red flag that the fitting should be re-examined. Recent research tells us that this is an important part of long-term outcomes for children – this has been less studied in adults but is a known factor for speech recognition for all ages. Ongoing work on normative ranges for aided SII for each type of prescription is important to help with aided SII interpretation for a wide range of patients.
References
ANSI/ASA S3.5-1997 (R2017). American national standard methods for calculation of the speech intelligibility index. Melville (NY): Acoustical Society of America; 2017.
Bagatto, M. P., Moodie, S. T., Malandrino, A. C., Richert, F. M., Clench, D. A., and Scollie, S. D. (2011). The University of Western Ontario Pediatric Audiological Monitoring Protocol, Trends in Amplification, 15: 57-76.
Baker, S., and Jenstad, L. (2017). Matching real-ear targets for adult hearing aid fittings: NAL-NL1 and DSL v5.0 prescriptive formulae. Canadian Journal of Speech-Language Pathology, Volume 41, No. 2: 227-235.
Gustafson, S.J., Pittman, A.L. (2010). Sentence perception in listening conditions having similar speech intelligibility indices. International Journal of Audiology, 50(1): 34-40.
Hornsby, B.W.Y. (2004). The Speech Intelligibility Index: What is it and what's it good for? The Hearing Journal: October 2004 - Volume 57 - Issue 10 - p 10–17.
Johnson, E. E., & Dillon, H (2011). A comparison of gain for adults from generic hearing aid prescriptive methods: Impacts on predicted loudness, frequency bandwidth, and speech intelligibility. Journal of the American Academy of Audiology, 22(7), 441-459.
Killion, M.C., Mueller, H. G. (2010). Twenty years later: A NEW Count-The-Dots method, The Hearing Journal: January 2010 - Volume 63 - Issue 1 - p 10,12-14,16-17, doi: 10.1097/01.HJ.0000366911.63043.16
Letowski, T. & Scharine, A. (2017). Correlational Analysis of Speech Intelligibility Tests and Metrics for Speech Transmission. U.S. Army Research Laboratory, ARL-TR-8227. Accessed from: https://www.dtic.mil/dtic/tr/fulltext/u2/1043203.pdf.
McCreery, R., Bentler, R., & Roush, P. (2013). The characteristics of hearing aid fittings in infants and young children. Ear and Hearing, 34, 701–710.
McCreery, R.W., Walker, E.A., Spratford, M., Bentler, R., Holte, L., Roush, P.,...Moeller, M.P. (2015) Longitudinal predictors of aided speech audibility in infants and children. Ear and Hearing, 36(1), 24S-37S. doi: 10.1097/AUD.0000000000000211
Moodie, S. T., The Network of Pediatric Audiologists of Canada, Scollie, S., Bagatto, M., and Keene, K. (2017). Fit to targets for the DSL v5.0 hearing aid prescription method for children. American Journal of Audiology, 26(3): 251-258
Citation
Scollie, S.D. (2018). 20Q: Using the aided speech intelligibility index in hearing aid fittings. AudiologyOnline, Article 23707. Retrieved from www.audiologyonline.com