 From the Desk of Gus Mueller
Okay, I bet you’ve never heard this one before: “The pure-tone audiogram might not be the best way to determine a patient’s hearing handicap.” Yes, while we all know this, in a borderline mild case it is still pretty tempting to stare at the X’s and O’s, maybe squint a little and then proclaim a “Yea” or “Nay” for hearing aid candidacy. True, the key frequencies used for making this decision have gotten higher over the years, and the loss doesn’t need to be quite as severe, but we still seem to rely pretty heavily on the pure-tone measure. Why is this? Because sometimes it’s all we have?
All the hearing aid fitting guidelines from the past 30 years, and the recent hearing aid fitting standard from the APSO, clearly outline the importance of conducting routine pre-fitting speech-in-noise testing and self-assessment inventories. Will these findings help identify candidacy? Most certainly. While there are several validated self-assessment scales available, our 20Q this month focuses on a specific inventory, the HHIE. The HHIE, and its cousin the HHIA, have been around for decades, have been extensively researched, and certainly have withstood the test of time. There are few, if any researchers who have studied the usefulness of these assessment tools more than this month’s 20Q guest author.
Larry E. Humes, PhD, is a distinguished professor emeritus in the Department of Speech, Language and Hearing Sciences at Indiana University. Dr. Humes has served as associate editor, editor, and editorial board member for several audiology journals. He has received the Honors of the Association and the Alfred Kawana Award for Lifetime Achievement in Publications from the American Speech-Language-Hearing Association and the James Jerger Career Award for Research in Audiology and a Presidential Award from the American Academy of Audiology. He also was selected to present the 2020 prestigious Carhart Memorial Lecture at the annual meeting of the American Auditory Society. He is a fellow of the Acoustical Society of America and of the International Collegium on Rehabilitative Audiology (ICRA).
Larry’s most recent research activities have focused on age-related changes in auditory perception, including speech-understanding ability, and on outcome measures for hearing aids. As you will see in his excellent 20Q article, his extensive research with hearing loss, the HHIE, and hearing aid use adds significantly to our understanding of who might benefit from amplification. With OTC and self-fitting hearing aids on the horizon, exactly the information that we need to consider.
Gus Mueller, PhD
Contributing Editor
Browse the complete collection of 20Q with Gus Mueller CEU articles at www.audiologyonline.com/20Q
20Q: Assessing Auditory Wellness in Older Adults
Learning Outcomes
After reading this article, professionals will be able to:
- Discuss limitations of pure tone audiogram test results in describing self-perceived hearing difficulties and impact of hearing loss on daily activities.
- Describe validated measures that can be used as tools to determine auditory wellness.
- Explain how changes in the hearing aid delivery model may impact people with pure-tone test results in the normal range who have self-perceived hearing difficulty.

1. You’ve been writing a lot lately about the importance of self-report measures for perceived hearing difficulties in adults. Why?
There are a number of reasons for my interest in these measures. One was the realization that the pure-tone audiogram was not providing a very good indication of the degree of difficulties experienced in everyday communication by adults with mild-to-moderate hearing loss.
2. What makes you say that the pure-tone audiogram is not a good measure for this purpose?
For those of us who have been in the profession for decades, we can recall the development of self-report measures like the Hearing Performance Inventory (HPI; Giolas et al., 1979), the Hearing Handicap Inventory for the Elderly (HHIE; Ventry & Weinstein, 1982), and the Communication Profile for the Hearing Impaired (CPHI; Demorest & Erdman, 1987), among others. Almost from their inception in the 1980s, it was clear that there was a discrepancy between the audiometrically defined severity of hearing loss and the severity of self-reported hearing difficulties.
3. In which direction?
Typically, the difference was in the direction of a large number of individuals with audiometrically defined normal hearing or mild hearing loss having significant perceived hearing difficulties, but there were discrepancies observed in the other direction as well. Many who were audiometrically determined to have “normal hearing” were self-reporting that they really were having difficulty hearing and that this was impacting them socially and emotionally.
4. What makes you think that it is the audiogram that is incorrect in these cases?
Many years ago, when I would see scatterplots of perceived hearing difficulties plotted against the measured pure-tone hearing loss, I was surprised to see such a wide range of perceived difficulties reported for a given amount of hearing loss, and I assumed it was the self-report measure that was incorrect or may be unreliable. The audiogram, after all, was an objective measure of hearing loss severity and had to be more accurate and reliable than any self-report measure of hearing difficulty, right? More recently, I’ve come to think that I had it wrong. The perceived difficulty is accurate, but that difficulty was just not captured by the pure-tone audiogram.
I can probably better show this with a figure, Figure 1. There are two panels in Figure 1 that show the scores for the HHIE from 1,619 adults (52.5% women), 50-90 years of age that completed the HHIE either at Indiana University (IU) or the Medical University of South Carolina (MUSC). The top panel shows a scatterplot, like the ones I was mentioning, illustrating that a given amount of pure-tone hearing loss can correspond to a wide range of perceived hearing difficulties. The scatterplot in the top panel looks almost like a blast pattern from a shotgun with no association between HHIE and pure-tone average, but, as indicated in the top panel, the correlation is r=0.61, and the solid red line is the best-fitting regression line for those data. The contour plot or “heat map” for these same data in the bottom panel of Figure 1 better reveals this moderate correlation between HHIE and pure-tone average. The color coding in that plot shows how many people along the diagonal had similar HHIE score and pure-tone average combinations, something that is hard to show in a scatterplot. As can be seen in the lower panel, there is a pattern showing greater concentration of scores (brighter colors) along the positive-going diagonal. This supports the moderate correlation of r= -0.61 between the HHIE score and pure-tone hearing loss.
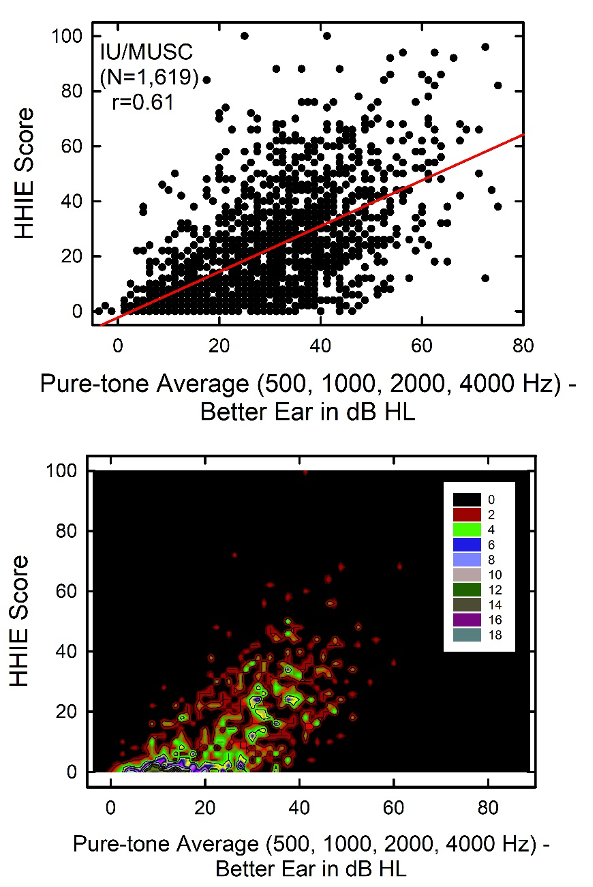
Figure 1. Scatterplot (top) and contour plot (heat map) showing the HHIE scores plotted as a function of better ear four-frequency pure-tone averages for 1,619 older adults.
Still, the correlation between these two measures is significant statistically but only moderate in strength. A correlation of r=0.61 means that pure-tone average can explain about 1/3 of the variation in the data across the 1,619 individuals. Given what we know about the reliability of the HHIE score, this means that differences in hearing loss can explain a little less than half of the true differences in HHIE score among the 1,619 individuals. This is very good, but clearly, there is much more to understand about variations in the HHIE score from person to person than can be explained by the audiogram. Consider individuals with a pure-tone average of 40 dB HL in Figure 1. According to the scatterplot in the top panel, the perceived hearing difficulties for individuals with this amount of pure-tone hearing loss can range from no difficulties (0) to extreme difficulties (100). On average, though, a group of people with that amount of hearing loss would have an HHIE score of about 25-30.
5. I noticed in the figure that you are plotting the HHIE scores versus a four-frequency pure-tone average from the better ear. Why did you choose this pure-tone average?
For many years, the WHO has recommended that the severity of audiometric hearing loss be quantified using a pure-tone average for 500, 1000, 2000, and 4000 Hz for the better ear.
6. The WHO? What does a British rock band of the 1970s have to do with this?
Not that “WHO”! The World Health Organization (WHO).
7. Oh, okay. Sorry. You were saying?
Using this audiometric yardstick to measure hearing loss severity, which I’ll refer to as the PTA4 (for the better ear), the WHO (Stevens et al., 2013) established the following severity categories: (0) normal, PTA4 ≤ 20 dB HL; (1) mild/slight, 20 < PTA4 ≤ 35 dB HL; (2) moderate, 35 < PTA4 ≤ 50 dB HL; (3) moderately severe, 50 < PTA4 ≤ 65 dB HL; (4) severe, 65 < PTA4 ≤ 80 dB HL; and (5) profound, PTA4 > 80 dB HL. Recently, I looked at several measures of hearing function for thousands of adults based on this hearing-loss severity classification system and found, on a group basis, that most of the increments in severity from normal through severe were justified based on functional measures, including the HHIE (Humes, 2019). The validity of the distinction between the “moderately severe” and “severe” categories of impairment was the only one that was questioned, but the data for severe (and profound) amounts of hearing loss were relatively sparse.
8. Wait. Now, I’m confused. I thought you’ve been arguing that the audiometric classification of hearing loss was not a good one to use, but then you seem to be saying that the analysis of the WHO system turned out to be pretty good. Can you clarify this?
I’ll be glad to clarify. As was shown in the previous scatterplot and contour plot, there is an association between hearing loss and perceived hearing difficulty as measured by the HHIE. The analysis of the WHO system in Humes (2019) focused on group data. This is basically like focusing on the bright areas in the heat map at the bottom of Figure 1. If one tracks along the bright areas in the heat map, as PTA4 increases, so does HHIE. This is consistent with the analysis of group data. However, this association only explains about half of the variation in HHIE score. That is, when one considers the individual data, that is, all of the data points in Figure 1, as much remains unexplained about individual HHIE scores as can be explained by PTA4.
These measures of hearing loss severity serve a purpose. They can be used to define the severity of the sensory impairment, but this is only one aspect of the individual’s perceived hearing difficulties and the impact of those difficulties on the person’s daily function. The WHO recognized this 20 years ago.
9. How so?
Two decades ago, the WHO established a comprehensive model of healthy function that has since formed the basis for the now well-established WHO-ICF system, among other things (WHO, 2001). A central concept of this model was that healthy function has three primary components: (1) healthy bodily functions or no body impairments; (2) no activity limitations; and (3) no restrictions on participation in society.
10. This ties to hearing how?
The audiogram provides a decent measure of one of these three components, impaired bodily (sensory) function. This represents one of the three important domains of healthy function.
11. And self-report measures are better?
Yes, or at least they can be if well-constructed. It is possible for self-report measures to tap all three aspects of healthy function - bodily impairment, activity limitations, and participation restrictions.
12. You’ve lost me now. How does all this tie into your initial observation of the poor association between perceived hearing difficulties and pure-tone hearing loss, especially for milder pure-tone deficits?
If bodily impairment was the only dimension of importance for healthy everyday auditory function, then there would be excellent agreement between the audiometric hearing loss severity and the perceived hearing difficulties. In the extreme case of perfect agreement, all of the HHIE scores would fall along the red line in the top panel of Figure 1. If this were true, then when we know the PTA4, we know their HHIE or their perceived hearing difficulties. In some people this may be true. That is, they experience no, or few, activity limitations or participation restrictions and the measured bodily impairment captures all that is relevant to their everyday function. For many individuals, however, this is not the case. Additional activity limitations or participation restrictions are experienced by the individual and these are not tied directly to the severity of the impairment. Rather, they can be modulated by a number of other contextual factors.
13. What do you mean by “modulated by contextual factors” and what are these contextual factors?
The WHO model of healthy function includes both personal and environmental contextual factors that impact the activity limitations and participation restrictions experienced by a person with a given amount of hearing loss. Consider two people with identical audiograms. One individual lives alone at home, spending most of his waking hours watching television, and the other lives with a significant other, has extended family nearby, and is actively engaged in a number of social activities. Even though the audiogram is the same, the consequences of that hearing loss on each individual’s daily function are not likely to be the same. Most likely, the more active, engaged individual will report greater activity limitations and participation restrictions as a result of the hearing loss. A well-constructed measure can capture all three dimensions of the WHO model of healthy function, as well as some of the modulating contextual factors.
14. Okay, you’ve mentioned use of a well-constructed measure a couple of times now. What exactly do you mean by this?
As with any behavioral measure, we want the measure to be both reliable and valid. Reliability refers to the stability of the measure whereas validity asks whether the measure does in fact measure what it purports to measure. Reliability is rather straightforward, but there are several forms of validity that need to be considered. Two forms commonly assessed are content validity, which is basically an expert appraisal of the semantic content and comprehensiveness of the items comprising the measure, and criterion validity, often established by correlating one measure with another measure that is believed to be a gold standard for that same construct.
15. Can you give me an example for criterion validity?
Sure. Let’s take the 25-item Hearing Handicap Inventory for the Elderly (HHIE). The type of association shown in Figure 1 was also seen in a recent analysis of data from over 10,000 adults with hearing loss. Just as in Figure 1, it was found that the HHIE score was moderately correlated with pure-tone hearing loss, typically with a correlation coefficient (Pearson r) of about 0.6 (Humes, 2021a). This suggests that the HHIE is sensitive to or impacted by the bodily-impairment component of healthy daily function.
16. But aren’t you looking for a correlation with something more comprehensive than pure-tone audiometry?
Yes, but let me finish. In this same article (Humes, 2021a), the HHIE was also shown to be correlated strongly with a comprehensive 145-item self-report measure, the Communication Profile of the Hearing Impaired (CPHI). The CPHI taps several aspects of hearing-related activity limitations and participation restrictions. Because of its length and comprehensiveness, it can be considered a gold-standard measure for these aspects of communication-related daily function. So, in the end, the HHIE was correlated with all three aspects of healthy daily function in the WHO model: bodily impairment (PTA4), activity limitations (CPHI), and participation restrictions (CPHI). In this sense, the HHIE is superior to the reliance on pure-tone audiometry to document the hearing-related difficulties experienced by adults (Humes & Weinstein, 2021).
17. Are you recommending that audiologists routinely use the HHIE to determine the impact of hearing loss on adults with hearing loss?
Yes, but, as you know, this has been recommended many times before, especially for those over 50 years of age. But there is no need to limit these measures to older adults only. There is also a version of this same self-report survey that can be used for adults under 50 years of age, the Hearing Handicap Inventory for Adults (HHIA; Newman et al., 1990). Recent work on the psychometric characteristics of both the HHIE and the HHIA by Judy Dubno and colleagues (Cassarly et al., 2020) also suggested a more robust 18-item version that can be used with adults of any age. Including any of these tools in one’s clinical practice would be valuable and important. Repeatedly, it has been shown that the single greatest factor leading to eventual hearing-aid uptake and use is the perceived difficulty of the individual, not the audiometric severity of the hearing impairment (e.g., Knudsen et al., 2010; Humes, 2021b; Humes & Dubno, 2021). However, I’d take this a step further. I’d suggest that this test could be self-administered by the older adult directly to help them determine their need for help.
18. I understand that the HHIE is relatively brief and pretty simple to administer and score, but won’t the older adult completing this on their own need help in interpreting their score?
Yes, and you’re correct that the HHIE is a brief, reliable and valid measure of hearing problems in adults. But there is an even shorter screening version, the HHIE-S (Ventry & Weinstein, 1983) that is also reliable and valid. Recently, I proposed use of either the full 25-item HHIE or the 10-item screener as a measure of “auditory wellness”; basically, a measure of healthy daily hearing function (Humes, 2021a). Either test is really the inverse of such a measure in that each asks about problems or difficulties in social and emotional contexts, but this just involves interpreting low scores as good auditory wellness and high scores as poor auditory wellness.
19. How does the auditory wellness scale work?
The HHIE and HHIE-S are readily available in hardcopy form for any adult with access to the internet to download and complete. I personally prefer the longer 25-item HHIE as its reliability appears to be slightly better than that of the screener, which is not surprising given the larger number of items. After completing and scoring the hardcopy HHIE, one can check his or her score against five ranges of scores that define excellent, good, fair, poor, and very poor auditory wellness based on analyses of data from over 10,000 adults. Ideally, an online version of the HHIE or HHIE-S would be implemented which would automate the scoring, note the associated auditory-wellness rating, and then make wellness-specific recommendations to the respondent. Those who score in the excellent range would just be referred for annual re-evaluation. Those in the fair, poor, and very poor categories generally benefit from some form of intervention and can be directed to seek help themselves or with the aid of an audiologist.
20. Seek help themselves? What does that mean?
I’m sure you’ve seen that the FDA has recently released its proposed guidelines for Over-the-Counter (OTC) hearing aids. Soon, individuals with perceived mild-to-moderate hearing loss will be able to seek help directly via OTC hearing aids. The HHIE and the associated auditory-wellness scale may provide a vehicle for the adult to self-determine their candidacy for OTC hearing aids should she or he decide to pursue that option. This has also been one of the reasons behind my recent research interest in such self-report measures of perceived hearing function. OTC hearing aids are designed for the millions of Americans with perceived hearing difficulties who have not sought help at the clinic or went to the clinic but did not acquire hearing aids. The option for OTC hearing aids provides an alternate pathway to healthy auditory function for these millions of individuals with currently untreated hearing loss. OTC hearing aids will soon be a reality and I think it is imperative to develop reliable, valid tools that adults with perceived mild-to-moderate hearing loss can easily use to help guide them through the OTC pathway to success.
Further, it is clear that successful outcomes can be obtained with self-fit devices. This is easiest to illustrate with Figure 2, from Humes (2020). Here, the means and standard deviations for the HHIE are shown for unaided and aided conditions with the difference shown as the benefit received. The top panel shows the results for those fit using audiology best-practices fitting (AB) and the bottom panel a consumer-decides (CD) try-and-select self-fitting method. The data are also partitioned by the severity of pure-tone hearing loss using the WHO-based definition. There are several noteworthy features in these data. First, notice that the HHIE benefit, unaided score minus aided score, is about the same in both panels and for all hearing loss groups. The similarity of outcomes between the AB and CD groups was documented with many more outcome measures in Humes et al. (2017) and replicated in Humes et al. (2019). Regarding the comparable benefit measured across hearing-loss groups in both panels, this suggests that even those classified by the WHO PTA4-based system as “normal hearing” show measurable benefit that is on par with that of the mild and moderate hearing-loss groups. Even though their pure-tone audiograms were in the normal-hearing range, their perceived hearing problems, as shown by the unaided HHIE scores in this figure, were about the same as those with mild or moderate hearing loss. Moreover, to be enrolled in these studies, the individuals could not have purchased hearing aids previously. They also had to have had perceived difficulties in that they responded to recruitment advertisements noting that hearing aid purchase would be required during the course of the study.
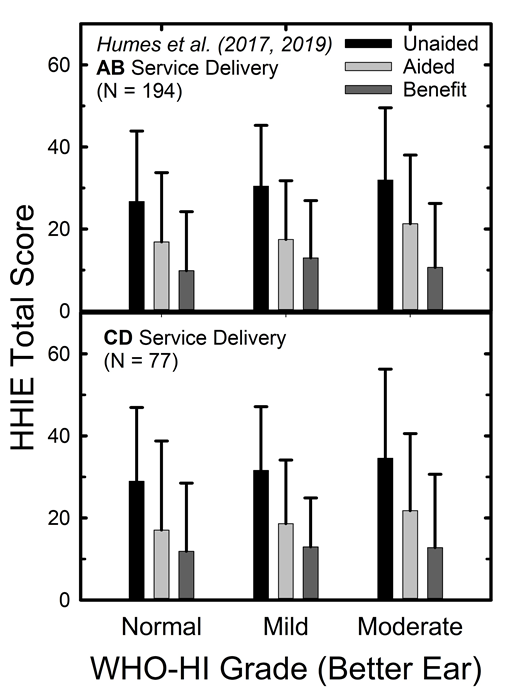
Figure 2. HHIE scores unaided and aided conditions, as well as the difference between these two scores (benefit) for two different fitting methods, AB and CD. Data are grouped according to the WHO-based hearing-loss severity.
Importantly, in the end, about 80% of those in the normal-hearing category purchased hearing aids. This is a little lower than the 90-95% who purchased hearing aids in the mild and moderate hearing-loss categories but is still substantial. If pure-tone audiometry alone was used to determine candidacy, most or all of those in the normal-hearing category might not even be considered for hearing aids. Yet, the individuals themselves felt they needed help and ultimately felt that the hearing aids provided the help needed; enough so that they purchased the devices after the trial period.
References
Cassarly, C., Matthews, L.J., Simpson, A.N. & Dubno, J.R. (2020). The revised hearing handicap inventory and screening tool based on psychometric reevaluation of the hearing handicap inventories for the elderly and adults. Ear and Hearing, 41, 95-105.
Demorest, M. E., & Erdman, S. A. (1987). Development of the Communication Profile for the Hearing Impaired. Journal of Speech and Hearing Disorders, 52, 129–143.
Giolas, T. G., Owens, E., Lamb, S. H., & Schubert, E. D. (1979). Hearing performance inventory. The Journal of Speech and Hearing Disorders, 44(2), 169–195.
Humes, L.E. (2019). Examining the validity of the World Health Organization’s long-standing hearing-impairment grading system for unaided communication in age-related hearing loss. American Journal of Audiology, 28(3S), 810-818.
Humes, L.E. (2020). What is normal hearing for older adults and can “normal-hearing older adults” benefit from amplification? Hearing Review, 27(7), 12-18.
Humes, L. E. (2021a). An approach to self-assessed auditory wellness in older adults. Ear and Hearing, 42, 745–761.
Humes, L.E. (2021b). Differences between older adults who do and do not try hearing aids and between those who keep and return the devices. Trends in Hearing, 25, 1-18.
Humes, L.E. & Dubno, J.R. (2021). A comparison of the perceived hearing difficulties of community and clinical samples of older adults. Journal of Speech, Language and Hearing Research, 64, 3653-3667.
Humes, L.E. & Weinstein, B.E. (2021). The need for a universal hearing metric-is pure-tone average the answer? JAMA Otolaryngology-Head & Neck Surgery, Published online April 15, 2021. 10.1001/jamaoto.2021.0417
Humes, L.E., Kinney, D.L., Main, A.K., & Rogers, S.E. (2019). A follow-up clinical trial evaluating the consumer-decides service-delivery model. American Journal of Audiology, 28, 69-84.
Humes, L.E., Rogers, S.E., Quigley, T.M., Main, A.K., Kinney, D.L., & Herring, C. (2017). The effects of service-delivery model and purchase price on hearing-aid outcomes in older adults: a randomized double-blind placebo-controlled clinical trial. American Journal of Audiology, 26, 53-79.
Knudsen, L. V., Oberg, M., Nielsen, C., Naylor, G., & Kramer, S. E. (2010). Factors influencing help seeking, hearing aid uptake, hearing aid use and satisfaction with hearing aids: A review of the literature. Trends in Amplification, 14, 127–154.
Newman, C. W., Weinstein, B. E., Jacobson, G. P., & Hug, G. A. (1990). The Hearing Handicap Inventory for Adults: Psychometric adequacy and audiometric correlates. Ear and Hearing, 11(6), 430–433.
Stevens, G., Flaxman, S., Brunskill, E., Mascarenhas, M., Mathers, C. D., Finucane, M., & Global Burden of Disease Hearing Loss Expert Group. (2013). Global and regional hearing impairment prevalence: An analysis of 42 studies in 29 countries. European Journal of Public Health, 23, 146–152.
Ventry, I. M., & Weinstein, B. E. (1982). The Hearing Handicap Inventory for the Elderly: A new tool. Ear & Hearing, 3, 128–134.
Ventry, I. M., & Weinstein, B. E. (1983). Identification of elderly people with hearing problems. ASHA, 25, 37–42.
World Health Organization. (2001). International classification of functioning, disability and health. Geneva: Author.
Citation
Humes, L.E. (2022). 20Q: Assessing auditory wellness in older adults. AudiologyOnline, Article 28087. Available at www.audiologyonline.com

