
 From the Desk of Gus Mueller
We’re always pleased when we hear from people around the world who are reading and enjoying our 20Q feature. And likewise, we try to have a mix of 20Q authors from outside of the U.S. In the past few years, we’ve had contributions from authors in Canada, Australia, South Africa, Germany and several from the U.K. This month we’re adding Sweden to that list.
Our 20Q guest author is Peter Nordqvist, PhD, who grew up in the mining district of Sweden, and received his training in engineering, signal processing and hearing technology at the KTH Royal Institute of Technology in Stockholm. He currently serves as the managing director for the Research Institute Hearing Bridge at the Royal Institute of Technology.
In today’s world of computers and the Internet, we create a lot of data. In fact, every two days we create as much data as we did from the beginning of time until the year 2000. These data are available about everything, including patients receiving audiologic evaluations and being fitted with hearing aids. Rather than conduct a laboratory study with a handful of participants to determine if one fitting algorithm is better than another, or if one product provides more benefit than another, it only makes sense to look at a large group of data, if that is available. This type of large-scale analysis is often referred to as Big Data.
Big Data works on the principle that the more you know about anything, the more reliably you can gain new insights. It’s possible that relationships or trends will emerge that may have been previously hidden, and these relationships will help us make better decisions. I think you’ll enjoy reading about Dr. Nordqvist’s Big Data analysis, and how this has led to some new thinking regarding the hearing aid fitting process.
As you saw in Peter’s affiliation, there is mention of a “Hearing Bridge.” He tells us that he has a strong belief in building bridges between the stakeholders within audiology. For this reason, eight years ago he started the research institute Hearing Bridge as a hub for hosting that process in Sweden. Hearing Bridge now serves as an ecosystem for cooperation between universities, clinics, manufacturers, user organizations, and society. To do all that, you really do need Big Data!
Gus Mueller, PhD
Contributing Editor
Browse the complete collection of 20Q with Gus Mueller CEU articles at www.audiologyonline.com/20Q
20Q: Hearing Aid Fitting and Big Data - Put Yourself in Context
Learning Outcomes
After this course, readers will be able to:
- Explain how big data can complement traditional research in healthcare.
- Explain how the National Quality Registries in Sweden are implemented in regard to hearing aid fittings.
- Describe the type of hearing aid fitting data collected by the Swedish national registry and how it may be used by an individual clinic for quality improvement.

Peter Nordqvist
1. What exactly is "big data"?
It’s a term that we use to refer to extremely large data sets that may be analyzed to reveal patterns, trends, and associations. In Sweden, we have a long tradition of collecting data from the healthcare. These systems are called quality registers and are controlled by the Swedish Association of Local Authorities and Regions. Currently there are about 100 active registers in the country. The registers store information on an individual level about medical interventions, outcomes and procedures. They are integrated in the clinical workflow as a natural part of the system. National Quality Registries contribute to the strong position on health care results, where the country has among the best survival rates after heart attack, stroke, breast cancer and colorectal cancer. Collecting these data is a very natural thing to do and it is the only way to get the overall picture of the quality of the healthcare system. Unexpected artifacts or factors that are very difficult to predict can be caught in this structure.
2. How is registry data related to traditional research?
Through the years, the setup of hearing research has been to select about 20 subjects and then bring them to the laboratory and do measurements. Using this approach, each subject explains about five percent of the results. It is very easy to get into problems with selection bias and you cannot be sure that the selected participants are representative of a typical clinical population. It is difficult to generalize results from a low number of subjects and there is always a risk that the results will add blurriness to the topic. On the other hand, collecting information directly from the clinics guarantee that the data is representative and that we get a high number of subjects. A negative, however, is that the data collected from the clinics are under less control compared to laboratory experiments and we may also miss some interesting variables. The interesting meeting between registry data and research has been discussed for some years (Lauer & D'Agostino, 2013). I believe that this is an attractive complement to ordinary research and in some cases the only way to understanding.
3. How is hearing aid fitting related to this?
Some years ago, we began to receive questions from the clinics about how to improve the quality of the service. We were answering them as we used to do: use verification methods such as real-ear measurements and speech-in-noise tests, use a modern validated prescription formula as the starting point, perform fine tuning, and counsel the patient about hearing loss and hearing aids. However, this time the clinics were not satisfied with the answers. I remember clearly the comment from one clinician: “I have been responsible for this clinic for five years, and I still don’t know if I’m doing a good job or a bad job; it’s a bit frustrating. Even if I start collecting outcomes, I need to put it into context to understand the numbers.” We then realized that we had basis for starting a national quality register regarding hearing aid fitting. This was the tool needed to answer the questions from the clinics. We believed that this would also be helpful in putting the clinicians into context.
4. What do you mean by "putting into context"?
In sports, we are extremely good at putting ourselves or our favorite team into context. The results and performance statistics are then used as a tool for improvement. If you are a bit down in the standings, it is likely a good idea to learn from the individuals or teams higher up on the list. To continue jumping at the same spot where you are standing will not help you. While the primary interest in healthcare is not competition, context is very useful when working with quality improvement. However, it is seldom used within hearing aid fitting practices. With this solution, we can relay to the clinician whether performance is high, medium or low compared to other clinics that are relevant comparisons. An individual clinic can also follow their progress over several years to see if changes have an impact for patients. It is not uncommon that we find two clinics - with the same group of patients and located in the same district - that have large differences in results. It then becomes very natural to learn from each other when it comes to competence, methods and products. The solution we have now sends out a fully transparent list, every six months, to the clinics participating in the register. We have many examples of clinics making a journey; they start at a low level and after some time end up in the premium segment.
5. How is this done in practice? What variables are included in the collection process?
From the start, we realized that the staff at the clinic should not be involved in the collection process. The clinicians are already busy with handling the hearing aid fittings and other necessary administrative tasks. There is also a potential risk for bias if the information is collected by the clinic. In general, it is a good recommendation not to participate in the evaluation of yourself. Instead, the information from the clinics was collected automatically on a higher level directly from the journal system, which included audiogram, hearing aid model, personal identification number, age, gender, clinic name, etc. The objective data from the clinic is then integrated with subjective data from the client. The collection of Patient Reported Outcome Measures (PROM) are organized centrally. The current annual volume is 80,000 fittings, mainly bilateral, from 15 (out of 21) counties and 135 clinics.
6. How do you collect the data from the patients?
Over the last 50 years, there has been a decline in response rate for surveys in general (Morton, Bandara, Robinson, & Carr, 2012). Still, we need to collect data since the information from patients is necessary. There are many explanations to the drop in response rate, including the fact that nowadays we are all flooded with information from multiple sources. We need maximize the chances for a high response rate. Since the average age for a hearing aid user in Sweden is approximately 71 years, a postal solution is used to communicate the outcome questionnaire to the users. A postal distribution is still superior to any other electronic solution for this demographic in Sweden. The risk with an electronic survey, in addition to the lower response rate that we have seen, is that it introduces a computer experience bias, which is probably correlated to cognition and other factors. This will exclude an important group of clients – maybe the group with the greatest needs for hearing aids. The questionnaire is sent out six months after the hearing aid fitting to include time for acclimatization. It is also a recommendation not to mix delivery solutions for the surveys, e.g., partly postal and partly electronic. There is always a risk for bias when using different media, for example, the answer scale may not look the same, or the format may present differently. The response rate for the registry is about 55 percent.
7. What indicators or variables do you collect?
The instrument sent to the patients includes 23 questions. Some of the questions are then grouped into an indicator. The answer scale for all questions spans from one to five, with five as the most positive answer. The register mainly works with three indicators: the most important indicator is Satisfaction/Benefit, the second is Contact/Information, and the last indicator is Function.
- Satisfaction/Benefit. This indicator is based on the International Outcome Inventory for Hearing Aids (IOI-HA) and the indicator is calculated as the mean value of the seven questions included (Hyde et al., 2000).
- Contact/Information. This indicator is calculated as the average of five questions including the contact and information process to the patient, patient participation in the fitting, and treatment by the clinician.
- Function. This indicator includes simple but important questions regarding the functionality of the hearing aid. These questions collect information about uncomfortably loud sounds, feedback problems, sound quality and the ability to communicate in noise.
8. What can you see from all these data, are there any differences between the clinics?
This was the first question to answer. We expected to have differences, but we did not really know in the beginning. Sweden is relatively homogeneous in many aspects compared to other countries, with small differences in income, education and life span. Therefore, we were uncertain about the magnitude of the differences to expect in the data. Figure 1 illustrates the results for bilateral fittings from 84 clinics. Clearly, there are significant differences for the indicator Satisfaction/Benefit. Notice that the score for the clinics on the far right in the figure is about 0.4 units lower than the score of the clinics on the far left.
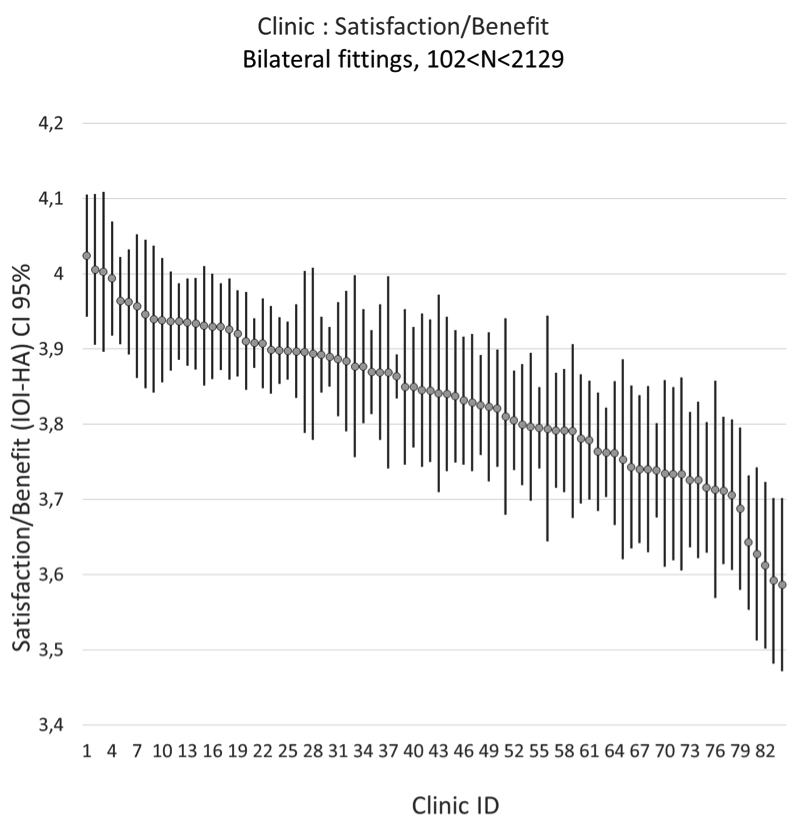
Figure 1. Satisfaction/Benefit indicator of bilateral fittings from 84 clinics - mean of IOI-HA and 95% confidence interval.
9. How do you know whether the differences are clinically relevant?
This is a very good question. Should the clinics take action due to do the differences? Often in research we forget or avoid discussing whether the significant differences we find are clinically relevant. In general, all differences we can find in the register are significant due to the large number of fittings. Therefore, we started to focus on how to connect the scales we are using to activities or tasks that are relevant for the clinician. For example, is a 0.4 difference between the clinics in Figure 1 something that should be considered?
Table 1 illustrates the IOI-HA scores (both the total/average and the scores for the individual items 1-7) for 120,677 hearing aid fittings. The table also displays results for different subcategories. The difference in score between unilateral (3.70) and bilateral (3.85) fittings is 0.15 (p = e-16) units on the national level. Research suggests that a bilateral fitting gives the patient better speech understanding in noise and better sound localization (Ahlstrom, Horwitz, & Dubno, 2009; Dawes, Munro, Kalluri, & Edwards, 2013; Goverts, Kramer, Festen, & Dreschler, 2008; Kobler & Rosenhall, 2002). A bilateral fitting involves more tasks for the clinician and has a higher cost both in hearing aids and in time for the fitting, so it is important to know if there is a significant difference between unilateral and bilateral fittings. The unilateral/bilateral difference was significant for one of the seven sub-scales. That is, a difference of one unit for the range of 1-5 was present. The unilateral/bilateral difference is considered as clinically relevant in the register.

Table 1. IOI-HA table for 120,677 hearing aid fittings divided into subcategories. The scale has seven questions which relate to: Use (hours of use per day), Benefit, RAL (residual activity limitations), Sat (satisfaction), RPR (residual participation restrictions), Ioth (impact on others), and QoL (quality of life).
10. Do these differences matter?
Suppose that the clinics with the highest bilateral score in Figure 1 were forced to do only unilateral fittings for all patients: they would then lower their score by 0.15 units on average. Still, the highest ranked clinics will have a total score that is higher than the second half of clinics doing bilateral fitting (e.g. 4.0 – 0.15 = 3.85). This suggests that we have large differences in performance between the clinics.
11. What more can you see from the data? Is there a difference between first-time patients and return patients?
Yes, it takes time to get the full effect of a hearing aid. In Table 1 we can see that Quality of Life (QoL) is larger for return patients using hearing aids for more than one year (3.81) as compared to first time patients (3.57). The hearing aid usage (Use) follows the same pattern with higher scores for return patients. Quality of life is also higher for the bilateral group (3.75) compared to unilateral (3.58). The only difference that we can see between genders is for factor Impact on others (Ioth), where males are more worried that their hearing problems bother others.
12. Is the degree of hearing loss a factor that can explain variation in IOI-HA scores between the clinics?
The audiogram is an objective measure that is used by all the clinics. It is standardized unlike other measurements such as speech-in-noise testing. It is also mainly the only input variable to the fitting modules. A few clinics in the registry are specialized for patients with severe hearing losses (i.e., 70 dB HL or worse). These clinics are handled separately in the analysis. This group of patients often needs resources from other disciplines than audiologists. Besides that, we notice that the degree of hearing loss has little impact on the indicator satisfaction/benefit. This is illustrated in Figure 2, where each dot represents a patient. The average pure tone average (PTA) (500 Hz, 1k Hz, 2k Hz, 4k Hz) difference between clinics are of the order of 5 dB or less. In Figure 2 we notice that the indicator is almost independent of PTA. PTA is therefore not a strong factor that can explain the variation between the clinics. The weak correlation between IOI-HA and PTA is explained by the individual items used in IOI-HA. All seven items in Table 1 are important as a measure of the outcome of the hearing aid fitting. However, some of the items have a positive correlation with PTA (items 1,2,4,7) and the remaining (3,5,6) have a negative correlation with PTA (Arlinger, Nordqvist, & Oberg, 2017).
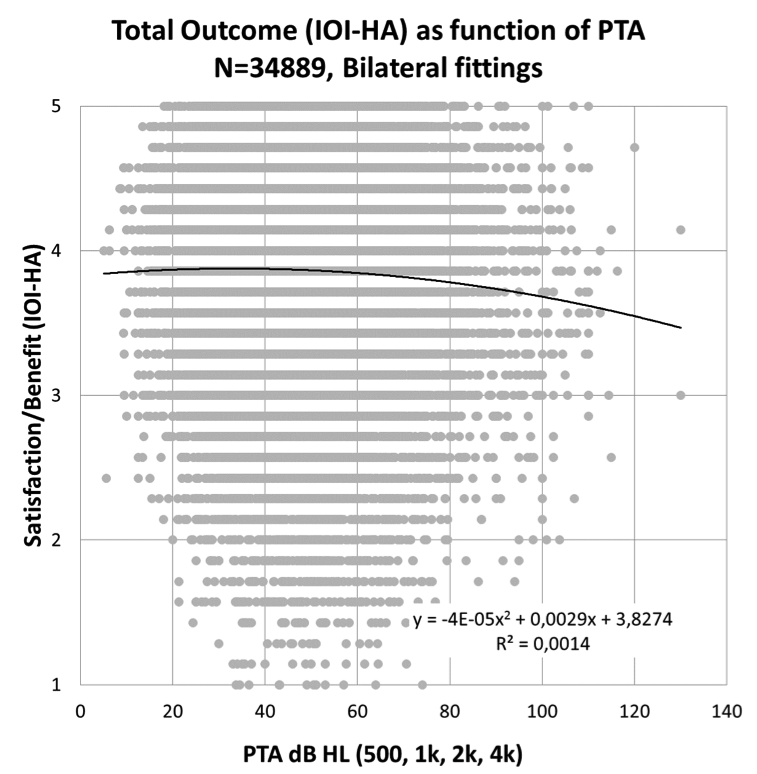
Figure 2. Satisfaction/Benefit (IOI-HA) as a function of pure tone average (PTA).
13. How about the indicator "Contact/Information," which you described earlier?
The audiologist should inform the patient about hearing loss, its causes and how it will affect daily life. Information should also be presented regarding hearing aids, how they work and provide reasonable expectations. For example, the audiologist should provide information about how hearing aids do a good job in quiet surroundings but substantially increasing speech intelligibility in noise is still a difficult task to solve. The audiologist should also listen to the patient when describing his or her needs and daily problems with hearing loss. The patient should also be involved as much as possible in the fitting process. The indicator Contact/Information collects information about these activities. Figure 3 illustrates the results for the Contact/Information indicator for 86 clinics. Clearly, we can see differences between the clinics. How the information to the patient is handled varies among the clinics. We know when discussing the results with the clinics that they are using different approaches.
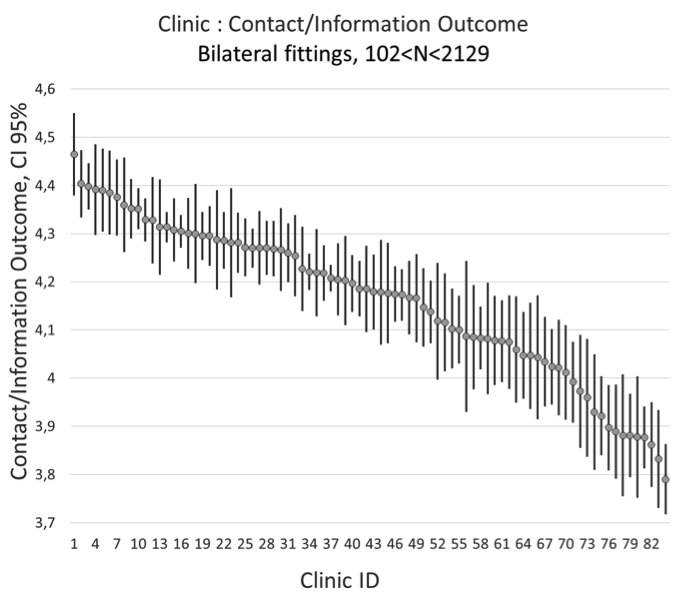
Figure 3. Contact/Information indicator of bilateral fittings from 84 clinics.
14. Is the amount of information obtained at the clinic related the IOI-HA outcome?
Yes it is. Improving the information to the patient is one of the factors that is relatively easy to change and is often the first recommendation when discussing the results with the clinics. We can also see that this factor has correlation with Satisfaction/Benefit. A scatter plot for the clinics is illustrated in Figure 4. Each dot is not a patient, but the average for all patients from the corresponding clinic. We notice a correlation where the clinics that are more focused on the information process also have higher values for satisfaction/benefit.
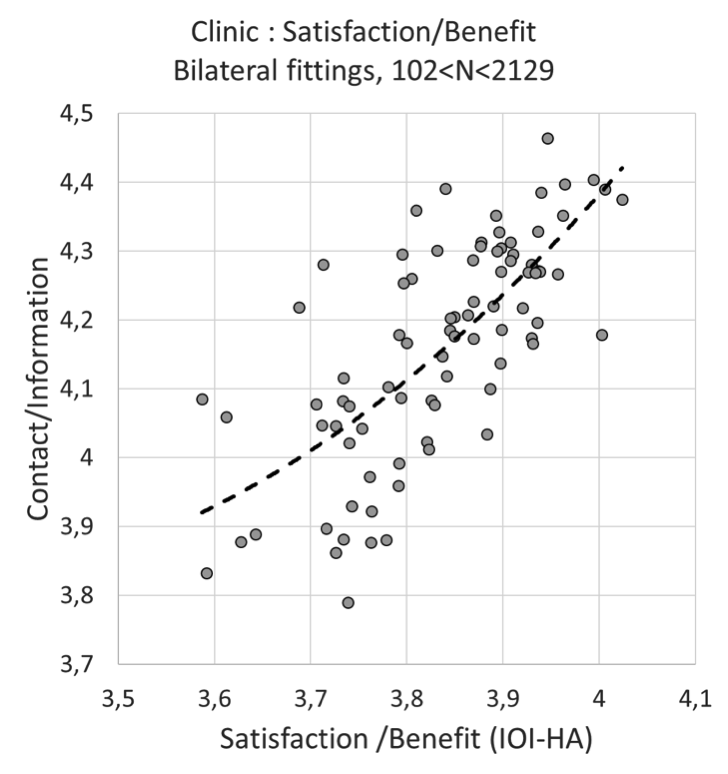
Figure 4. Contact/Information indicator as function of Satisfaction/Benefit - results of bilateral fittings from 84 clinics.
15. Did you see geographical differences? Does it matter where you live?
The counties involved in the registers participate with all fittings. This means that everyone who gets hearing aids is included and there is no selection bias. The annual fitting volumes for each county vary between 2000 and 20,000. The counties are independent of each other and there is no national regulation in the healthcare system. The differences we can see are illustrated in Figure 5. In the beginning, we thought that the differences would even out when incorporating larger regions in the comparison, but that was not the case. There are significant differences between some of the counties, and the difference between the two extremes (far left compared to far right), in the figure is larger than the difference between bilateral/unilateral fitting (0.15) displayed in Table 1, which we consider clinically relevant. So, yes, it matters where you live when getting a hearing aid. The overall fitting process is likely to be better in the counties to the left in Figure 5. This is a strong indication that we have systematic differences in methods, information process or products.
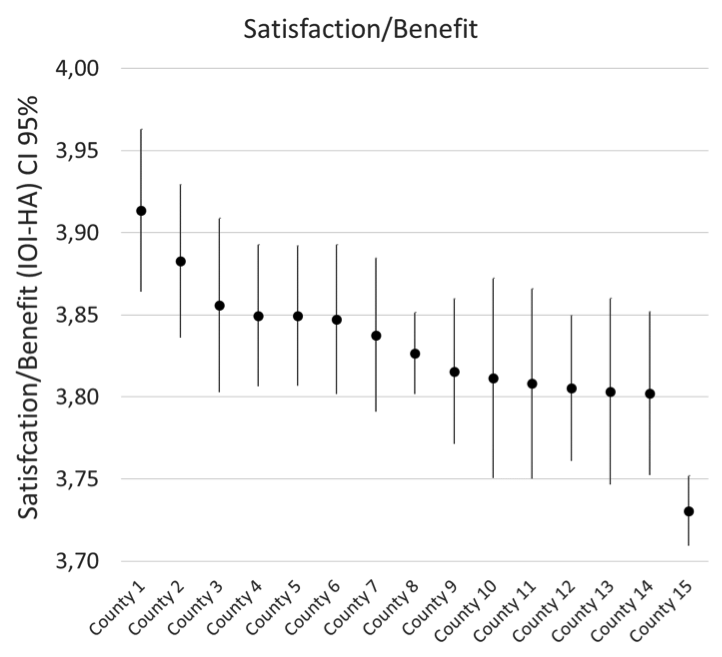
Figure 5. Satisfaction/Benefit - results from 15 counties in Sweden.
16. When talking about products or hearing aids, what can you see from that, does it matter?
The register is participating in a project sponsored by the International Research Consortium (IRC). IRC is an organization for the hearing aid manufacturers. The object of the project is to see which factors make a difference for the patient. All variables that are available will be analyzed with machine learning methods. We are currently working on that, and the project will be reported later this year. Some of the more basic results have been already presented (Arlinger et al., 2017). The Function indicator measuring the basic functionality of the hearing aid reported by the users shows some differences. Figure 6 illustrates the result for the counties and we can see that there are some significant differences, which is interesting. The counties use different configurations of hearing aid manufacturers and models. We also notice that the variance for the Function indicator is slightly less compared to the variance for indicator Satisfaction/Benefit.
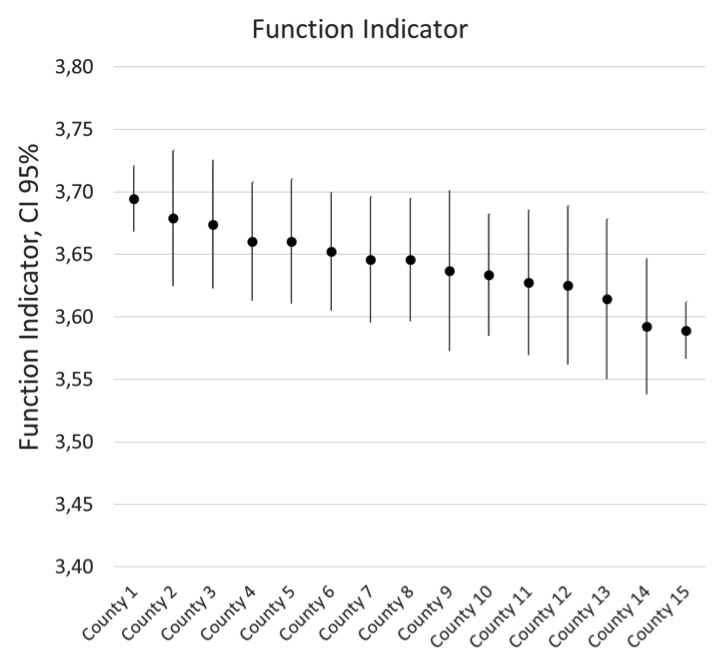
Figure 6. Function indicator: uncomfortable loud sounds, feedback problems, sound quality, and communication in noise - results from 15 counties in Sweden.
17. Your Function indicator contains four dimensions. Do you think that they all are equally important for the patient?
The Function indicator collects information regarding uncomfortable loud sounds, feedback problems, sound quality, and communication in noise. When correlating each dimension with Satisfaction/Benefit we notice that sound quality and communication in noise have higher correlation (0.66 and 0.62 respectively) compared to uncomfortable loud sounds (0.20) and feedback problems (0.16). Of course, this will vary slightly depending in the instrument used to measure benefit.
18. Have you followed the discussion of using over the counter (OTC) hearing aids in the US? What is your opinion on that, based on your work?
Yes, I have heard about that. I guess one of the long-term goals is to lower the average age for first time users with mild hearing losses. In Figure 2 we can see that patients with mild hearing losses (PTAs of 5-20 dB HL) report outcomes on the same level as patients with moderate to severe hearing losses. The group of people with mild hearing losses benefit from using a hearing aid. However, in Sweden, you do not always get a hearing aid for PTAs below 25 dB HL financed by the public healthcare system. If we consider the future, when OTC products are available, then the rationale must be that hearing aids are better than no hearing aids, despite the missing contact with the clinic. It would be interesting to compare outcomes for the OTC group, when available, with the results we have. However, the majority of our hearing aid fittings are not with people who have mild hearing losses; they are with people 65 years or older with a moderate or worse hearing loss. For that group, I believe that contact with the clinic and the audiologist is absolutely necessary to ensure an acceptable benefit. The Contact/Information indicator gives us an indication in that direction.
19. After working with “big data”, what is your personal reflection?
When I started to work in the field, I was developing algorithms used by the hearing aids. My particular interest at that time was within automatic sound classification of listening environments. I remember that my focus, and also that of many others, was on the hearing aid in isolation. The hearing aids have developed immensely through the years, and they are maybe one of the most advanced assistive devices used by the healthcare today. When working with this material, it is clear that also other factors impact the final outcome, as measured when the hearing aids are used in daily life by a patient. It is very important to see the complete picture when working with quality improvements.
20. Would you say that big data within healthcare is here to stay?
It is a very attractive instrument when working with quality improvements. It can also be a complement to traditional research. In addition, the system works as a whistle blower for events that are difficult to predict. So yes, I believe that collection of data on a large scale is here to stay. Big data also makes the work more interesting for the audiologists and the clinics. Working but never getting any feedback is not very stimulating. It is also clear that all stakeholders benefit from this in the long term: audiologists, clinics, hearing aid manufacturers and researchers. Our goal, of course, is that the patients themselves will benefit, too. We definitely encourage more countries or regions to follow.
Acknowledgement
We thank all counties in Sweden that participate in the quality register as well as the Hearing Industry Research Consortium (IRC) for a research grant and valuable input to the project.
References
Ahlstrom, J.B., Horwitz, A.R., & Dubno, J.R. (2009). Spatial benefit of bilateral hearing AIDS. Ear and hearing, 30(2), 203-218.
Arlinger, S., Nordqvist, P., & Oberg, M. (2017). International Outcome Inventory for Hearing Aids: Data from a large Swedish quality register database. American Journal of Audiology, 26(3), 443-450.
Dawes, P., Munro, K.J., Kalluri, S., & Edwards, B. (2013). Unilateral and bilateral hearing aids, spatial release from masking and auditory acclimatization. The Journal of the Acoustical Society of America, 134(1), 596-606.
Goverts, S.T., Kramer, S.E., Festen, J.M., & Dreschler, W.A. (2008). A prospective multi-centre study of the benefits of bilateral hearing aids. Ear and Hearing, 29(6), 930-941.
Hyde, M., Gatehouse, S., Noble, W., Dillon, H., Bentler, R., Stephens, D., . . . Hallberg, L. (2000). Optimal outcome measures, research priorities, and international cooperation. Ear and Hearing, 21(4), 106-115.
Kobler, S., & Rosenhall, U. (2002). Horizontal localization and speech intelligibility with bilateral and unilateral hearing aid amplification. International Journal of Audiology, 41(7), 395-400.
Lauer, M.S., & D'Agostino, R.B. (2013). The randomized registry trial — The next disruptive technology in clinical research? New England Journal of Medicine, 369(17), 1579-1581.
Morton, S.B., Bandara, D.K., Robinson, E.M., & Carr, P.A. (2012). In the 21st century, what is an acceptable response rate? Australian and New Zealand Journal of Public Health, 36(2), 106-108.
Citation
Nordqvist, P. (2018, May). 20Q: Hearing aid fitting and big data - put yourself in context. AudiologyOnline, Article 22902. Retrieved from www.audiologyonline.com

