From the Desk of Gus Mueller
![]() In the world of fitting hearing aids, we’re usually working with a downward sloping hearing loss. Our favorites are the patients who have a 30-40 dB loss in the lows, sloping down to 50-60 dB in the highs—sometimes even referred to as “easy to fit” (if there is such a thing). But there are also the patients who have a more precipitous loss, which drops down to 70-90 dB or more in the highs. Not so easy. In the past, we typically had two choices with these patients: Crank up the gain in the highs, hope that some audibility is better than no audibility and that we don’t run into feedback; or, roll off the gain in the highs, eliminating potential feedback problems and maybe even getting a “sounds better” from the patient. Today, we have a third choice—frequency lowering.
In the world of fitting hearing aids, we’re usually working with a downward sloping hearing loss. Our favorites are the patients who have a 30-40 dB loss in the lows, sloping down to 50-60 dB in the highs—sometimes even referred to as “easy to fit” (if there is such a thing). But there are also the patients who have a more precipitous loss, which drops down to 70-90 dB or more in the highs. Not so easy. In the past, we typically had two choices with these patients: Crank up the gain in the highs, hope that some audibility is better than no audibility and that we don’t run into feedback; or, roll off the gain in the highs, eliminating potential feedback problems and maybe even getting a “sounds better” from the patient. Today, we have a third choice—frequency lowering.
The notion regarding frequency lowering is that patients can benefit from hearing high frequency speech and environmental sounds when these signals are delivered to a lower frequency. That is, if a 4000 Hz consonant is delivered to the patient at 2000 Hz, of course it isn’t going to sound the same, but maybe this altered signal is still better than not hearing that consonant at all. Frequency lowering algorithms are available from several manufactures, and there are different schemes applied. So we not only have to think about the concept of frequency lowering in general—does it really work—but we have to ask if the scheme of one manufacturer is better than the others? Maybe some work and others don’t? That’s a lot of thinking! But fortunately, help has arrived.
Gus Mueller
Joshua M. Alexander is an assistant professor at Purdue University in West Lafayette, Indiana. A proud Cheesehead by birth, he received his Ph.D. in audiology and post-doctoral training at the University of Wisconsin in Madison. Before coming to Purdue, he completed both a clinical and a research fellowship at Boys Town National Research Hospital in Omaha, Nebraska, where he further developed his expertise in hearing aids.
When he is not teaching his amplification courses at Purdue (or tending to his three young daughters), Josh can be found in his Experimental Amplification Research (EAR) laboratory. His research interests combine his roots in hearing science, speech perception, and amplification. Currently, the focus of his research is on auditory processes contributing to speech perception deficits in hearing-impaired listeners and different signal processing strategies to overcome them.
Dr. Alexander has two patents pending, one for speech enhancement and another for, well you guessed it, frequency lowering. He reports that his frequency lowering method is unique because it goes where most other methods leave off. His method is targeted towards patients with severe bandwidth restriction and attempts to minimize some of the tradeoffs mentioned in this 20Q.
As you’ve maybe noticed, there aren’t many generic articles about hearing aid frequency lowering available. If you’ve been looking for a good one, you came to the right spot. In this excellent 20Q review, Josh nicely lays out the pros and cons of this technology, describes who may or may not be a candidate, and then effectively explains how the different systems work. Just about all you need to know!
Gus Mueller, Ph.D.
Contributing Editor
April 2013
To browse the complete collection of 20Q with Gus Mueller articles, please visit www.audiologyonline.com/20Q
Editor's Note: While indeed, Dr. Alexander did provide just about everything you need to know about frequency lowering in this month's 20Q, there are a few more topics to cover. And we're in luck, as next month Susan Scollie, PhD, will join us to talk a little more on this intriguing technology. Dr. Scollie will take us into the clinic and provide thoughts about fitting applications, as well as verification strategies, with a couple research caveats included as well. This line up just might be the best back-to-back since Mantle and Maris!
20Q: The Highs and Lows of Frequency Lowering Amplification

Joshua Alexander
1. I'm starting to hear about frequency compression from just about all the hearing aid manufacturers. Is this something I should routinely be considering for my patients?
Whether you should be considering it requires some discussion, but first let’s talk about terminology. You say “frequency compression,” but that is just one of several methods to accomplish “frequency lowering,” which is the preferred term for this application.
2. Okay, frequency lowering it is. First, how do I know which patients will benefit from this technology?
The short answer is that we really don’t know who will and who will not benefit yet. Part of the reason is that there are only about a dozen peer-reviewed studies on modern frequency lowering techniques. Furthermore, there is a lack of consistency across studies, and sometimes within the same study, in terms of how the frequency lowering settings were chosen for each research subject. The consequence is that variation in benefit (or the lack of it) between subjects and studies may depend upon how the settings were chosen. We also have to consider what metric was used to assess benefit because it can make a big difference if we are comparing detection of plural “s” in a controlled laboratory experiment to ratings of perceived speech intelligibility in real-world environments.
3. How do I know what settings to choose for my patient in order to increase the likelihood of benefit – regardless of how it is measured?
I can answer this better once I explain the different frequency lowering techniques. In case I lose your attention before I get there, I want to let you know that I have developed several online tools for this purpose. These can be found at www.TinyURL.com/FLassist. For now, let’s continue to discuss benefit and why it depends on different factors. I find it easier to separate the factors into two different categories: those that are extrinsic and those that are intrinsic to the individual. By extrinsic, I mean the factors that determine the amount of information in the signal after processing by the cochlea. These include: (1) the acoustics of the actual speech sound and of any competing background noise; (2) what the specific frequency lowering technique and settings do to this input; and (3) how the impaired cochlea processes the newly coded speech signal. By intrinsic, I mean the factors that influence an individual’s ability to make use of and to learn the new and altered speech cues processed by the cochlea (e.g., the patient’s age at the time of fitting, the patient’s age at time of hearing loss onset, experience with the processing, etc.).
To keep it simple . . .
The simpler, the better.
. . . speech acoustics play an essential role in determining benefit. The main conclusion from a recent review of the literature on modern frequency lowering techniques is that when frequency lowering shows a benefit for speech recognition, it is primarily for fricative consonants (Alexander, 2013). To illustrate why this is, a spectrogram of a female talker speaking the sentence, “children like strawberries” is shown in Figure 1.
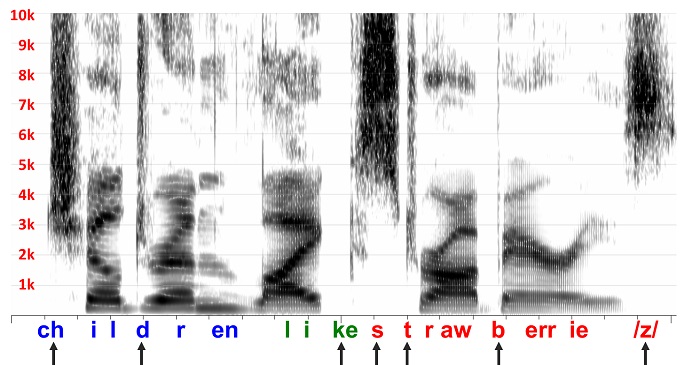
Figure 1. Spectrogram of a female talker speaking the sentence, “children like strawberries”.
The arrows along the bottom indicate the speech sound classes with significant high-frequency energy. One reason we tend to see benefit only for fricatives, and occasionally for affricates and stop consonants, is because benefit is related to the size of the deficit. Perception of these sounds suffer most because some portion of the cues necessary for identification are inaudible due to the fact that they occur at frequencies where hearing loss tends to be the most severe and where the frequency response of the receiver is lowest.
4. So, where does frequency lowering come into play?
If you look again at the spectrogram, you will notice that fricative and fricative-like sound segments are characterized by a spread of noise-like energy that we call ‘frication’ across a wide frequency range. In other words, they are ‘spectrally diffuse.’ These acoustic properties probably make them good candidates for frequency lowering.
5. I don’t understand; what do you mean by ‘good candidates’?
Usually, when we refer to ‘candidates’ for a certain hearing aid processing strategy, we think of people; but in case you haven’t noticed, for now I have shifted the conversation away from people and towards the sounds that we wish to perceptually restore. What I mean by ‘good candidates’ for frequency lowering is that the information carried by the higher-frequency spectrum is not as frequency-specific as the lower-frequency spectrum, which is dominated by formants. Recall from undergraduate speech science that the relationship between formant frequencies is critical to the identity of most speech sounds, especially the vowels. Furthermore, even in the unimpaired cochlea, frequency tuning becomes broader as frequency increases. So, by design or by accident, the least frequency-specific information is processed by that part of the cochlea with the broadest tuning. Consequently, changing the frequency of information carried by frication is more ‘perceptually forgiving’ compared to changing the frequency of information carried by the formants.
To come full circle, then, individuals who are candidates and who might experience benefit from frequency lowering are those who experience speech perception deficits with conventional amplification due to insufficient high-frequency audibility in terms of level and bandwidth.
6. What kind of ‘speech perception deficits’ are we talking about?
One of the strongest demonstrations of the negative consequences of high-frequency inaudibility associated with conventional amplification comes from a longitudinal study by Mary Pat Moeller and colleagues (Moeller et al., 2007). They enrolled 10-12 month-old children in their study then tracked their phonetic inventories for about one year. The children with sensorineural hearing loss had been identified at birth and were fitted with appropriate amplification early (around 5 months of age, on average). Probe-microphone measures were used to confirm that the hearing aid output levels closely matched DSL v4.1 prescriptive targets. They found that, despite early intervention, the hearing-impaired children made very little progress in terms of fricative and affricate production over the course of the 12-month study. In fact, while the hearing-impaired children began to catch up to their age-matched normal-hearing peers in the production of vowels and other consonant sound classes (stops, nasal, glides, and liquids), they fell further behind in the production of fricatives and affricates. Six of the 10 children in this study had thresholds ≤ 65 dB HL at 8 kHz, indicating that despite early intervention, limited aided audibility can be a significant problem even for children with mild to moderate losses.
7. I get it. So is frequency lowering something I should consider only for my pediatric patients?
We might expect to see a greater amount of benefit in children compared to adults simply because they appear to have a greater deficit when listening to speech under identical conditions. Reasons for this include the fact that adults are able to take advantage of linguistic knowledge to help them fill in the information they are missing. Because children, especially hearing-impaired children, don’t have as rich a linguistic background, they need more advantageous signal-to-noise ratios when identifying speech in noise (Nittrouer and Boothroyd, 1990; Fallon, et al., 2002; Hall et al. 2002). Important for this discussion, they also seem to benefit more from an increase in signal bandwidth compared to adults (Stelmachowicz et al., 2001; Kortekaas and Stelmachowicz, 2000). It is reasonable, then, to hypothesize that the same difference in benefit will occur when additional information is made available with frequency lowering.
To get at the heart of your question, there are several studies that indicate that adults can and do benefit from frequency lowering (Simpson et al., 2005; Alexander et al., 2008; Kuk et al., 2009a; Glista et al., 2009; McCreery et al., 2012; Alexander, 2012; Kopun et al., 2012). This alone would indicate that you should not exclude adults when considering frequency lowering hearing aids. In terms of who will benefit more, the jury is still out. It is inappropriate to make comparisons across different studies, especially with frequency lowering because, as mentioned, there is not general consistency in how the settings are chosen for each individual. With conventional amplification, we at least have a pretty good idea about how to best set the gain and how to verify how well we accomplished our goal. As I will discuss later, the settings chosen for frequency lowering can make a big difference in outcomes if done incorrectly.
There are only a few studies on frequency lowering that included both adults and children. One study by Glista and colleagues on individuals with sloping high-frequency sensorineural hearing loss ranging from moderately-severe to profound found that children were more likely than adults to show an improvement in plural recognition (which are fricatives, or course) with frequency lowering (Glista et al., 2009). However, as the authors point out, it is unknown whether this difference is due to developmental differences or to the fact that children were given 5 to 10dB more gain than adults as prescribed by the DSL method. Another recent study by my colleagues at Boys Town National Research Hospital found a significant improvement in monosyllabic word recognition with frequency lowering for both adults and children with mild to severe sensorineural hearing loss (Kopun et al., 2012). However, there was no significant difference in the amount of benefit between groups.
8. Earlier, you also mentioned mild-to-moderate losses. You don’t actually propose using frequency lowering for these losses do you?
To help you understand what we are facing, look at Figure 2, which shows the frequency response of a typical hearing aid receiver. You can see how the response rolls off sharply above 5000 Hz, which unfortunately for most of the patients we see, is also where hearing loss is the greatest. Another thing to consider is that the SPL of speech decreases at high frequencies, so listeners with any appreciable hearing loss in this region are hit with a double whammy. Speech scientists know this all too well. Remember the speech spectrogram I showed you in Figure 1? The difference in SPL between the high and low frequencies is so great that we have add 6 dB gain per octave in order to see the energy in the high frequencies.
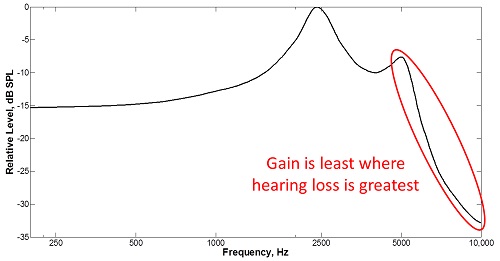
Figure 2. Frequency response of a typical hearing aid receiver
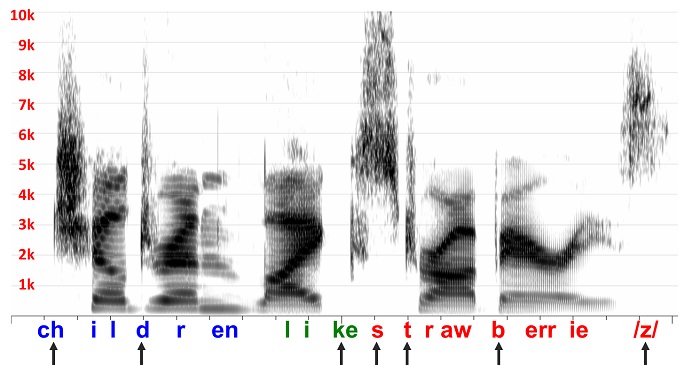
Figure 3. High frequency frication energy disappears when the speech sample from Figure 1 is subjected to the receiver response from Figure 2.
Figure 3 shows what happens when I filter the speech in Figure 1 with the receiver response in Figure 2. You can see how much of the high frequency frication energy disappears when I do this. When you factor in the fact that this display adds about 18 dB of gain at 8000 Hz relative to 1000 Hz (perhaps, not unlike a typical insertion gain response) and, that there is hearing loss in this region, you see why high-frequency speech cues cannot be made audible with conventional amplification. So, to the extent that listeners with these milder losses have difficulty perceiving speech sounds with frication (that is, experience deficits) despite our best efforts to provide high-frequency amplification with conventional amplification, there might be some value to trying frequency lowering. The Moeller et al. (2007) study mentioned earlier indicates that young children with mild-to-moderate high frequency loss do indeed have deficits despite being fitted appropriately with conventional amplification. Now I hope you can understand why.
9. What about adults with mild-to-moderate loss?
We also have some data that indicates that adults with mild-to-moderate loss can benefit from at least one form of frequency lowering when identifying fricatives and affricates with minimal context in noise (Alexander et al., 2008; Alexander, 2012). I conducted a study using 24 listeners with normal hearing and 24 listeners with mild-to-moderate sensorineural loss who identified fricatives and affricates in isolated nonsense syllables in speech-shaped noise with a 10 dB signal-to-noise ratio (Alexander et al., 2008). The speech was recorded through two frequency lowering hearing aids and played back to listeners over headphones so that I was able to ensure maximum audibility without risk of feedback. The recordings made with frequency lowering deactivated (that is, conventional amplification) were audible for most listeners through 5 kHz, where the frequency response of the hearing aids rapidly dropped off. A ‘wideband’ condition was created in which I added back the original speech to the recordings so as to make it audible almost out to 9 kHz, on average. Consistent with previous studies by Pat Stelmachowicz and colleagues, the hearing-impaired listeners performed significantly better for the wideband condition compared to the condition with only conventional amplification (Stelmachowicz et al., 2001, 2007; Pittman and Stelmachowicz, 2000). For two of the frequency lowering conditions, performance was also significantly better than the condition with only conventional amplification. Performance for these two frequency lowering conditions was also statistically the same as the wideband condition, indicating that these methods were able to transmit whatever frication information was lost due to the restricted bandwidth of the conventional hearing aid processing.
However, keep in mind that these conditions represent a sort of best-case scenario for frequency lowering in this group because we used low-context speech sounds dominated by high-frequency content, spoken by female talkers embedded in low-frequency, speech-shaped noise. The observed effects are likely smaller for words in sentences, but at least we know that there is the potential to benefit without much risk of doing harm. An important caveat is that positive findings occurred for only one of the methods of frequency lowering. The immediate effect of the other method had disastrous consequences. I will point this out later when I make a distinction between the methods and discuss how they might interact with audiometric configuration to influence observed benefit.
10. If I follow your logic correctly, then those with more severe losses should experience even greater benefit from frequency lowering, right?
In theory, yes. But only up to a point. Historically, frequency lowering has been reserved for the most severe losses only. Given the restricted bandwidth we had to work with (e.g., 1500-2000 Hz), it made sense to try. However, early frequency lowering techniques targeted towards this population met with varying success (see Simpson, 2009 for a review). Now, one can reasonably argue that this was in part due to the technology in use back then. However, I think that there is more to it.
The cruel irony is that as the severity of loss increases, so do the potential negative side effects associated with frequency lowering. Remember earlier, when I said that frequency manipulation of the formants was less perceptually forgiving due to their frequency-specific nature? Basically, I mean that we need to avoid doing too much to alter the first two primary formants. The problem is that with more severe hearing losses, not only is there more lost information that needs to be restored, but there is also a smaller region of audibility available for recoding it. In other words, it becomes increasingly difficult to lower high-frequency speech without distorting the low-frequency speech that would otherwise be amplified normally. Furthermore, as frequency range of audibility narrows, eventually a tradeoff emerges in terms of the amount of high-frequency spectrum that is lowered and the ‘quality’ of that information.
On the flip side, if done correctly, the risks associated with frequency lowering diminish for more mild hearing losses because it becomes increasingly possible to place high-frequency speech cues in a region not occupied by the first two formants (i.e., above 2500-3000 Hz). But, as you so wisely pointed out, there is less deficit associated with these losses and so less overall value to using frequency lowering. In summary, due to opposing effects, the overall benefit-cost ratio probably varies less than one would think as a function of hearing loss.
11. I have heard a lot of talk about using frequency lowering to avoid so-called “dead regions.” What are your thoughts on this?
To answer your question, let’s review what we think we know about dead regions. Because we are concerned with frequency lowering, we will talk only about high-frequency dead regions and ignore patterns of dead regions associated with other audiometric configurations (e.g., reverse slope hearing losses). The general idea is that the value of amplification decreases with moderately-severe sensorineural hearing loss due to progressively increasing amounts of inner hair cell damage and the increased presentation levels needed to restore partial audibility (Hogan and Turner, 1998; Ching et al., 1998; Turner and Cummings, 1999). Total inner hair cell loss at a particular place on the basilar membrane results in a significant increase in thresholds and is termed, ‘dead region’ by Moore and colleagues (Moore, 2004). A hallmark feature of high-frequency dead regions specifically is a precipitous drop in thresholds (Moore, 2004). In case you are wondering how something that is supposedly “dead” can generate a “threshold,” the reason is that detection of tones or speech at these frequencies occurs at a healthier place on the cochlea due to spread of excitation at high presentation levels. In the case of high-frequency hearing loss, the places of detection correspond to lower characteristic frequencies. Therefore, in a sense, detection of sounds at frequencies corresponding to a dead region is an innate form of frequency lowering!
Moore and colleagues also indicate that providing audible amplification to frequencies beyond a limit equal to 1.7 times the lowest frequency of the dead region may cause some individuals to experience a decrease in speech intelligibility in quiet (Vickers et al., 2001; Baer et al., 2002). The implication is this frequency is the point at which we should stop trying to amplify normally and start lowering. One problem with using this as a criterion is that for many of the hearing losses that we would consider using frequency lowering, this frequency is already going to be un-aidable, so it’s a moot point.
For patients with dead regions accompanied by less severe thresholds, then you might use the above information as a reason to stop providing gain in the high frequencies, especially if feedback is a problem. If you plan to do this and if you feel that you can reliably measure dead regions in the clinic (see Summers, 2004 for counter arguments), then you should be aware that other studies using listeners with losses of the severity usually associated with dead regions have indicated that providing as wide a band of amplification as possible can be beneficial when the speech is in noise (Turner and Henry, 2002). More recent studies that have actually screened for dead regions, including recent studies by Robyn Cox and colleagues have not found high-frequency amplification to be detrimental for recognition of speech in quiet or in noise (Mackersie et al., 2004; Cox et al., 2011, 2012).
12. So should I or should I not consider using frequency lowering for individuals with dead regions?
All I am suggesting is that, based on the information available (or lack thereof), you should not use the possibility of a dead region as an excuse to implement frequency lowering in a way that limits the audible bandwidth you give to your patient. In fact, maximizing the audible bandwidth (dead regions or not) is the first step in my recommended procedures for deciding on which frequency lowering setting to use.
13. But, won’t the additional bandwidth make the hearing aid unnecessarily loud?
Dillon (2012) has an excellent discussion about high-frequency amplification and dead regions in his latest book. To paraphrase, he states that the excessive high-frequency amplification that leads to excessive loudness is caused by excessive gain and not necessarily by excessive bandwidth. Recall that loudness and the fact that effectiveness of audibility for speech intelligibility decreases as thresholds increase (a phenomenon termed, ‘desensitization’) are factored into the NAL prescriptive targets. These factors serve to lower the targets in these regions with the intent of keeping loudness ‘in check.’
To keep it simple and to avoid further confusion, here’s what I recommend. Whatever frequency lowering method you plan on using, first deactivate it, and adjust the hearing aid to targets using whatever rationale (NAL, DSL, etc.) and clinical intuitions you normally bring to a conventional fitting. I will tell you what to do with this information later.
14. Okay, now my coffee is starting to get cold and I am almost out of questions. How do the methods of frequency lowering differ from one another?
There is a lot that can be said about this, so I will provide a brief summary here and refer you to my recent review article for a more complete discussion (Alexander, 2013). First, let’s discuss terminology. The part of the spectrum where information is moved from is the source region, and the part of the spectrum where information is moved to is the target region. The lowest frequency in the source region is the ‘start frequency.’
Frequency compression techniques can be best understood by making the obvious analogy to amplitude compression. The start frequency with frequency compression is like the compression threshold with amplitude compression - all of the action occurs above it. Put another way, the start frequency is like an anchor that does not move, with spectral information above it moving down toward it. Just as dynamic range is reduced with amplitude compression, the source bandwidth is reduced with frequency compression such that the information after lowering (the target region) is confined only to frequencies above the start frequency.
Frequency transposition or translation techniques are like a copy and paste procedure. Information from a portion of the source region (possibly including the start frequency itself) is resynthesized at lower frequencies. I used the term “copy” and not “cut” because the original information in the source spectrum above the start frequency is often retained up to a certain frequency, rather than filtered away.
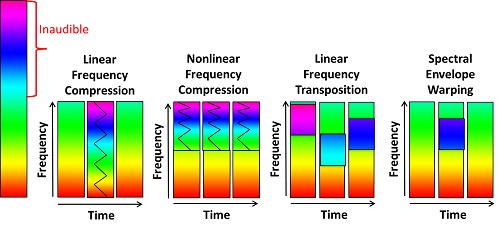
Figure 4. A visual representation of how different frequency lowering methods affect the signal.
Figure 4 is a visual illustration to help demonstrate the differences between the frequency lowering methods. The colored bars represent frequency, red for low frequency and violet for high frequency. The tall bar to the left represents the entire frequency range from 1 Hz (red) to 8000 Hz (violet), for example. In this hypothetical scenario, everything above the mid-frequency region (green) is inaudible.
The first two methods depicted are frequency compression techniques. AVR Sonovation introduced linear frequency compression over 20 years ago, while Phonak, Unitron, and Siemens use nonlinear frequency compression in their hearing aids.
15. Wait a minute! How can frequency compression be a linear process? Isn't frequency compression by definition a nonlinear process?
You sound like the engineering students who occasionally find their way into my course! Okay, you got me; but don’t blame me, I didn’t come up with the terminology. In retrospect, I think that the linear-nonlinear distinction is being used in two ways. The first is the actual math. Linear frequency compression can more appropriately be thought of as “proportional” because the remapping of frequency can be modeled using a simple linear equation: fout = α(fin), where fin is the frequency before lowering, fout is the frequency after lowering, and α is a fraction that varies from 1/2 to 1/5. In other words, it is a frequency divider so that 8000 Hz before lowering will become 1600 Hz after lowering when α = 1/5. When the input and output frequencies are plotted on a linear or log scale, the relationship is a straight line with a slope equal to α.
16. Ouch! You’re making my brain hurt. Didn’t we have a “no math” rule?
Hey, you asked the question! It’s going to help me to make an important connection, and there’s not much left, so hang in there. A generic equation for nonlinear compression would look like this: fout = (fin)α, where α is related to the “compression ratio” or “CR.” When the input and output frequencies are plotted on a linear scale (Hz), the relationship is a curved line, but when it is plotted on a log scale, it is straight because the same equation can also be written: log(fout) = α*log(fin). The way it is implemented in the hearing aids that use this method is a bit more complicated than this, but a neat feature about being logarithmic is that the representation of frequency along the cochlea is also logarithmic. What this means for nerds like me is that we can start to think about the signal in terms of auditory filters. For example, I can confirm that the compression ratio as used by Phonak corresponds very closely to the reduction in spectral resolution in terms of auditory filters, so a compression ratio of 2:1 means that an input signal that normally spans 2 auditory filters will span only 1 auditory filter in the output. Figure 5, below, was generated by modeling a bank of auditory filters (shown in blue) using the equation for normal-hearing equivalent rectangular bandwidth, ERBN, (Glasberg and Moore, 1990) and then shifting the frequencies (shown in red) using the actual equation for nonlinear frequency compression (Simpson et al., 2005).
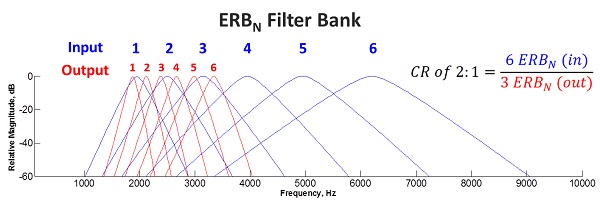
Figure 5. Modeling a bank of auditory filters (shown in blue) using the equation for normal-hearing equivalent rectangular bandwidth, ERBN, (Glasberg and Moore, 1990) and then shifting the frequencies (shown in red) using the actual equation for nonlinear frequency compression (Simpson et al., 2005).
17. Is the second way of defining nonlinear frequency compression as technical as the first?
No, it’s quite simple, really. The other way I think that the linear-nonlinear distinction is being made is in terms of where the start frequency occurs. If you look at Figure 4, you will see that linear frequency compression starts at the lowest frequency (1 Hz), whereas a hallmark feature of nonlinear frequency compression is that frequency lowering starts at a higher frequency so that you have a spectral region where no lowering occurs and a region where frequencies are being shifted. Regardless of how you plot this, you will get a two-piece function that is anything but straight.
One last thing before we move away from this topic is to mention exactly when frequency lowering occurs. Notice that not all of the time segments associated the linear frequency compression method show lowering. This is because speech would sound awful and would be mostly unintelligible if we compressed the low frequencies all the time – recall our earlier conversation about the importance of formant frequencies. To make this a viable method, lowering is designed to occur only when there is significant high-frequency energy above 2500 Hz. Therefore, with this method, lowering is either all (over the entire frequency range) or none. This contrasts with current implementations of nonlinear frequency compression that engage frequency lowering all the time.
18. Linear frequency transposition and spectral envelope warping look much different from the others, can you briefly explain how they work?
Sure. Linear frequency transposition is the method implemented in Widex hearing aids. With this method, the algorithm continually searches for the most intense peak in the source region and then copies it down by a linear factor of 1/2 (one octave). To avoid having to compress the lowered information, only a portion of the signal is selected. Specifically, the peak is band-pass filtered so that it only spans one octave after lowering. The source region actually starts a half octave below the nominal start frequency and extends for one octave above this. So, in some sense the term “start frequency” is a misnomer unless you know that the start frequency is the end frequency of the target region. Confusing – I know; simply understand that all lowering occurs below the start frequency. This is in contrast with nonlinear frequency compression in which all lowering occurs above the start frequency. There is also an expanded mode with Widex’s algorithm, in which there is a second source region that overlaps with the first and that starts a half octave above the nominal start frequency and extends for another octave above this. The target region for this information is computed using a linear factor of 1/3 (not 1/3 octave or 3 octaves, as has been reported elsewhere).
The method implemented in Starkey hearing aids is akin to transposition in that only a portion of the high-frequency spectrum is translated down. They use the term “spectral envelope warping,” but we can think of it as “spectral feature translation” based on the way it is described (Galster et al., 2011). Acoustic analyses of the processed signals have not provided much detail about the specifics of the algorithm, but from what I understand, it continually searches the high-frequency spectrum for features that have a high likelihood of being speech (Galster et al., 2011). When it detects these features, they are lowered or translated down by modifying the spectral envelope of the source spectrum in order to preserve the natural harmonic structure of the speech signal.
19. Is one method better than the other?
I don’t know because other than the study that I conducted (refer back to my answer to Question 9), no one has compared different methods of frequency lowering on the same population. Recall that I was looking to determine if there was any value to using frequency lowering for adults with mild-to-moderate hearing loss. Because we presented recordings of the processed speech (with all advanced features deactivated, except frequency lowering) to listeners through headphones, we were able to match the output for audibility and the like. We tested nonlinear frequency compression and linear frequency transposition methods, which were both set so that lowering occurred only for frequencies above around 4000 Hz. As I mentioned earlier, we had positive outcomes for two of the conditions, both of which compressed frequencies up to around 9000 Hz. One method was the nonlinear frequency compression in the hearing aid and the other was my own method I created using MATLAB and then recorded through the hearing aid with the frequency lowering deactivated.
By process of elimination, you can probably guess that the method that did not work out very well was linear frequency transposition. Based on what we have just discussed today, you can also probably guess why. With nonlinear frequency compression, the signal below 4000 Hz was left unaltered so that functionally, the only thing the signal processing did was to reduce the bandwidth of frication so that most of it was in the audible range of the listeners. In contrast, the linear frequency transposition method took the information above 4000 Hz and put it one octave down which created a frication spectrum with a radically different shape. I wouldn't recommend using this particular frequency lowering feature for mild-to-moderate losses and the folks at Widex will probably tell you the same thing (Kuk et al., 2009b). They will also iterate the importance of giving the patient time to become acclimated with the processing since we now have studies using both methods of frequency lowering that suggest that full benefit may take at least 6 weeks to 6 months to become evident (Kuk et al., 2009a; Auriemmo et al., 2009; Wolfe et al., 2010, 2011).
However, the results I just presented might change as the severity of loss increases. Because the losses were mild-to-moderate, we had a lot of ‘real estate’ to work with which allowed us to keep the lowered information out of the range of the primary formants when using nonlinear frequency compression. As the upper frequency limit of audibility drops, we must involve the low frequencies to a progressively greater extent and the perceptual ‘costs’ associated with both methods will increase. The big unknown is at what point do the costs outweigh the benefits for each method.
20. This is a lot of information to digest! But, I need to have one last piece of critical information. Let’s assume it is Monday morning and I plan on fitting my favorite frequency lowering hearing aid. How do I know what setting to choose and is there anything I should watch for?
I certainly understand your confusion because the manufacturers provide you with a lot of settings for frequency lowering. If you avoid two extremes, you can easily eliminate most of the settings for the particular hearing loss you are trying to fit. As I already mentioned, the first step is to deactivate frequency lowering and fit the hearing aid to targets as you normally would. Based on your savvy questions, I can tell that you are an astute clinician who routinely uses probe-microphone measures, so the next step is to look at the audible bandwidth you have to work with. On the SPL-o-gram (Speechmap), this will be the highest frequency at which the output exceeds threshold, also known as the “maximum audible output frequency.” The basic goal when you activate frequency lowering is to try to ‘fit’ the lowered speech within this bandwidth while not reducing it further. The one extreme to avoid is to have all of the frequency lowering occur at frequencies that are inaudible. For nonlinear frequency compression, this means that you can automatically exclude those settings for which the start frequency is above the maximum audible output frequency. It sounds simple, but I see this mistake a lot especially when clinicians choose the fitting software’s default setting. I think this occurs for one or two reasons. The first is that, unlike you, they are not using probe-mic measures, so they do not know where audibility drops off in the first place. The second reason is that they are confused about how the methods work. I can help you with the second with some useful tools. But, if you have the first problem, then my colleague Gus Mueller will have to set you straight.
The first extreme is not as serious as the second because in the worst-case scenario you are simply left with a conventional fitting. The second extreme can be much more serious and involves too much lowering, which then will unnecessarily restrict the bandwidth you had to start with. The danger of course is reduced speech intelligibility. Your experienced adult patients probably will be quick to let you know you have gone too far, but new users really have no base for comparison and might just think “that’s the way hearing aids sound.” And of course, you have to be particularly careful with your pediatric patients. To avoid this other extreme, you simply repeat your probe-mic measures with the frequency lowering activated and make sure that you have not significantly reduced the audible bandwidth. One potential problem with relying solely on this approach is that depending on the method, the speech output might pretty much look the same for a variety of settings, yet the content or potential information coming from the input before lowering can be very different. To help you visualize how frequencies are being altered with nonlinear frequency compression and with linear frequency transposition, I have developed a set of online tools to assist you at www.TinyURL.com/FLassist.
So, now you are left with a handful of potential settings – which do you choose? One reasonable approach is to ask the patient and/or to go with the setting that minimizes confusion of “s” for “sh” (Glista et al., 2009). If you use my online tools for nonlinear frequency compression, then it makes a recommendation for the remaining settings (there should only be two or three, at most) based on which one maximizes the bandwidth of the input signal after lowering. I don’t try to split hairs, so if two settings are reasonably close in this regard, then it recommends the one with the highest start frequency, with the intent of preserving the low frequencies as much as possible (Alexander, 2012). Using the tool for linear frequency transposition, I recommend choosing the setting that has the least overlap between the un-transposed and transposed signals while making sure that there are no “gaps” at intermediate frequencies (that is, frequencies that are inaudible when untransposed and that are too low to be picked up by the transposition- see Alexander, 2013 for more details).
As always, it wouldn’t be a bad idea to pick up your favorite validation tool to assess whether you are achieving effective outcomes with the choices you have made for your patient.
References
Alexander J.M. (2012). Nonlinear frequency compression: Balancing start frequency and compression ratio. 39th Annual meeting of the American Auditory Society, Scottsdale, AZ.
Alexander J.M. (2013). Individual variability in recognition of frequency-lowered speech. Seminars in Hearing, 34, 86-109.
Alexander J.M., Lewis D.E., Kopun, J.G., McCreery, R.W., & Stelmachowicz, P.G. (2008). Effects of frequency lowering in wearable devices on fricative and affricate perception. 2008 International Hearing Aid Conference, Lake Tahoe, CA.
Auriemmo J., Kuk F., Lau C., et al. (2009). Effect of linear frequency transposition on speech recognition and production of school-age children. Journal of the American Academy of Audiology, 20, 289-305.
Baer T., Moore B.C.J., & Kluk K. (2002). Effects of low pass filtering on the intelligibility of speech in noise for people with and without dead regions at high frequencies. Journal of the Acoustical Society of America, 112, 1133-1144.
Ching T.Y., Dillon H., & Byrne D. (1998). Speech recognition of hearing-impaired listeners: Predictions from audibility and the limited role of high-frequency amplification. Journal of the Acoustical Society of America, 103, 1128-1140.
Cox R.M., Alexander G.C., Johnson J., et al. (2011). Cochlear dead regions in typical hearing aid candidates: prevalence and implications for use of high-frequency speech cues. Ear and Hearing, 32, 339-348.
Cox R.M., Johnson J.A., & Alexander G.C. (2012). Implications of High-Frequency Cochlear Dead Regions for Fitting Hearing Aids to Adults With Mild to Moderately Severe Hearing Loss. Ear and Hearing, 33, 573-587.
Dillon H. (2012). Hearing Aids, 2ed., Thieme (New York).
Fallon M., Trehub S.E., & Schneider B.A. (2002). Children's use of semantic cues in degraded listening environments. Journal of the Acoustical Society of America, 111, 2242-2249
Galster J.A., Valentine S., Dundas J.A., & Fitz K. (2011). Spectral IQ: Audibility improving access to high-frequency sounds. Starkey (Eden Prairie, MN): https://www.spectraliq.com/pdfs/spectral-iq-wht-paper.pdf.
Glasberg B.R., & Moore B.C.J. (1990). Derivation of auditory filter shapes from notched-noise data. Hearing Research, 47, 103-138.
Glista D., Scollie S., Bagatto M., Richard S., Vijay P., & Andrew J. (2009). Evaluation of nonlinear frequency compression: Clinical outcomes. International Journal of Audiology, 48, 632-644.
Hall J.W., Grose J.H., Buss E. et al. (2002). Spondee recognition in a two-talker masker and a speech-shaped noise masker in adults and children. Ear and Hearing, 23, 159-165.
Hogan C.A., & Turner C.W. (1998). High-frequency audibility: Benefits for hearing-impaired listeners. Journal of the Acoustical Society of America, 104, 432-441.
Kopun J., McCreery R., Hoover B., Spalding J., Brennan M., & Stelmachowicz P. (2012). Effects of Exposure on Speech Recognition with Nonlinear Frequency Compression. 39th Annual meeting of the American Auditory Society, Scottsdale, AZ.
Kortekaas R.W.L., & Stelmachowicz P.G. (2000). Bandwidth effects on children’s perception of the inflectional morpheme /s/: Acoustical measurements, auditory detection, and clarity rating. Journal of Speech, Language, and Hearing Research, 43, 645-660.
Kuk F., Keenan D., Korhonen P., & Lau C. (2009). Efficacy of linear frequency transposition on consonant identification in quiet and in noise. Journal of the American Academy of Audiology, 20, 465-479.
Kuk F., Keenan D., Auriemmo J., & Korhonen P. (2009). Re-evaluating the efficacy of frequency transposition. ASHA Leader, 14(1), 14-17.
Mackersie C.L., Crocker T.L., & Davis R.A. (2004). Limiting highfrequency hearing aid gain in listeners with and without suspected cochlear dead regions. Journal of the American Academy of Audiology, 15, 498-507.
McCreery R.W., Brennan M.A., Hoover B., Kopun J., & Stelmachowicz P.G. (2012). Maximizing Audibility and Speech Recognition with Nonlinear Frequency Compression by Estimating Audible Bandwidth. Ear and Hearing, 20, 1-4.
Moeller M.P., Hoover B.M., Putman C.A., Arbataitis K., Bohnenkamp G., Peterson B., et al. (2007). Vocalizations of infants with hearing loss compared to infants with normal hearing. Part I: Phonetic development. Ear and Hearing, 28, 605-627.
Moore B.C.J. (2004). Dead regions in the cochlea: Conceptual foundations, diagnosis, and clinical applications. Ear and Hearing, 25, 98-116.
Nittrouer S., & Boothroyd A. (1990). Context effects in phoneme and word recognition by young children and older adults. Journal of the Acoustical Society of America, 87, 2705-2715.
Pittman A.L., & Stelmachowicz P.G. (2000). Perception of voiceless fricatives by normal-hearing and hearing-impaired children and adults. Journal of Speech, Language, and Hearing Research, 43, 1389-1401.
Simpson A. (2009). Frequency-lowering devices for managing high-frequency hearing loss: A review. Trends in Amplification, 13, 87-106.
Simpson A., Hersbach A.A., & McDermott H.J. (2005). Improvements in speech perception with an experimental nonlinear frequency compression hearing device. International Journal of Audiology, 44, 281-92.
Stelmachowicz P.G., Lewis D.E., Choi S., et al. (2007). Effect of stimulus bandwidth on auditory skills in normal-hearing and hearing-impaired children. Ear and Hearing, 28, 483-494.
Stelmachowicz P., Pittman A, Hoover B, & Lewis D. (2001). The effect of stimulus bandwidth on the perception of /s/ in normal and hearing-impaired children and adults. Journal of the Acoustical Society of America, 110, 2183-2190.
Summers V. (2004). Do tests for cochlear dead regions provide important information for fitting hearing aids? Journal of the Acoustical Society of America, 115, 1420-1423.
Turner C.W., & Cummings K.J. (1999). Speech audibility for listeners with high-frequency hearing loss. American Journal of Audiology, 8, 47-56.
Turner C.W., & Henry B.A. (2002). Benefits of amplification for speech recognition in background noise. Journal of the Acoustical Society of America, 112, 675-1680.
Vickers D.A., Moore B.C.J., & Baer T. (2001). Effects of low-pass filtering on the intelligibility of speech in quiet for people with and without dead regions at high frequencies. Journal of the Acoustical Society of America, 110, 1164-1175.
Wolfe J., Andrew J., Schafer E.C., Boretzki M., & Caraway T. (2011). Long-term effects of non-linear frequency compression for children with moderate hearing loss. International Journal of Audiology, 50, 396-404
Wolfe J., Andrew J., Schafer E.C., Nyffeler M., Boretzki M., & Caraway T. (2010). Evaluation of Nonlinear Frequency Compression for School-Age Children with Moderate to Moderately Severe Hearing Loss. Journal of the American Academy of Audiology, 21, 618-628.
Cite this content as:
Alexander, J.M. (2013, April). 20Q: The Highs and lows of frequency lowering amplification. AudiologyOnline, Article #11772. Retrieved from: https://www.audiologyonline.com/