
 From the Desk of Gus Mueller
First, I want to thank my colleague Ben Hornsby for helping out with this month’s 20Q. To be clear, we are very aware that monosyllabic word recognition testing in quiet is one of the least effective tests in our audiologic battery. Rarely do the results influence our decision making regarding differential diagnosis, treatment plans, amplification, or the need for referral. In fact, many wise people have suggested that we replace this antiquated testing from the 1940s with speech-in-noise measures, which usually will provide us with more meaningful information.
But let’s face it—clinical audiologists have a love affair with speech-in-quiet recognition testing, and things simply aren’t going to change in the near future. It’s very likely that our patients will be giving themselves speech-in-noise tests at a kiosk at Costco before this testing is conducted routinely by audiologists. So if the monosyllables-in-quiet test is going to stick around for a while, maybe it’s time that we all agree to conduct the testing and interpret the findings using the supporting research that has accumulated over the years (with a splash of common sense thrown in). That’s what this month’s 20Q is all about.
My co-author, Benjamin Hornsby, PhD, is Associate Professor of Audiology in the Department of Hearing and Speech Sciences at Vanderbilt University School of Medicine, Nashville, TN. For the past 25 years, he has been one of the leading researchers examining the factors responsible for the speech understanding difficulties of adults with hearing loss and the related benefits and limitations of amplification. In recent years, his research has focused on examining the relationships between speech processing deficits, cognitive processing demands and listening-related fatigue in adults and children with hearing loss.
Dr. Hornsby’s research status has earned him appointments as the Senior Editor of Trends in Amplification, and for six years, he was the section editor for amplification for Ear and Hearing. For his career achievements, he recently was named Fellow of the ASHA.
In addition to his many research projects and the mentoring of PhD students, Ben also teaches several classes in the Vanderbilt AuD program—one of them is speech audiometry. He and I discuss, often over a beverage or two, why is it that students are provided all the evidence regarding how to do speech recognition testing correctly, and then, five or ten years later, they are in a clinic doing live-voice ½-lists? We don’t know the answer, but writing this 20Q at least makes us feel like we’re doing our small part to try to make the world a better place.
Gus Mueller, PhD
Contributing Editor
Browse the complete collection of 20Q with Gus Mueller CEU articles at www.audiologyonline.com/20Q
20Q: Word Recognition Testing - Let's Just Agree to do it Right!
Learning Outcomes
After reading this article, audiologists will be able to:
- Explain the role of word recognition testing in clinical audiology.
- List common pitfalls in the way word recognition testing is often conducted and their potential clinical impact (i.e., why those should be avoided).
- Describe best practices in word recognition testing.
 Dr. Hornsby
1. Didn’t the two of you talk about this topic here at AudiologyOnline before?
We did, but not at the 20Q column. It started with a Webinar in 2012, which was then transcribed and bulked up for an article we published a year later (Hornsby & Mueller, 2013).
2. Why are you back at it again?
There are a couple of reasons. First, we continue to observe what is happening in clinical practice and see that the same problems that existed seven years ago are still with us today. Informal surveys also show that not much has changed regarding the use of haphazard word recognition procedures. As you’ve probably noticed, it is becoming more and more popular for audiologists to post their audiograms on social media sites, which of course is exposing their questionable everyday speech test procedures to thousands around the world. It makes us wonder if these people who are making the mistakes don’t even realize that they are making a mistake?
3. You said there were a couple reasons?
The second one is a practical issue, but relates to what we just stated about information transfer. We continue to hear that more and more audiologists are focusing on best practices. Our 2013 article is now seven years old, and so the time seems right to bring back the topic, including a few new issues. Depending on what questions you ask us, however, we may steal generously from our previous work.
4. You say “do it right.” But is it really right vs. wrong? Just because it isn’t your preferred way, maybe it’s still right?
Fair question. Let’s take a typical downward-sloping hearing loss, with thresholds of 10 dB at 250 and 500 Hz, 15 dB at 1000 Hz, then dropping to 55 dB at 2000 Hz, 65 at 3000 Hz and 70 dB at 4000 and 6000 Hz. This is something you see fairly often in a busy clinic. We’ll say the SRT is 15 dB (average of 500 and 1000 Hz thresholds). One could argue as to whether the best presentation level would be 75 or 80 dB HL, or maybe even 85 dB HL. But, to use the outdated method of SRT + 40 dB, which would give you a presentation level of 55 dB HL, is simply wrong! And unfortunately, the old “SRT + 40” approach is still used by many audiologists - maybe as many as 30-40% of them.
While the concept that patients will do better when something is audible compared to when it is not, is not rocket science, we’ll use some real-ear measures to hopefully make this point even more obvious. Using probe-mic equipment and a willing subject, we did the following:
- Situated our probe-mic equipment next to our clinical audiometer.
- Entered the audiogram mentioned earlier into the probe-mic software (which is then displayed in ear canal SPL).
- Measured the subject’s RECDs, and entered these into the software so that corrections from HL to ear canal SPL would be as accurate as possible.
- Set probe-mic system to make ear canal SPL measures from an external input signal.
- With the probe tube in place, used insert earphones and delivered the NU#6 word list 1A from the audiometer to the real ear at different HL values.
- Recorded (15 second duration) the output of the real-ear speech signal for each level (55, 65, 75 and 85 dB HL).
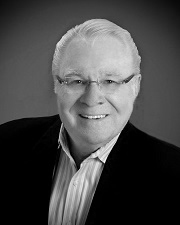
Our results are shown in Figure 1. The problem of using an inappropriately soft input for monosyllable testing is clear. We know that 2000 Hz is an important frequency for understanding the words of the NU #6 list. Note that for the 55 dB HL presentation level (upper left panel), not even the peaks of the speech signal were audible at 2000 Hz and above. At a reasonable presentation level of 75 dB HL (lower left panel), observe that the majority of the speech signal is audible at 2000 Hz, and a considerable portion is also audible from 2000 to 3000 Hz. As expected, the best audibility is obtained for the 85 dB HL presentation level (lower right panel), although this may exceed the LDL of some patients.
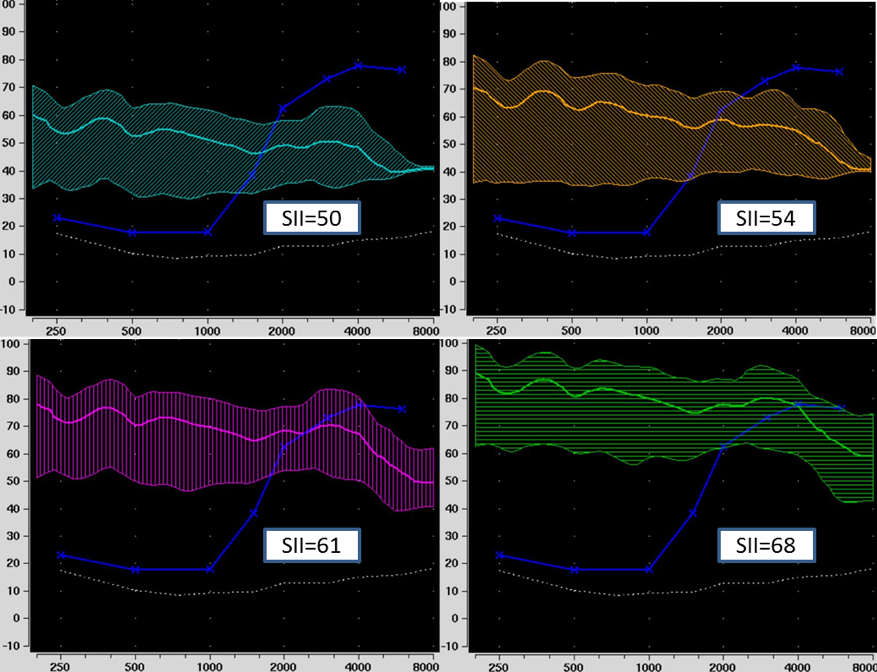
Figure 1. Real-ear output for monosyllabic words presented via insert earphone at inputs of 55 (upper left), 65 (upper right), 75 (lower left) and 85 (lower right) dB HL. The upward-sloping blue plotting is the patient’s thresholds; ear canal thresholds shown were corrected for the patient’s RECD. Measurements courtesy of Lindsey Jorgensen, PhD, University of South Dakota.
5. The display illustrates the problem nicely. We need to talk more about this later. Stepping back and looking at the big picture, what do you two think is the role of traditional word recognition testing in clinical audiology?
We’ll assume you mean monosyllabic word recognition testing in quiet. The easiest answer is to tell you what it doesn’t do:
- It isn’t very good at differentiating people with normal hearing vs. hearing loss.
- It isn’t very good at detecting pathologies.
- It doesn’t predict how people perform in the real world.
- It doesn’t predict how people understand speech in background noise.
- Unless the scores are very poor, it doesn’t predict who will benefit from amplification.
6. So maybe our conversation is over. If there is no reason to do the test in the first place, does it really matter if we do it right or not?
Yes. As a savvy audiologist you might recognize that the scores you record have little meaning, but once they are placed in medical records, as they often are, other professionals look at them as a relevant finding regarding a patient’s status. You better believe that many patients have received an unnecessary MRI simply because of an unusually low speech recognition score that was due to improper testing, not an ear pathology (see the case study in our 2013 paper). If you’re entering something in the patient’s medical records for all to see—it better be right.
7. What about substituting speech-in-noise testing?
It was in 1980 that Jim Jerger commented on the practice of conducting monosyllabic word recognition testing in quiet: “We are, at the moment, becalmed in a windless sea of monosyllables. We can sail further only on the fresh winds of imagination.”
Well, I think you know where the winds of imagination have taken us over the past 40 years. Except for a handful of audiologists who routinely do the QuickSIN, or maybe the Words-in–Noise (WIN) test, nothing really has changed. It’s certainly not the fault of people like Richard Wilson, who for most of his career documented through careful research the benefits of routine speech-in-noise testing.
And so yes, replacing traditional word recognition testing with a speech-in-noise test certainly would give us more useful information. Let’s face it, however, audiologists are in love with their speech-in-quiet testing, and are not going to easily give it up. We predict that patients will be giving themselves speech-in-noise tests via the Internet or in a kiosk at Wal-Mart before audiologists will embrace this testing. Getting back to the title of our article, if as a profession, we are going to insist on continuing to do this test, let’s at least agree to do it right.
8. Where do we start?
We start with the most fundamental question, “Why are we doing this testing?” The answer is pretty simple. Our goal is to determine the patient’s optimum word recognition performance under controlled and standardized conditions. In other words, how good does it get? What is the best we can expect? To obtain this information we need to use tools and procedures that will provide us with valid, reliable and clinically meaningful results. We need to avoid obsolete procedures or bad habits that will prevent this from happening.
Consider that if we don’t have the optimal score, then we can’t:
- Use the scores for diagnostic purpose
- Use the scores to determine if one ear is different than the other.
- Use the scores to determine if speech recognition has changed over time.
- Use the scores to help make decisions regarding amplification
- Use the scores to determine fitness or compensation
9. You mention obsolete procedures and bad habits?
We mentioned one already, selecting a presentation level that is a fixed SL above the SRT. The value used by most audiologists is 40 dB. The SRT+40 dB approach originates from early research in the 1940s, much of it with people with normal hearing. It was found that these individuals reached PB-Max at 40 dB SL. That is, an increase in presentation level above this point did not result in an increase in speech recognition. But we will say again, these were people with normal hearing! For someone with relatively good low-frequency hearing and a downward sloping high-frequency loss, this approach often will not result in a level that is intense enough for the patient to hear important high-frequency speech sounds and reach the maximum score we are seeking with the test. You saw this very graphically in Figure 1. You have to ask, why would anyone do a test that is designed to obtain the patient’s recognition of words, and then purposely not make the words audible to the patient? That’s like an optometrist moving the Snellen chart another 20 feet away just to mess with you! Except guess what? They don’t do that.
10. I understand that SRT+40 dB is a poor approach, but how do I know what level is the best for a given patient?
You don’t, but you can pick a level that will be best most of the time. If clinical test time was not an issue, ideally we would go to the level that we would predict to be best. Then, if scores were not reasonably good (~90% or better), conduct testing at levels slightly higher and slightly lower (a shortened PI/PB function). But, we all know this isn’t going to happen in a busy clinic, so we normally pick one level, and assume that we then are going to obtain something very close to the optimum score most of the time.
11. All good, but you didn’t answer my question. How do I know what level to select?
You start with evidence-based research. Some of us older folk, who were working in a clinic in the early 1980s, recall vividly when the article by Candace Kamm and colleagues examining PI/PB functions was published in JSHR (Kamm, Morgan, & Dirks, 1983). This research group found that for 75-80% or so of their subjects, PB-Max occurred at 95 dB SPL (~75 dB HL), and this was superior to using the +40 dB approach. We changed our clinic protocol the next week. This was 1983, nearly 40 years ago, so obviously what we are saying here is not breaking news!
Of course, there has been considerable research over the years regarding what is the “best” presentation level. One data-set that we like is from Guthrie and Mackersie (2009). They asked if there was one method for selecting a speech level that gives the best shot of achieving the PB-Max score. Ideally, we want an approach that does not create a level that exceeds the LDL, and works well for hearing losses of various degrees.
These researchers measured each individual’s PI/PB functions at multiple levels, using 5 dB steps ranging from the SRT+10 dB up to 5 dB below the patient’s LDL. By using this approach, they pretty much ensured that they were going to find the maximum performance level. Once they had these data, they then looked at five different points on the function for each person: 75 dB HL, MCL, LDL minus 5 dB, SRT+SL, and the 2000 Hz threshold + SL (SL values changed based on degree of hearing loss). Their general finding was that, on average, you will have the best chance of getting the highest score if you used the LDL minus 5 dB method. This method ensures you are providing as much audibility as possible without testing at an uncomfortably loud level. While the LDL minus 5 dB method was the most effective, the 2000 Hz SL method gave comparable scores in most cases. We prefer the 2000 Hz SL approach, and in case you want to implement this tomorrow morning, here are the SL values to use:
The SL values shown below are added to the 2000 Hz threshold to obtain the presentation level:
- 2000 Hz Threshold <50 dB HL: 25 dB SL
- 2000 Hz Threshold 50–55 dB HL: 20 dB SL
- 2000 Hz Threshold 60–65 dB HL: 15 dB SL
- 2000 Hz Threshold 70–75 dB HL: 10 dB SL
12. Why do you prefer this method to the LDL minus 5 dB approach?
There are a couple of reasons. First, while frequency-specific LDLs are essential for programing the MPO of hearing aids, we can’t think of a good reason to routinely conduct speech LDLs. Obtaining the patient’s speech LDL, simply for the purpose of conducting speech recognition, therefore, is going to add some time to the diagnostic testing. In addition to the time factor to conduct this additional test, LDLs often are conducted in a rather haphazard manner. It’s probably not wise to rely on an unreliable measure to select something as important as the presentation level for word recognition testing; the 2000 Hz threshold is going to be more reliable.
13. Is the 2000 Hz SL approach going to give me PB-Max, or something close, most of the time?
Most of the time, yes. All of the time, no. You still have to think. Consider the patient with a nasty loss that is relatively normal hearing in the lows, and then dropping to 95 dB HL at 2000 Hz. Are you going to do your testing at 105 dB HL (2K threshold + 10 dB)? No. How about the patient with the upward sloping loss going from 50-60 dB in the lows up to 20 dB at 2000 Hz? Are you going to do your testing at 45 dB HL (2K threshold + 25 dB)? We don’t think so. But these are unusual cases. Most of the time, for the typical patient, you’ll be close to PB-Max with this approach, but we encourage the use of a healthy dose of common sense as well.
14. One final thing on presentation level. I know of a practice that has a protocol stating that speech recognition must be conducted at the patient’s MCL. What do you think of that approach?
Not much. We’d like to see their supporting research evidence. First, as we’ve already discussed, we are interested in the patient’s optimum performance, not how they perform at their MCL. Secondly, and related to our first point, in typical downward sloping losses, the MCL will be below the intensity level that provides PB-Max. We also could mention that the MCL is a range, not a fixed point, so the patient easily could be tested at different levels at different clinic visits, making it very difficult to compare performance over time.
Gus and Ben's Tip #1: Always use a presentation level that ensures as much audibility as possible without being uncomfortably loud.
15. All this talk about presentation levels, but we haven’t mentioned the actual test material?
That’s an easy one. Most of the meaningful research has been conducted with the Auditec recordings of the NU-6, so we see no reason to stray from this material. The test that you want (available from Auditec of St. Louis) is the NU-6 Ordered by Difficulty (Version II), Short Interval. Short Interval refers to a ~2.5 sec. inter-stimulus interval, rather than the usual ~4 seconds, which will speed up your test time. If you’re using computer-assisted speech testing, the interval time probably doesn’t matter, as you’ll control that with your mouse, which will be even faster than the 2.5 seconds for most patients. To state the obvious, the test is a 50-word list, so unless you are conducting a 10-word or 25-word screening, you would always use a complete 50-word list.
16. Whoa - I think it’s pretty common for clinicians to only use a ½ list?
As Leo Tolstoy said in 1880: “Wrong does not cease to be wrong because the majority share in it.” Using only ½ of a standard NU-6 word list is very risky. Again, this is not breaking news. We can go back to research with the NU-6 word lists conducted by Bill Rintelmann and colleagues from 1974. One of the things they examined was the use of 50-word lists versus half-word lists, and they compared the scores from the first ½ (25 words) to scores using the second ½ (25 words) of the list. They found that for an older hearing-impaired group, the average difference between the first ½ and the second ½ was 16%! And that’s the average; so many differences were greater than that. The test is designed for 50 items and normed for 50 items. If you do anything other than that, you can be fairly certain that the lists that you are using are not equivalent, and the reliability is highly questionable.
17. Why are there such big differences between the first half and the second half?
As we said, the test was always meant to be a measure using 50 words. There was no attempt to balance the first 25 vs the second 25 phonetically, or more importantly, by level of difficulty. As you’re maybe aware, the work of Hurley and Sells (2003) revealed that there is a considerable range in the difficulty of the words. For example, in their research, they found that some of the words in a given NU-6 word list were missed over 50% of the time by their patients, whereas other words from the same list were missed less than 10% of the time. We’ll say it again: the lists are not balanced for difficulty.
18. I see the potential problem, but is this really going to affect clinical decision making?
Absolutely, and we’d call it a real problem, not potential. Here is a very possible clinical case for you to consider: a patient with a mild-to-moderate symmetrical downward sloping hearing loss, with somewhat reduced cochlear function for speech understanding. When you used the most appropriate presentation level, his true PB-Max (50 words) for both ears is around 80%, which is a pretty common finding. For this discussion, let’s say that his performance for the right ear was such that he missed the 10 hardest words. In Figure 2, we have the standard ordering for the NU-6, which is what many audiologists use. For List 1, we have checked the 10 most difficult words (from Hurley & Sells, 2003), which are the ones in this example that the patient would have missed.
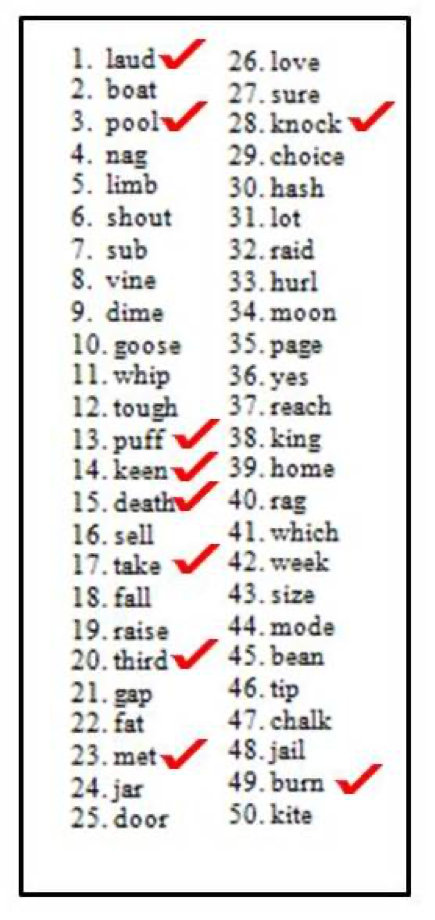
Figure 2. Standard ordering of the Auditec NU-6 List 1. The ten most difficult words have been checked. Observe that eight of the most difficult ten words are contained in the first ½ of the word list.
Let’s assume that the audiologist doing the testing follows the rules and conducts a full 50-word list. The score would be 80% (10 wrong x 2%), and she would then go on and do another 50 words for the left. But what if she would be so bold as to only do half of a list? What would happen then? Well, we can do the math. As you can see from the words checked in Figure 2, if the right ear were tested first, the patient would have scored 68% for this ear (first ½; 8 missed words x 4%) and 92% for his left ear (second ½; 2 missed words x 4%). This is a 24% asymmetry. An asymmetry in speech recognition of 24% catches the eye of many otolaryngologists, and just might generate an MRI. If so, unnecessary testing is conducted, high medical bills are rung up, the patient goes home thinking he has a tumor, all because an audiologist wanted to save a couple of minutes of test time.
19. But for those of us in the trenches, saving time is important.
More important than following best practices? And how much time are you really saving? We know the answer, based on the work of Mendel and Owen (2011), who reported on the test time for conducting the 50-word NU-6. They found that for older hearing-impaired individuals, test time was 3.0 minutes per ear, or 6 minutes for bilateral testing. So if you do ½ lists, you’d be saving 3 minutes per patient. If you are not allowed an extra 3 minutes per patient to obtain valid and reliable results, it might be time to start looking for a new job.
Gus and Ben’s Tip #2: Always use a complete 50-word list (unless the patient passes an “ordered by difficulty” screening).
20. Speaking of saving time, tell me more about that word recognition “screening” procedure?
Yes, this relates to the Hurley and Sells (2003) ordered by difficulty research. So, just when we said you can’t use a ½ list, we’re now going to say that it might be okay to use a 10-word list, under the right circumstances. The ambitious research goal of Hurley and Sells was to determine if you could develop a screening protocol that would allow you to quickly identify whether or not you have a patient in your test booth that has very good word recognition (94% or better). The short answer to their question is yes, we can do this. We can separate good word recognition ability from the others (worse than 94%) by using the most difficult words of the list (Figure 3).
The assumption is that if a patient is doing poorly, for example only 70% correct, we want to be confident that their true score really is 70%. Therefore, we want to use a full word list. On the other hand, if a score is near 100%, whether the “true score” is 96%, 98% or 100%, it doesn’t matter, as it’s not going to alter the counseling or treatment plan.
To develop this protocol, Hurley and Sells (2003) measured word recognition using the Auditec recordings of the 50-word lists. They recorded not only the patient’s word recognition score, but also which words they missed. They did this so they could develop a percentage of misses for each word, or what the word error rate was. Then they sorted the words based on their difficulty to create the ordered-by-difficulty lists. With those ordered-by-difficulty lists, they then re-scored performance for each patient. They evaluated if they could predict who was going to score 94% or better on a 50-word list by performance on the ten most difficult words, or the 25 most difficult words.
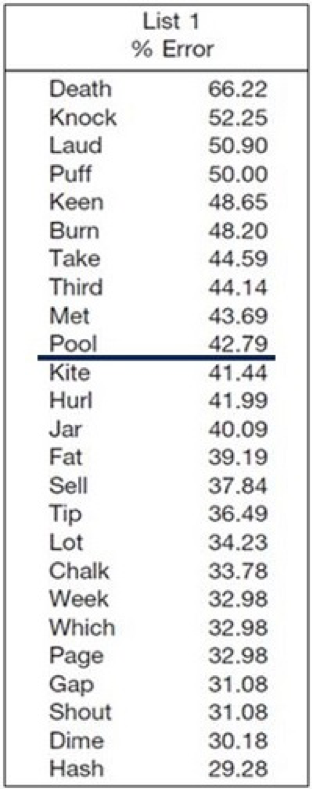
Figure 3. Top 25 most difficult words from NU-6 List 1, in order of error rate. All four of the NU-6 lists have been ordered by difficulty, and this recording is commercially available.
The authors went through this process with over 400 hearing-impaired patients. They found what they called a series-positive protocol to be very efficient and effective for identifying people whose performance would probably be worse than 94-96%. The screening rules that they found to be very effective were as follows:
- Present the 10 most difficult words first. If the patient misses none or only one word, you can stop testing for that ear. It’s very unlikely that that person is going to have a 50-word score that’s less than 96%.
- If the patient missed more than one word, then go ahead and present the next 15. In that case, out of those first 25 words, if they missed 3 or fewer, then you can stop testing.
- If the patient misses more than 3 words for the first 25, then you would present the full 50-word lists.
Out of those 400 subjects, this screening approach identified all of the people who scored poorer than 96%. That’s a 100% hit rate—it doesn’t get any more effective than that. So you can save time and conduct a valid and reliable test by using materials that are ordered by difficulty. How much time can it save you? Out of those 400 people that they tested, 25% of these patients would not have needed the full 50-word list.
21. This sounds like something I need to start using. Is there a downside to using this approach?
Not at all. The worst case is that you end up doing a full 50-word list, which is what you would have done anyway. It’s important to remember that you are not calculating a speech recognition score, you are predicting one. We have seen clinicians who do the first 25 hardest words, the patient misses only 3, they stop testing and record a score of 88% (100% minus 3 x 4%). This isn’t really correct. This would be like giving one student the 25 hardest questions on a 50-question exam, taking her percent-correct score for these 25 items, and then directly comparing it to the percent correct score of the other students who answered all 50 questions.
If the patient only misses 3 of the first 25, they’ll probably get all of the second 25 correct, as the words keep getting easier, which would then be a score of 94%. Now, you could argue that 88% and 94% aren’t really all that different, however, there are some charts showing that “normal” word recognition is 90% and above.
We really don’t know how clinical audiologists note on the audiogram that the patient passed the screening test. One possible method would be that you simply have a place on your audiogram where you would have something like this:
Word Recognition =/> 94% (p=.05)
You would then check that box when a person passes (as we said before, if we know that the true score is 94% or better, we don’t really care what the exact score is).
We need to point out that this screening approach only is valid when you use the Auditec recording that we mentioned earlier. We have no idea what the ten most difficult words would be for other recordings, and most certainly, not for (gasp) live voice presentation.
Gus and Ben’s Tip #3: Always use the Auditec NU-6 ordered by difficulty (Version II) recording, and conclude testing if the patient passes the screening guidelines.
22. I seem to recall being told that I needed to use a lot of words to have clinically significant differences. Now you’re saying that 10 words is okay?
You’re mixing two different things. The 10-word screening is used only to determine if speech recognition is very good, i.e., “normal”. If it’s normal, you’re not concerned about calculating critical differences. What you are thinking of is using a binomial model that provides us with critical differences between word recognition scores obtained using lists of words of a specific length (e.g., two 10-word lists, or two 25-word lists, or two 50-word lists). This model became known in the audiology world through the publication of Thornton and Raffin (1978), and it is as relevant today as it was 40 years ago when we all started using it.
23. I have to admit, I don’t use it. Could you give me a quick refresher?
Sure. We know that the number of test items that are used to measure word recognition can affect test-retest variability. Of course, what we really want to know is— What is the patient’s “true” speech understanding ability? In other words, if we tested a given patient 100 times, and we averaged all the scores for all the words (total words =5000), would the performance be 50%, 70%, 85%? When we do clinical word recognition testing, therefore, we are really not recording someone’s true recognition ability. We are obtaining an estimate of what that recognition ability is, and when we test them a second time, we’ll obtain another estimate. If we do it enough, and use enough words, we get a pretty good idea of what that recognition ability is, but there still is some variability. How much variability will depend on the number of test items used, the persons “true” word recognition ability and whether or not the lists that we are using are equivalent.
Thornton and Raffin (1978) showed that variability in test scores across multiple speech recognition tests can be described statistically. They illustrated that variability increases in a very systematic way, depending on the patient’s “true” speech recognition ability. For example, say you have normal hearing and really good speech understanding ability—your “true” score is 96%! Even if we test you 100 times, it’s going to be really unlikely that you are going to have a score of, say, 50% or less. Now you might get a score of 92% or 98%, but it won’t stray too far from 96%. However, if you have a significant hearing loss, and your true score is 50%, then the variability is going to be greater. For a score of 50% correct, binomial models predict a standard deviation of scores using a 50-item test would be about 7%. The variability (standard deviation) jumps to about 10% if you use a 25-item list. That’s a 40% increase in variability just by cutting that list in half. The point being is that variability depends in part on the total number of test items that you present.
Exactly. In fact, we have some numbers for you to consider. Several years ago Jerry Studebaker (1980) did some number crunching for us. We’re not sure of the true score that he used as a reference, but his data showed that if you would like a 6% difference to be significant at the .05 level of confidence, you’d need to use a 376-word list; for 10% to be significant, you only need to use 135 words. And, if you are the fastidious type, and would like a 2% difference to mean something, you’re looking at 3381 words.
25. I think I’ll just stick to the standard 50 words. I seem to recall that there is a chart I can use to determine when a difference is a difference?
Most certainly. We’ve adapted the chart form Thornton and Raffin (1988) and have it for you in Figure 4. We’ve already discussed why you wouldn’t ever use a 25-word list, but Thornton and Raffin did include critical differences for 25 words, so we put those on this chart—doing some comparisons will give you yet another reason not use ½ lists. To use the chart, you simply take the patient’s score (from either ear) and then go across to view the critical differences. The chart is based on a 95% level of confidence. There is a similar chart from Carney and Schlauch (2007), which works equally well. There are only minor differences between the two charts.
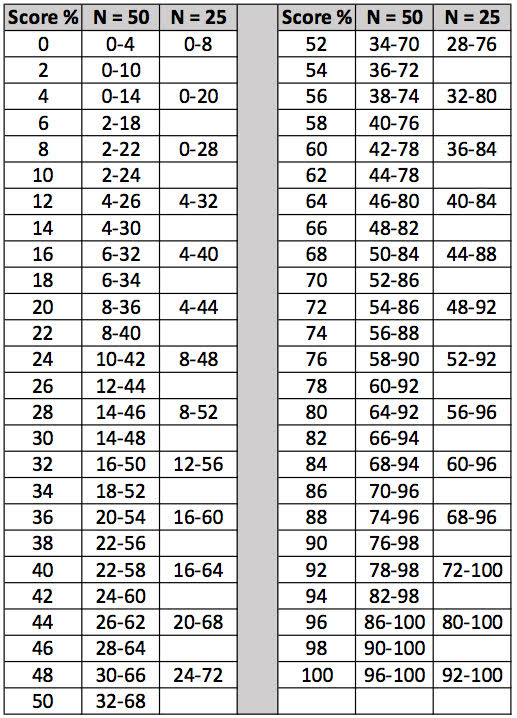
Figure 4. The critical differences (.05 level of confidence) adapted from Thornton and Raffin (1978) that can be used for comparison of two word recognition scores. Select one of the two scores and find this score on the vertical columns which go from 0 to 100%. To the right of each one of these values there is a range of scores for either a 25-word or 50-word list. If the second test score falls within this range, this score is not significantly different from the first score.
26. Can you give an example of how you would use the chart with a real patient?
Sure, we just happen to have some patient findings handy. This is a patient with rather poor speech recognition scores, so that will make it even more interesting (the audiogram is shown in Figure 5). The patient has a score of 68% for the right ear, and 44% correct for the left ear.
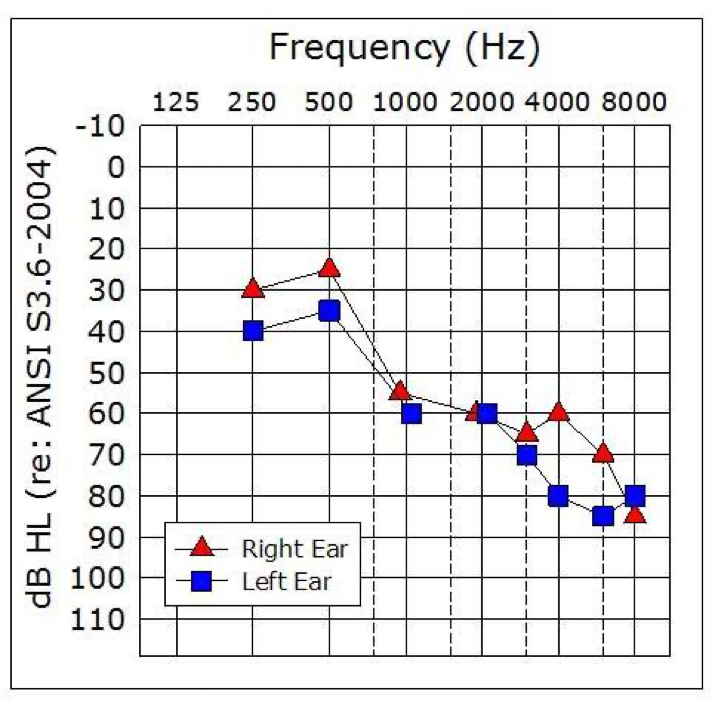
Figure 5. Sample patient audiogram. This patient had a word recognition score of 68% for the right ear, and 44% for the left ear.
Let’s look at the left ear score. Based on test-retest variability and the statistical models used to develop this chart, we can then ask, what’s the range of scores that we might reasonably expect if our true recognition ability is really 44%? In this case, if we had used a 25-word list, we would go to Figure 4 and look at the column corresponding to 25 words. Notice that the range of scores that we might expect would range anywhere from 20% correct to 68% correct. What that means is that if performance was poorer than 20% or greater than 68% correct, there would only be a 5% chance that that could be the same as our 44% score. Recall that the performance for the right ear was 68% correct. While it is tempting to assume that 44% is different from 68%, if we had used 25 items, we would say to our patient, or in a report to a referral source: “There is no difference in speech recognition ability between the right and left ears.”
As we increase the number of test items, variability is reduced. If we used a 50-item list, the critical difference range is smaller—it shrinks by 12% points as you can see in Figure 4. The critical difference range for a 50-word list for a score of 44% is from 26% to 62%. So now, by using 50 words, we are confident that our patient’s word recognition scores really are different—the score of the opposite ear, 68%, falls outside of the critical range. They are not similar just due to chance.
If you’re in a busy clinic, every day—unless you could somehow memorize all 50 critical differences. We’re not sure how an audiologist would do chart notes or counsel patients without it. A patient with a score of 72% in the right ear, and 60% in the left, asks you if his speech understanding is better in one ear (it isn’t)? You just did a post-op stapedectomy, and the patient’s word rec score dropped from 88% on the pre-op to 76% post op. Do you tell the physician or state in chart notes that word recognition dropped following surgery? No - because it didn’t.Three years ago a patient’s score in her right ear was 92%, today it’s 74% and she asks if it’s gotten worse? You say “Yes” - because it has. How would you make all these decisions without using the chart?
Gus and Ben’s Tip #4: Always use the Thornton and Raffin chart to determine when a difference really is a difference.
28. I get the point. Can you also use the Thornton and Raffin chart to determine when a score is lower than would be expected for a given hearing loss?
No. You would need some established norms for that. And you’re in luck, as these norms are available, using the very NU-6 50-word lists that we’ve been talking about. Speech recognition in quiet in general isn’t very useful for differential diagnosis, but if we measure a person’s optimum score in a valid and reliable way (as we’ve been discussing), we can obtain clinical insights. And you’re right, what we often want to know is if the word recognition score is what would be expected for a patient with a cochlear hearing loss of a given degree.
Let’s go back to our sample patient (Figure 5). We’ll assume that we did our testing carefully, and used presentation levels that provided PB-Max. Recall that we had a score of 68% for the right ear. Is that a reasonable score for PB-Max for someone with this loss? What about 44% for the left ear?
29. They seem suspiciously low to me, but you said that we actually have research data to help us make the decision?
We do, thanks to the work of Judy Dubno and colleagues, who developed what they called confidence limits for maximum scores (Dubno, Lee, Klein, Matthews & Lam, 1995). They looked to define or identify the lower limit of what’s normal for word recognition scores, given a certain degree of hearing loss. The idea is that if the score you obtained at the single level you tested is poorer than what they are predicting, then it’s likely abnormally low. You may want to test at another level, to see if indeed you were close to PB-Max.
To collect the data they needed, they measured word recognition (Auditec NU-6 recordings) at a couple of different presentation levels to define each patient’s PB-Max. This testing was conducted with 400 adults with confirmed cochlear hearing losses. They used the actual data and some simulations to come up with the lower limit. Of course, there was a wide range of performance, so they calculated a 95% confidence interval, meaning that only 5% of all the scores fall outside this confidence interval. Now, this could mean that you simply didn’t find PB-Max, but assuming you did, then this low score might indicate that the patient has a pathology that requires more investigation.
There is. You can use the table right out of their publication. We’ve included a modification of that chart in case you need a copy for your clinic (Figure 6).
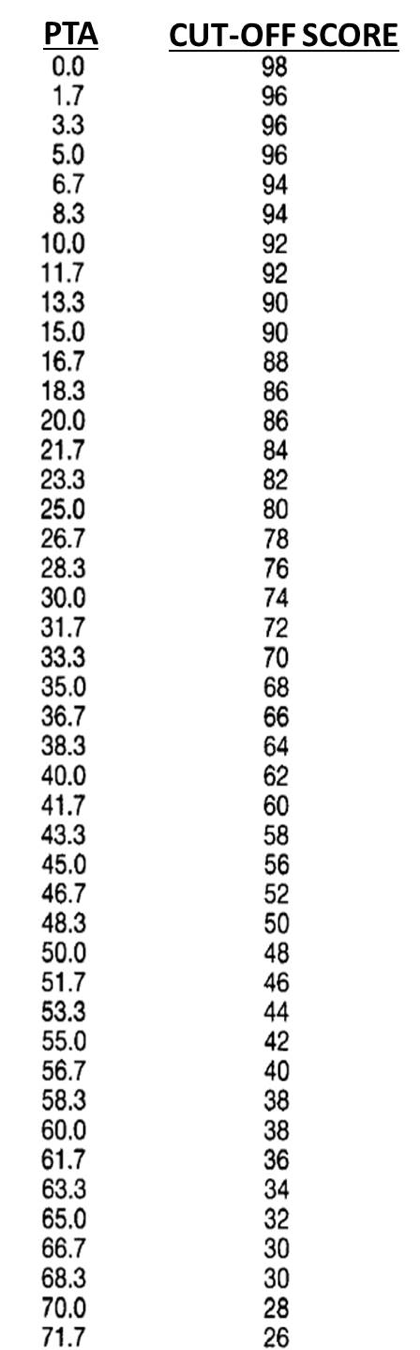
Figure 6. Chart of critical cut-off values (95th confidence levels) for speech recognition scores (percent correct; 50 words) based on pure-tone average (500, 1000 and 2000 Hz). To use this chart, calculate the pure-tone average, find this number on the left column, and then observe the speech recognition score in the right column. If the patient’s speech recognition score falls below this value, it would be considered an unusual finding. For example, if the pure-tone average was 50 dB, a score below 48% would be considered suspect.
If you want to consolidate your charts, Linda Thibodeau (2007) helped us out here big time. She constructed a very useful chart, which she terms the SPRINT (Figure 7). That’s for SPeech Recognition INTerpretation, and it includes not only the Dubno et al. (1995) data, but also the critical differences from Thornton and Raffin (1978) that we talked about earlier. The SPRINT chart in Figure 7 is for a 50-word list. The 95% confidence limits for our PB-Max based on Dubno’s (1995) work is the shaded region. That is, any time a score falls within that shaded region, it is considered disproportionality low. The left axis of this chart shows the pure-tone averages (500, 1000 and 2000 Hz) from zero at the top and ascending as we go down.
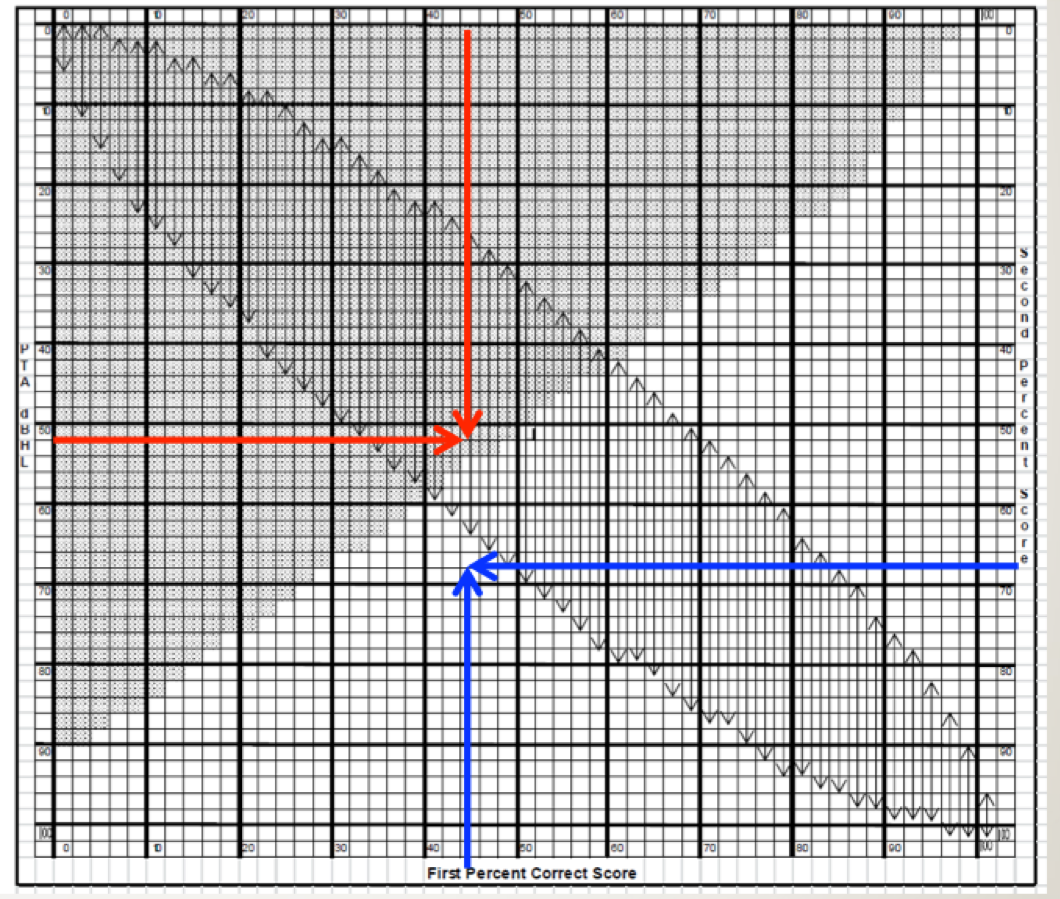
Figure 7. SPRINT chart for 50-word recorded Auditec lists. To examine the 95% confidence limit for PB-Max on the Auditec NU#6 list, determine the intersection of the word recognition score on the top x-axis, and the patient’s PTA on the left y-axis. If the intersection of these two values falls within the shaded area, the word recognition score is considered disproportionately low (based on the work of Dubno et al., 1995). This is illustrated with the red arrows. To examine the 95% critical difference for two word recognition scores, determine the intersection of the first (bottom x-axis) and the second (right y-axis) score. If the intersection point falls within one of the vertical arrows, the two scores are not significantly different from each other (based on work of Thornton and Raffin, 1978). This is illustrated with the blue arrows. The SPRINT chart is reproduced here with permission from the developer, Linda Thibodeau, PhD (Thibodeau, 2007).
31. I think I’m going to need a real patient example again to understand this.
Sure, let’s go back to our sample patient again (Figure 5). We first calculate that his pure-tone average for the left ear is 52 dB (locate 52 on the left y-axis of the chart). Next, we go to the top of the chart and locate this patient’s word recognition score, which was 44%. We then determine where this score intersects with the pure tone average on the chart. We have drawn two red arrows to show this point. Notice that the intersection falls in the shaded region. Hence, that would mean that his score of 44% is disproportionately low for this degree of hearing loss.
32. And what about the Thornton and Raffin critical differences?As we said, this is also included in this chart. This should turn out the same as it did before, but it will give you some practice. The X-axis on the bottom of the SPRINT is a %-correct score and the Y-axis on the right of the chart is the second %-correct score. It is for comparing two different scores, whether that is between right and left ears, or from one test session to the next.
For this comparison, disregard the shaded area, and focus on the vertical arrows. They are showing the 95% critical difference range for each score. We know our patient’s left ear score was 44%. Is that different from the right ear score of 68%? Well, we would then look to see if the intersection of the two different scores falls between the arrows; for this patient does it fall between 26% and 62%? On the SPRINT chart we have drawn a blue arrow up from 44% on the bottom x-axis, and a second blue arrow from the right of the SPRINT chart at 68% for the second ear score. Note that the intersection does not fall within the vertical arrows on the chart, so we would conclude that these two scores are indeed different. This is the same conclusion we reached when we used the chart in Figure 4, as we would expect since both use the same Thornton and Raffin values.
We agree. We wouldn’t leave home without it. Linda graciously makes it available from her website. If you want to start using it tomorrow morning, you can download the SPRINT chart for 50-word lists here: https://www.utdallas.edu/hhlab/resources-and-publications/clinical-tools/
Gus and Ben’s Tip #5: Always use the Dubno data (SPRINT Chart) to determine when a speech recognition score is abnormally low.
34. Several times now you’ve mentioned we rely on research that was established using the Auditec NU-6 recordings—I assume this was using CDs. My system has stored files of the Auditec word lists—is this still reliable?
Good question, as some of those systems use file compression algorithms. We are aware of at least two studies that say these files are equivalent, and no study that says that they are not. So we’d say that you are okay.
35. Good. I have one other thing to talk about, but I’m guessing I’m getting close to my 20th question?
36. I think I know the answer, but is it really a bad thing to use monitored live voice (MLV) for speech recognition testing?
Consider this - when you measure air conduction thresholds, do you whistle the pure tones, or do you use calibrated signals from your audiometer? As with whistling pure tones, the real issue is the validity and reliability of the test. If you are using monitored live voice, you are a test of one. In fact, you are not even really a test of one, because every time you say the words you say them differently. Because of that, your reliability is significantly reduced. In fact, it would be very difficult to interpret the results of your testing.
37. Is there research supporting your concerns?
Certainly. Fred Bess (1983) pulled from the literature PI functions from recorded NU-6 materials. These were commercially available recordings, but they were recorded by different people—this was before the Auditec of St. Louis recording became the standard. Here is a good example of why the talker matters. For one of the NU-6 recordings, the one recorded by Tom Tillman (1966; the original NU-6 recording), when the test was delivered at 8 dB SL the average score was 75% correct. But for a different recording of the very same NU-6 list (Beattie, 1977) the average score was 15% for 8 dB SL—a 60% difference between talkers for the same words. And these were recordings—we suspect the differences would be even bigger for live voice.
Regarding live voice research, we have some interesting, but not surprising, data from a study conducted by Ross Roeser and Jackie Clark (2008). They tested 16 adults (both right and left ears: 32 measures) related to litigation over potential work-related noise-induced hearing loss. Prior to the testing in their clinic, the group of patients had been evaluated using NU-6 MLV testing at a different facility. Roesser and Clark used the recorded version of the NU-6, and then applied the Thornton and Raffin 95% confidence levels to compare the recorded scores to the previously obtained MLV findings. Using this criterion, for 23 (72%) of the 32 tests, the scores for the recorded presentations were significantly poorer when compared to the MLV presentations. The difference between the two presentation modes exceeded 50% for 10 of the 23 scores (always lower for the standard recorded version). The authors, rather bluntly, summed up the findings: “. . . it appears that ignorance, complacency or laziness are the only reasons why clinicians elect to use MLV presentation for speech recognition testing.”
38. You maybe forget that some of us are busy. MLV is faster.
We’ve heard that before. How much faster, really? We have the data, as we’ll go back to the Mendel and Owen (2011) article previously cited. They compared test time for monitored live voice to the Auditec recording with the shortened interval (the recording we recommended). For their older hearing-impaired group, on average it was 49 seconds longer to conduct the testing using recorded material for a 50-word list. You are really going to dump all your validity and reliability to save 49 seconds? Moreover, for all the audiologists today who are using computer-based audiometers, where the speed of word recognition testing is controlled by a mouse click, we would guess that test time for the recorded list is essentially the same as for live voice presentation.
39. You’re saying that there is no value at all in live voice testing?
Yes, that is what we’re saying. We previously pulled out a quote from Tolstoy to help make a point. We’re not entirely sure of the origin of this one (Figure 8), but the message is equally important.
Figure 8. Important reminder regarding the use of recorded speech material for word recognition testing.
If for some reason, you would ever do live voice word recognition testing, then:
- You cannot use the Thornton-Raffin table to determine if a difference is a difference, as your word lists will not be equivalent.
- You cannot use the 10-Word screening test, as you do not know the 10 most difficult words for your voice on that given day.
- You cannot make decisions regarding how the scores relate to the audiogram, as the SPRINT Chart data is for the recorded version.
Gus and Ben’s Tip #6: Never conduct live voice speech recognition testing.
40. Closing comments?
We’re the first to admit that word recognition testing in quiet is one of the least important tests that we conduct. As long as we keep doing the procedure, however, we know that these findings will be used in the diagnostic process, to make medical referrals, to determine fitness and compensation, to make decisions regarding amplification, and in patient counseling. If Big Box stores who conduct speech testing in a warehouse can follow best practices, it seems like probably we all could. Let’s just agree to do it right!
References
Beattie, R.C., Edgerton, B.J., & Svihovec, D.V. (1977). A comparison of the Auditec of St. Louis cassette recordings of NU-6 and CID W-22 on a normal-hearing population. Journal of Speech and Hearing Disorders, 42, 60-64.
Bess, F. (1983). Clinical assessment of speech recognition. In D.F. Konkle & W.F. Rintelmann (Eds.), Principles of speech audiometry (pp. 127-201). Baltimore: University Park Press.
Carney, E., & Schlauch, R.S. (2007). Critical difference table for word recognition testing derived using computer simulation. J Speech Lang Hear Res, 50(5), 1203-1209.
Dubno, J.R., Lee, F. S., Klein, A.J., Matthews, L.J., & Lam, C.F. (1995). Confidence limits for maximum word-recognition scores. J Speech Lang Hear Res, 38(2), 490-502.
Guthrie, L.A., & Mackersie, C.L. (2009). A comparison of presentation levels to maximize word recognition scores. JAAA, 20(6), 381- 390.
Hornsby, B.W.Y, & Mueller, H.G. (2013, July). Monosyllabic word testing: Five simple steps to improve accuracy and efficiency. AudiologyOnline, Article 11978. Available at www.audiologyonline.com
Hurley, R. & Sells, J. (2003). An abbreviated word recognition protocol based on item difficulty. Ear and Hearing, 24(2), 111-118.
Jerger, J. (1980) Research priorities in auditory science—The audiologists view. Anal Oto Rhino Laryngol, (Suppl 74) 134-134.
Kamm, C.A., Morgan, D.E., & Dirks, D.D. (1983). Accuracy of adaptive procedure estimates of PB-max level. J Speech Lang Hear Res, 48, 202-209.
Mendel, L. & Owen, S. (2011). A study of recorded versus live voice word recognition. IJA, 50(10), 688-693.
Rintelmann, W.F., Schumaier, D.R., Jetty, A.J., Burchfield, S.B., Beasley, D.S., Mosher, N.A.,...Penley, E.D. (1974). Six experiments on speech discrimination utilizing CNC monosyllabic words (Northwestern University Auditory Test No. 6). Journal of Auditory Research, 2(Suppl), 1-30.
Roeser, R.J., & Clark, J.L. (2008). Live voice speech recognition audiometry - Stop the madness. Audiology Today, 20(1), 32-33.
Studebaker, G. (1982). Hearing aid selection: An overview. In G. Studebaker and F. Bess (Eds.), The Vanderbilt hearing aid report (pp. 147-160). Upper Darby, PA: Monographs in Contemporary Audiology.
Thibodeau, L.M. (2007). Speech audiometry. In R. Roeser, M. Valente, and H. Hosford-Dunn (Eds.), Audiology: diagnostics (pp. 288-313). New York: Thieme Medical Publishers.
Thornton, A., & Raffin, M. (1978). Speech-discrimination scores modeled as a binomial variable. J Speech Lang Hear Res, 21(3), 507-518.
Tillman, T. W., & Carhart, R. (1966). An expanded test for speech discrimination utilizing CNC monosyllabic words, Northwestern University Auditory Test No. 6. Technical Report No. SAM-TR-66-55(June), 1-12.
Citation
Mueller, H.G., & Hornsby, B.W.Y. (2020). 20Q: Word recognition testing - let's just agree to do it right! AudiologyOnline, Article 26478. Retrieved from www.audiologyonline.com

