
Editor’s Note: This text course is an edited transcript of a live webinar. Download supplemental course materials.
Dr. Karrie Recker: The Acceptable Noise Level (ANL) is the highest level of background noise that a listener is willing to tolerate while listening to running speech. Why is this important? One study by Nabelek et al. (2006) said that ANLs can predict with 85% accuracy who will be successful with hearing aids. In the past, we have not had success finding a test that correlates well with hearing aid success. This may allow us to make better recommendations for our patients.
What is the ANL?
In the ANL test, the listener first will adjust speech to a comfortable listening level. It is an adaptive procedure, so first they will adjust the speech so it is too loud, then too quiet, then to their most comfortable listening level. Background noise will be added and the person is asked to adjust the level of the noise using a bracketing procedure, first to a level that is higher than they would like, then soft enough that they could easily understand the speech, and then to the highest level that they are willing to put up with while listening to the speech. The difference between the speech level and the noise level is the person’s ANL. You can think of it as a tolerated signal-to-noise ratio (SNR). The ANL equals the most comfortable speech level minus the highest tolerated noise level.
People who have low ANLs, or the people who are willing to listen at fairly poor SNR ratios, are the people that Nabelek et al. (2006) indicated are likely to be successful with hearing aids. People who have high ANLs, or who are only willing to listen at very good SNRs, are the people who are unlikely to be successful with hearing aids.
There was a large distribution of ANL scores in the 2006 study (Nabelek, Freyaldenhoven, Tampas, Burchfield, & Muenchen, 2006), from about 0 dB SNR to 27 dB SNR. We have seen a much larger distribution than this in our lab, from 5 dB up to 42 or 43 dB. This is a huge range in the amount of noise that people are willing to tolerate while listening to speech.
Nabelek (2006) states that people who have the ANLs of 7 dB or less are likely to be successful with hearing aids, whereas people who have ANLs of 13 dB or higher are unlikely to be successful with hearing aids. However, we do not know how successful those in the middle will be.
Why does one person have a high ANL while another person has a low ANL? If we knew why people were able to put up with different amounts of background noise, we might tailor our counseling strategies to better suit the individual. Maybe we could make better technology recommendations. Perhaps manufacturers could create technologies that improve certain objectionable aspects of the sound and thereby improve a listener’s chances of success with hearing aids.
ANLs: General Information
Before we get deep into the topic, I want to provide you with some general information on ANLs. First, they do not appear to be related to an individual’s age (Nabelek, et al., 1991), locus of control (whether or not they feel like they are control of the situation) (Nichols & Gordon-Hickey, 2012), or the interest level of the material (Plyler, Alworth, Rossini, & Mapes, 2011). There is currently only a single study that has been done for each of these areas. On other topics for which the study has been repeated, generally conflicting results have been found. More specifically, there is conflicting evidence in the literature regarding whether ANLs are related to speaker gender, listener gender, hearing sensitivity, type of background noise, someone’s ability to understand speech in noise and hearing aid use (Table1).
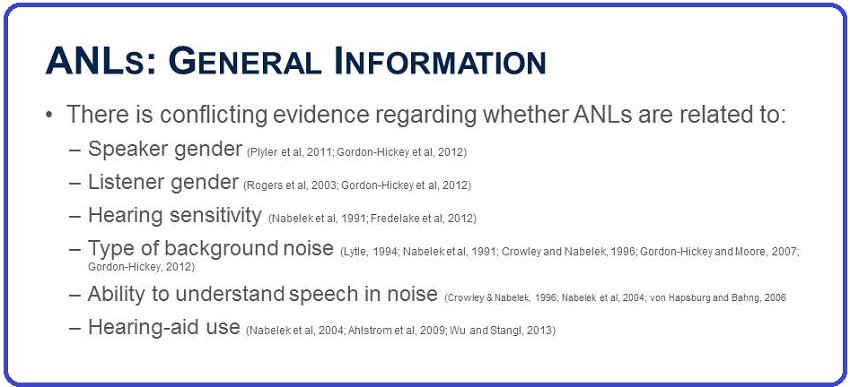
Table 1. Summary of studies regarding components of ANL scores.
Speaker Gender
One study found that ANLs are lower with a female talker than a male talker (Gordon-Hickey, Moore, & Estis, 2012). However, Plyler et al. (2011) found that speaker gender did not matter.
Listener Gender
One study found that males have a greater tolerance for noise than females (Gordon-Hickey, Moore, & Estis, 2012). However, Rogers et al. (2003) found that it does not matter whether the listener is female or male.
Hearing Sensitivity
Nabelek et al. (1991) found that ANL is independent of degree of hearing loss, but Fredelake et al. (2012) said people with hearing loss have lower ANLs than people with normal hearing. That is a surprising to me because we are used to hearing that people with hearing loss need a higher SNR than people with normal hearing.
Type of Background Noise
Some early studies said that the type of background does not matter (Lytle, 1994; Crowley & Nabelek, 1996) but more recent studies said it might matter (Nabelek, et al., 1991; Gordon-Hickey & Moore, 2007; Gordon-Hickey, et al., 2012). ANLs appear to be different if music is the background noise. They also may be different depending on the number of talkers.
Speech Understanding
Some studies have found that there is no correlation between someone’s ability to understand speech in noise and their ANL (Crowley & Nabelek, 1996; Nabelek, Tampas, & Burchfield, 2004; von Hapsburg & Bahng, 2006), but one study has shown that ANLs are lower for people who have better speech understanding(Ahlstrom et al., 2009).
Hearing Aid Use
Again, one study (Nabelek, et al., 2004) indicated that the ANL does not differ between aided or unaided conditions. However, another study (Ahlstrom, Horwitz, & Dubno, 2009) found different results--they found that people have lower ANLs if they are wearing hearing aids.Yet another study said it might depend on the type of signal processing in the hearing aid (Wu & Stangl, 2013).
There are many conflicting results.
Why the Conflicting Results?
If we test enough variables, I believe we will see some results that are significant and some that are not. There are likely other factors that could also be contributing to the differences in results, namely difference in the design of the studies.
Stimuli
First, the studies do not all use the same stimuli. Most researchers are using the Arizona Travelogue as the primary talker for the speech signal. The Arizona Travelogue is a male talker who narrates his travels in Arizona. Some people have used stimuli that are intelligible, such as the Arizona Travelogue, while others have used unintelligible stimuli, such as the International Speech Test Signal (ISTS) stimulus, which is collection of concatenated languages. Some have used different languages. There is a question of how different stimuli may alter the study outcomes.
Background Noise
Not every study uses the same type of background noise; most use a multi-talker babble. Some researchers have looked at different numbers of background talkers, different genders, and speech-shaped noise. The ANL literature for noise reduction studies has often used speech-shaped noise because noise reduction algorithms will react better to speech-shaped noise than to babble. Music has also been tested as a type of background noise.
There is also the question of whether or not the background noise is intelligible. If you only have one to a few talkers, there may be informational masking in the background noise in addition to the energetic masking.
Speech-in-Noise Tests
The studies that have looked at whether ANLs are related to performance on speech-in-noise tests have not all used the same tests. All that have found a non-significant result used the Speech in Noise Test (SPIN). The one study that found a relationship between someone’s ability to understand speech in noise and their ANL used the Hearing in Noise Test (HINT) (Ahlstrom, et al., 2009). Be aware that not every study is using the same speech-in-noise test.
Instructions
I do not think that the original authors for the ANL test protocol stressed the importance of using the same instructions for all subsequent studies or replications. People have modified the instructions from the original protocol. Additionally, the ANL has been translated into a variety of languages. That may also influence the results that experimenters are reporting.
Presentation Method
Everyone seems to be conducting the study in a different way. I have seen some studies perform the ANL testing under headphones. Some have used insert earphones. Some have also tested in the sound field with a variety of speaker placements. Some experimenters have used monaural testing, some diotic, some dichotic.
Control of Stimulus Level
In most studies, the participant or subject is seated inside of a booth, and they signal to the experimenter whether they want the levels of the speech and noise increased or decreased. The participant does not physically change the levels; that is controlled by the experimenter. That may add another layer of bias, but that is how most of the ANL testing has been done. Some labs, such as ours, do employ an automated version of the test where the participant adjusts the levels.
Subject Pool
Eddins, Arnold, Klein, and Ellison (2013) did a meta-analysis for the distribution of ANLs in normal hearing, hearing-impaired unaided, and hearing-impaired aided groups. The range of ANLs is widely different in some of these studies. In some of them, the ranges do not even overlap. It makes you wonder if there are differences within the populations that these different groups are testing as well.
Test-Retest Reliability
Test-retest reliability is another thing to consider. Good test-retest information has been lacking to date because most researchers have looked at correlation statistics of a group. When you are working with a single individual in your clinic or laboratory, you want to know what the test-retest reliability is for that individual.
Brännström and colleagues (2014) ran 12 iterations of the ANL test. The graph they show in their article is a helpful depiction of the variability of test-retest. For some of the participants, the ANLs were exactly the same from the first measurement to the last measurement. Other participants had a large test-retest variance from the first trial to the twelfth trial; in some cases, it was more than 20 dB.
In some cases, the variability may not matter much because it does not change the prediction whether someone is likely to be successful with hearing aids. In their study (Brännström, et al., 2014), participant #1 had a large range in their ANLs, but you would still consider them likely to be successful with hearing aids because both ANL scores are low. Even though there was variation for some of the participants, it would not change the category to which they belong.
There are other people you would expect to be successful with hearing aids based on the results of their first test, but on a retest you would consider them unlikely to be successful with hearing aids. So which do we believe? Do you run multiple iterations of the test and average the results?
This question of test-retest inspired me to replot some of the data that we have collected in our lab on 79 normal-hearing people (Recker, McKinney, & Edwards, 2014). In Figure 2, the participant number is across the X axis with the ANL along the Y axis. We ran five trials of the ANL test for each participant. For the group, the median amount of distribution in participants’ ANLs was 5 dB, but know that there is a range. The subjects on the left of the graph (Figure 2) have low ANLs across most of their test conditions (under the bottom orange line). They would be considered likely to be successful with hearing aids. Anyone below the orange line has ANL of less than 7 dB. The people who have ANLs higher than 13 dB (above the top orange line) are the ones who are unlikely to be successful with hearing aids, according to Nabelek et al. (2006). All of the trials for some of the participants would put them in the high ANL category. However, you see that there are some people who would be considered low ANL on one trial and high ANL on another. We need to be aware of that. I would recommend running at least a few iterations with each patient and taking the mean of them.
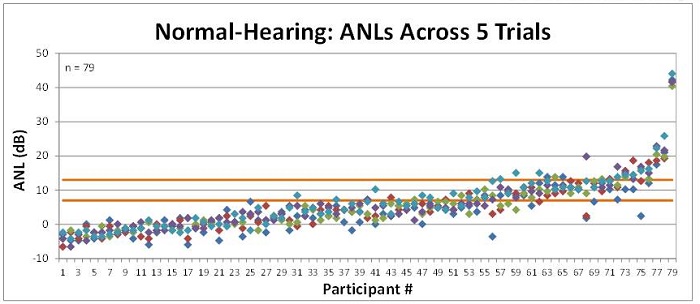
Figure 2. Test-retest ANL scores in 79 people with normal hearing. The bottom orange line is equal to an ANL of 7 dB, or a low ANL; the top orange line is equal to 13 dB, or a high ANL.
We have similar data on 140 people with hearing loss (Figure 3). We saw the same trend where some people on one test would be considered successful with hearing aids but on a retest would be considered unlikely to be successful. Again, I would recommend running a few trials and averaging them.
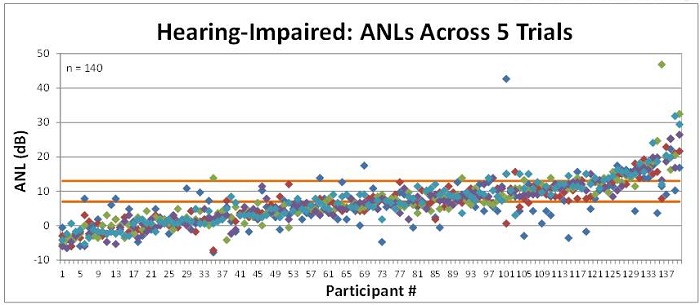
Figure 3. Test-retest ANL scores across 5 trials in 140 people with hearing impairment. The bottom orange line is equal to an ANL of 7 dB, or a low ANL; the top orange line is equal to 13 dB, or a high ANL.
Changing our Perspective
I think the many differences in study design make it difficult for us to compare results and decide which variables are important. Maybe we should think about this a little bit differently. Perhaps we could determine why different people are willing to accept different amounts of background noise instead. If we know why they are willing to put up with varying levels of noise, maybe we could predict what variables will affect ANL instead of guessing. It may also allow us to do something to improve the listener’s ANL, and presumably his or her chance of success with hearing aids.
Research Questions
Over the last several years at Starkey, we have focused on the following questions: How are people deciding how much background noise they are willing to accept? and What can we do about it?
We started by brainstorming what potential ANL cues could be. We thought about loudness of the background noise, listening effort, annoyance, speech intelligibility, possibly something else we did not think of, or a combination of any of these cues.
Questionnaire Study #1
As you saw, we collected ANL data on 79 normal hearing and also on 140 hearing-impaired people (Recker, McKinney, & Edwards, 2011). In addition to the ANL trials, we distributed a six-question questionnaire to collect their opinions on how they perceive background noise. In particular, we investigated the perceived negative impact that background noise had on speech intelligibility, stress levels, and concentration levels. The questionnaire also asked people how bothersome they find background noise to be, their own perceived tolerance for background noise, and then whether or not they avoid situations known to have high levels of background noise.
We asked the participants to think about how they feel in a crowded, noisy situation compared to a quiet situation. The first question was, “In noisy situations, (e.g., a crowded restaurant or bar), I __________ more difficult to concentrate than when in quiet situations.” The choices were: a) find it much; b) find it somewhat; c) find it slightly; d) rarely find it any.
Similarly, question two was, “In noisy situations (e.g., a crowded restaurant or bar), I________ more stressed than when in quiet situations,” with choices of: a) feel much; b) feel somewhat; c) feel slightly; d) rarely feel any.
The third question was, “In noisy situations (e.g., a crowded restaurant or bar), I________ more difficult to understand the speech of those sitting next to me than when in quiet situations.” Choices are: a) find it much; b) find it somewhat; c) find it slightly; d) rarely find it any.
Question four was, “I usually find high levels of background noise, like those encountered in a crowded restaurant or bar, to be __________.” Choices were: a) extremely bothersome; b) very bothersome; c) somewhat bothersome; d) slightly bothersome; e) rarely bothersome.
Question five was “I consider myself to be __________.” Choices are: a) extremely intolerant of background noise; b) very intolerant of background noise; c) somewhat intolerant of background noise; d) slightly intolerant of background noise; e) very tolerant of background noise. The final question was “I __________.” Choices were: a) usually avoid situations that have high levels of background noise; b) frequently avoid situations that have high levels of background noise; c) sometimes avoid situations that have high levels of background noise; d) occasionally avoid situations that have high levels of background noise; e) rarely base my decision on whether to enter an environment on the level of the background noise.
Questionnaire Results
Eighty-six people with normal hearing and 53 people with hearing loss completed this questionnaire. The mean audiometric thresholds of the participants varied from mild sloping to severe and were symmetrical. Compared to the Nabelek et al. article (2006), we saw people with more negative ANLs (Recker, et al., 2011). If you recall, most people had an ANL of around 10 dB in the Nabelek et al. (2006) article. Our ANL results were a bit lower.
We did a regression analysis and found that the primary factors influencing listeners’ ANLs were perceived concentration levels, perceived speech understanding abilities and perceived tolerance for background noise. It was these same three factors for both the normal-hearing and the hearing-impaired groups.
For people with normal hearing, the primary contributing factor was their own perceived tolerance for background noise(i.e. asking people how tolerant they think they are of background noise).For the people with hearing loss, the best predictor was their own perceived speech understanding abilities in noise. But for both of these groups, the R-squared values (the value that ranges from 0 to 1; 0 is a very low score, 1 is a very high score), were fairly low, even though they were both significant. This suggests that while these factors may be influencing listeners’ ANLs, they are probably not the primary driving force, and there are likely other things going on.
Next, we wanted to know if we could use these results to predict the ANL category to which someone belongs. For this, we performed a quadratic discriminant analysis. About half of the time, we could predict whether someone would have a low, mid, or high ANL (54% for normal-hearing group; 49% for hearing-impaired group). Chance performance for selecting the correct group is 33%. Although 50% was better, it was not good enough to be clinically useful.
Questionnaire Study #2
The next questionnaire study was performed by Nichols and Gordon-Hickey (2012). They compared ANLs with the results of a self-control scale by using a 36-item questionnaire. All of the items were answered on a five-point scale from “not at all” to “very much.” They found that listeners who had more self-control accepted higher levels of background noise. The R value is fairly low but significant, suggesting that this may play a role in listeners’ ANLs.
Loudness
Perhaps people are basing their judgments on loudness. Maybe the noise gets to a certain level and they cannot put up with it anymore. Before I get into our research study, I want to make a couple of comments about loudness.
Partial Loudness
On the ANL test, you have to remember that both speech and noise are presented at the same time. Whenever you have two sounds that are occurring at the same time, the presence of one sound affects your judgment of the loudness of the second sound. This is called partial loudness (Moore & Glasberg, 2007). In short, if you have the sound playing in isolation, such as a quiet room, it is going to sound louder than if you have other sounds playing at the same time. If those other sounds are made lower in level, then this initial sound will sound louder. At most, the primary sound can only ever sound as loud as it would in quiet. If you make the other sounds that are playing at the same time very low in level, their loudness will approach 0. The addition of other sounds at the same time as the primary sound can never make the initial sound sound louder; it can only make it sound quieter.
We had to consider how the presence of the speech affects the judgments of the loudness of the background noise during the ANL test. We were hoping when we started this study that we could do a literature review and answer our question. Unfortunately, we found that almost all of the research studies that have looked at partial loudness have used simple stimuli, such as tones, complex tones, and narrowband noise. We decided we needed to look at this on our own before we could see how loudness impacts ANLs.
Loudness Study
We included 21 people with normal hearing and 21 people with hearing loss in our study (Recker, et al., 2014). We grouped the participants according to whether they had a low, mid, or high ANL; each group had seven participants. We did not match the groups for hearing loss because a previous research study (Nabelek, et al., 1991) indicated that ANLs are independent of hearing thresholds.
Methods
We seated listeners in a sound booth facing a speaker and also a touch-screen monitor. Both speech (Arizona Travelogue) and noise (multi-talker babble) came out of the speaker in front of them. Figure 4 is a screen-shot of what they saw on their monitor. The button in the corner says start. They press start, and then hear the multi-talker babble play for three seconds. The babble plays at 1 of 5 different levels: 45, 55, 65, 75, or 85 dB. They did not see the information written in green; that is only for identification purposes today.
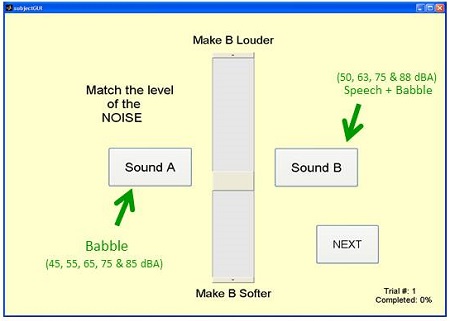
Figure 4. Screen shot of computerized loudness test method (Recker, et al., 2014).
After the noise played for three seconds, they then heard speech and noise playing at the same time. The speech was played at 50, 63, 75, or 88 dBA, but they did not see this information. Then also heard the same multi-talker babble from sound A. The multi-talker babble was playing at a random level, and the participants were instructed to adjust the level of the babble so that it sounded equally as loud as the babble in sound A. They used the slider in the middle of the screen (Figure 4) to adjust the level of the background noise in sound B.
For example, let’s say the reference noise begins playing for 3 seconds at 85 dB. Then the test condition, which was speech plus noise, started out with speech at 50 dB and the noise at a random level. Their task was to adjust the level of the noise so that it sounded equally as loud as the reference condition, which was noise at 85 dBA.
In this case, when the reference is a high intensity and the speech is a low intensity, the listener will ignore the speech. They are able to crank up the noise so that it equals the level of the reference noise; they match it to 85 dBA.
We tested at several levels. We kept the reference at 85 dBA. The speech level changed, but the same task was given to ignore the speech and focus on the loudness of the background noise and match it so that it was equally loud to the reference noise. In reality, all of the conditions were randomized, but this scenario is just to help you understand what we did. They matched it fairly closely to 85 dBA. We see a similar effect when the speech is at 75 dBA and 88 dBA. Even when speech is about 5 dB higher than the noise, it is still does not have much impact on the listener’s judgment of loudness.
Next, we changed the reference noise to 75 dB. Similarly, they ran through the same task first with the speech at 50 dB. The speech intensity was low enough that it did not affect their judgment of the loudness of the noise. They turn it up and match it to 75 dB. When the speech is at 63 and 75 dB, it also does not really affect their judgment of the loudness of the noise.
Then we did the same thing with the reference noise at 65 dB. When the speech is at its highest, 23 dB higher than the level of the noise, it starts to impact the listener’s judgment of the loudness of the noise. The speech sounds very loud, which makes the noise quieter, and so they have to increase the level of the noise so that it sounds equally loud as the reference condition.
When speech is at a high intensity and noise is playing at a random level initially, they have to adjust the noise so that it sounds equally as loud as the reference, but what happens is that they turn it up a little higher in level than the reference in order to make it sound equally loud, because the speech is now interfering with their judgment of loudness.
We did the same thing with the reference noise at 55 dBA. Because the speech is much higher in intensity than the noise, it affects the loudness judgment more. For the highest test condition (speech at 88 dBA), the listener now has to turn up the noise level by 6 dB so that it sounds equally loud as the reference. By the time we get to a reference of 45 dBA, the participants had to increase the level of the noise by 10 dB so that it sounded equally loud as the reference.
Testing ANL
We tested the ANL at four different levels. It was a modified version of the ANL where we fixed the level of the speech and asked them to adjust noise to the highest level they were willing to tolerate while listening to the speech. We tested with the speech fixed at 50, 63, 75, and 88 dBA. We wanted to know whether or not they would adjust the level of the noise so that it was equal in loudness across the four fixed speech conditions.
Two of the 42 participants did adjust the level of the noise to a constant loudness across all four test conditions. These two people had ANLs that matched up nicely with the equal loudness curves. So, we think that at least a few people may be using the loudness of the background noise to determine how much noise they are willing to put up with for the ANL test. However, for most people the ANLs and the loudness of the background noise, increased with presentation level.
For the other 40 participants in the study, we decided to look at speech intelligibility. Across the four ANL conditions, did they set the levels of the noise to maintain a constant level of speech intelligibility? Some of the early literature suggests that this might not be true. Franklin et al. (2006) fixed the ANL speech level in several conditions and had subjects adjust the level of the background noise to the highest level that they were willing to tolerate while listening to the speech. They found that as the speech level increased, ANLs also increased. With this result, if the SNR increased as the speech level increased, the amount of information available to the person to understand speech should also increase. This would be one indicator that people may not be using speech intelligibility as a cue to determine their ANLs.
Other researchers documented this as well (Tampas & Harkrider, 2006; Freyaldenhoven, Plyler, Thelin, & Hedrick, 2007; Recker & Edwards, 2013). These are averaged data. When you start looking at individual data, you will see that some people follow a different pattern. We found that there seems to be a subset of listeners who is willing to listen at a constant ANL across a wide range of speech levels (Recker, et al., in preparation). It is possible that these individuals are using speech intelligibility as their listening cue.
ANL Results
Besides our article, there are other researchers who have found similar results. Tampas and Harkrider (2006) also reported finding some participants who had ANLs that were constant across a wide speech range.
Dr. Susie Valentine (2009) looked at testing ANLs using different spectra of background noises. She used the standard multi-talker babble, but she also used broadband noise, low-pass filtered noise, high-pass filtered noise, low-frequency band passed noise, and high-frequency band passed noise. All her subjects had mild to moderately severe sensorineural hearing loss. All five subjects in her study had low ANLs. Not surprisingly, she found that ANL varied across the different noise conditions.
More interestingly, Valentine (2009) looked at the speech intelligibility index (SII) for these same noise conditions. SII scores range from 0 to 1; 0 means none of the speech information is available, and 1 means 100% of it is available. She found that the SII hovered consistently around 0.4 across the six conditions for the participants.
She tried to predict how this corresponds to a percent-correct score. Using a transfer function from Hargus and Gordon-Salant (2005). , a 0.4 SII correlates to approximately 80% correct. Based on that, the listeners in the Valentine (2009) study were setting the level of the background noise to achieve about 80% intelligibility.
Speech Intelligibility Study
Based on that, we decided to look at speech intelligibility with our subjects. We calculated the SII at each of the test levels. We determined that SIIs that varied by less than 0.1, which is roughly a 3 dB range, were consistent with a speech-intelligibility-based listening criteria. Our results were consistent with a speech-intelligibility-based listening cue for 62% of the people with normal hearing and 5% for those with hearing impairment (Recker, et al., in preparation). This is a large difference.
Secondly, when we looked at whose results were consistent with this criteria, four people in the normal hearing group with low ANLs were consistent with a speech-intelligibility listening cue, but so were the results for three people with mid ANLs and six people with high ANLs. That was a bit surprising to us. Even the one person with hearing impairment whose ANLs were consistent with a speech-intelligibility-based listening cue had a mid-range ANL. If you remember, we hypothesized that people with low ANLs would use speech-intelligibility-based listening cues.
We looked at ANL scores for the normal-hearing group, categorized into low, mid and high ANL (Figure 5). These are the ANLs averaged across levels of 50, 63, 75, and 88 dB. The mean ANL for people in the low group was 0.3 dB. The mid ANL group mean was 13.6 dB, and the high ANL group mean was 12.3 dB.
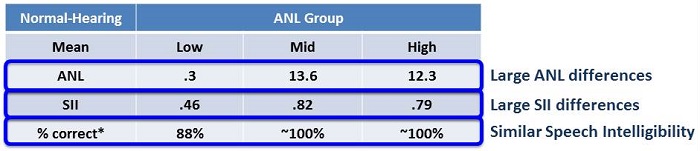
Figure 5. Mean ANL, SII and percent correct results for the normal-hearing group, categorized into low, mid and high ANL subsets.
The mean SII for the low ANL group was 0.46 and for the other two groups, it was closer to 0.8 (Figure 5). When we looked at speech intelligibility by percent correct, we estimated 88% for the low ANL group, but close to 100% for the mid and high groups.
Our speculation is that those with low ANLs may be choosing the lowest SNR that provides good speech intelligibility. Those with mid and high ANLs might also be trying to minimize listening effort. A paper by Sato et al. (2011) found that speech intelligibility should be close to 100%, or the maximum, when the SNR is at 0 dB. But it is not until the SNR reaches about 10 to 15 dB that listening effort is minimized. Perhaps the people with low ANLs are getting close to 100% speech intelligibility; and maybe that is the only cue they are using. For people with higher ANLs, they may also be trying to minimize listening effort.
The hearing impaired listeners’ results were more varied. As an extreme example of what we found, when the speech was presented at 50 dBA, it was estimated that listeners would get about 10% correct. However, when the speech was at 88 dBA, they were expected to get around 100% correct. The amount of improvement in intelligibility as the speech increased from 50 to 85 dBA was drastic. The median improvement was 49% for most participants.
We were curious as to why that happened. When we presented the speech at the quietest level (50 dBA), we told listeners if they could not understand or hear at this level that we would drop this condition. However, all but three individuals indicated that they were able to hear and follow the speech at 50 dBA. The fact that our metrics predict that they should only be able to understand 10% of the speech makes us wonder whether or not they were following the instructions.
Another potential factor may be that the SII is not accurate for the ANL stimuli, or perhaps the transfer function we use to convert SIIs into percent correct is not accurate.
The low SIIs that we saw for the hearing-impaired listeners suggest that SII might not be an accurate predictor of speech intelligibility for the ANL.
Other Thoughts on Speech Intelligibility
If listeners are using speech intelligibility to determine their ANL, we would expect to see some other results. Specifically, we would expect that any hearing aid technology that can improve speech intelligibility, such as directional microphones and remote microphones, would lower ANLs by about 3 to 5 dB (Freyaldenhoven, Nabelek, Burchfield, & Thelin, 2005; Peeters, Kuk, Lau, & Keenan, 2009; Kim & Bryan, 2011; Wu & Stangl, 2013). That is similar to the amount of improvement that we see on speech-in-noise tests (Freyaldenhoven, et al., 2005; Peeters, et al., 2009; Kim & Bryan, 2011). For features that do not improve speech intelligibility, such as noise reduction, we would expect those features to have no impact on ANLs. I have seen some studies that have shown no improvement in ANL with noise reduction and other studies that have shown up to approximately 4 dB of improvement.
A few studies show that people with higher ANLs seem to benefit more from noise reduction technology (Mueller, Weber, & Hornsby, 2006; Eddins, Klein, Arnold, & Ellison, 2013). Edwards et al. (2011) tested three groups (low, mid, and high ANL) at different fixed speech levels and were looking at the improvement in ANL with noise reduction technology. People with low ANLs did not receive any benefit from the noise reduction technology. If they were using speech intelligibility to decide how much noise they were willing to accept, we would expect this result.
Noise reduction technology cannot improve someone’s ability to understand speech, and adding this features will not improve their ANL. If the listeners are using a cue other than intelligibility, perhaps loudness, annoyance, or listening effort, then noise reduction may improve their ANL. It is worth pointing out that people with higher ANLs are the least likely to be successful with hearing aids, and they are the most likely to receive benefit on the ANL test with noise reduction technology. Eddins, Klein et al. (2013) found results similar to this.
Conclusion
In summary, of the many studies available, several have conflicting results. There are likely a variety of reasons for that, such as differences in study design, test/retest, and (perhaps) population differences. Knowing why people are willing to accept varying levels of background noise may provide insight into what is going on.
On questionnaires, we saw mild but significant correlations between listeners’ ANLs and perceived concentration levels, perceived speech understanding abilities, self-reported tolerance for background noise, and self-control. Also, some people appear to be using the loudness of the background noise as a listening cue while others appear to be using the intelligibility of the speech signal.
It is important to know that there are a variety of technologies available that can reduce ANLs. These are technologies that can improve someone’s tolerance of background noise. For those who are at-risk of being unsuccessful with hearing aids, it may be worthwhile to consider whether they need directional microphones. If you know a patient has a high ANL prior to a fitting, you may want to counsel him or her about trying remote microphones, as they may need more help than the average person. It may be worthwhile to try a stronger amount of noise reduction with your patients with high ANLs, and possibly even change the gain for loud sounds.
For those of you earning CEUs, there is a slide I did not get to. The answer to number four is A.
Questions and Answers
What are the ages of your subjects?
Most of the people we see are mid-60s to low 80s. On average, they are mid-70s. Occasionally we will get someone younger, but for the most part, the people we are able to see are retired.
Did you ever look at age as a factor?
No, we did not, I guess in part, because some of the early literature suggested it did not matter. We have the data and could look at it.
Any thoughts or findings in the literature review about correlation with low ANLs and low uncomfortable loudness levels (UCLs)?
I looked at all the data that we collected from the people with the hearing loss, and I did not find any correlations between ANLs and UCLs.
Were the normal-hearing subjects younger than the hearing impaired subjects?
Yes. Many of the normal-hearing people were Starkey employees, friends, family members, and outside people. In general, they were younger than our hearing-impaired group.
Is there a correlation between personality types?
We have not looked at that here.
Were there correlations with the amount of daily hearing aid use?
With the limited amount of data that we have, we did not see a correlation between amount of hearing aid use and ANLs.
References
Ahlstrom, J.B., Horwitz, A. R., & Dubno, J. R. (2009). Spatial benefit of bilateral hearing aids. Ear and Hearing, 30(2), 203-218.
Brännström, K. J., Holm, L., Kastberg, T., & Olsen, S. O. (2014). The acceptable noise level: the effect of repeated measurements. International Journal of Audiology, 53(1), 21-29. doi: 10.3109/14992027.2013.824116.
Brännström, K. J., Zunic, E., Borovac, A., Ibertsson, T. (2012) Acceptance of background noise, working memory capacity, and auditory evoked potentials in subjects with normal hearing. Journal of the American Academy of Audiology, 23(7), 542-552.
Crowley, H. J., & Nabelek, I. V. (1996). Estimation of client-assessed hearing aid performance based upon unaided variables. Journal of Speech and Hearing Research, 39, 19-27.
Eddins, D. A., Arnold, M., Klein, A., & Ellison, J. (2013). Individual variability in unaided and aided measurement of the acceptable noise level. Seminars in Hearing, 34(2), 118-127. doi: 10.1055/s-0033-1341348.
Eddins, D. A., Klein, A. V., Arnold, M. L., & Ellison, J. (2013) Acceptable noise level: Effect of presentation level, digital noise reduction, and stimulus type. Poster presented at the annual meeting of the American Academy of Audiology, Anaheim, CA.
Edwards, B., Abrams, H., Ellison, J., McKinney, M., Recker, K., & Valentine, S. (2011). Psychoacoustic mechanisms behind acceptable noise level thresholds. Podium presentation presented at the annual meeting of the American Auditory Society, Scottsdale, AZ.
Franklin, C. A., Thelin, J. W., Nabelek, A. K., & Burchfield, S. B. (2006). The effect of speech presentation level on acceptance of background noise in listeners with normal hearing. Journal of the American Academy of Audiology, 17(2), 141-146.
Fredelake, S., Holube, I., Schlueter, A., & Hansen, M. (2012). Measurement and prediction of the acceptable noise level for single-microphone noise reduction algorithms. International Journal of Audiology, 51(4), 299-308. doi: 10.3109/14992027.2011.645075.
Freyaldenhoven, M. C., Nabelek, A. K., Burchfield, S. B., & Thelin, J. W. (2005). Acceptable noise level as a measure of directional hearing aid benefit. Journal of the American Academy of Audiology, 16(4), 228-236.
Freyaldenhoven, M. C., Plyler, P. N., Thelin, J. W., & Hedrick, M. S. (2007). The effects of speech presentation level on acceptance of noise in listeners with normal and impaired hearing. Journal of Speech, Language, and Hearing Research, 50(4), 878-885.
Gordon-Hickey, S., & Moore, R.E. (2007). Influence of music and music preference on acceptable noise levels in listeners with normal hearing. Journal of the American Academy of Audiology, 18, 417-427.
Gordon-Hickey, S., Moore, R. E., & Estis, J. M. (2012). The impact of listening condition on background noise acceptance for young adults with normal hearing. Journal of Speech, Language, and Hearing Research, 55(5), 1356-1372. doi: 10.1044/1092-4388(2012/11-0140).
Halstrom, J. B., Horwitz, A. R., & Dubno, J. R. (2009). Spatial benefit of bilateral hearing aids. Ear and Hearing, 30(2), 203-218. doi: 10.1097/AUD.0b013e31819769c1.
Hargus, S. E., & Gordon-Salant, S. (1995) Accuracy of speech intelligibility index predictions for noise-masked young listeners with normal hearing and for elderly listeners with hearing impairment. Journal of Speech, Language, and Hearing Research, 38, 234-243.
Kim, J. S., & Bryan, M. F. (2011). The effects of asymmetric directional microphone fittings on acceptance of background noise. International Journal of Audiology, 50, 290-296.
Lytle, S. R. (1994). A comparison of amplification efficacy and toleration of background noise in hearing impaired elderly persons. MA thesis, University of Tennessee, Knoxville.
Moore, B. C., & Glasberg, B. R. (2007). Modeling binaural loudness. Journal of the Acoustical Society America, 121(3), 1604-1612.
Mueller, H. G., Weber, J., & Hornsby, B. W. (2006). The effects of digital noise reduction on the acceptance of background noise. Trends in Amplification, 10(2), 83-93.
Nabelek, A. K., Freyaldenhoven, M. C., Tampas, J. W., Burchfield, S. B., & Muenchen, R. A. (2006). Acceptable noise level as a predictor of hearing aid use. Journal of the American Academy of Audiology, 17, 626-639.
Nabelek, A. K., Tampas, J. W., & Burchfield, S. B. (2004). Comparison of speech perception in background noise with acceptance of background noise in aided and unaided conditions. Journal of Speech, Language, and Hearing Research, 47(5), 1001-1011.
Nabelek, A. K., Tucker, F. M., & Letowski, T. R. (1991). Toleration of background noises: Relationship with patterns of hearing aid use by elderly persons. Journal of Speech and Hearing Research, 34, 679-685.
Nichols, A. C., & Gordon-Hickey, S. (2012). The relationship of locus of control, self-control, and acceptable noise levels for young listeners with normal hearing. International Journal of Audiology, 51(4), 353-359. doi: 10.3109/14992027.2011.645074
Peeters, H., Kuk, F., Lau, C., & Keenan, D. (2009) Subjective and objective evaluation of noise management algorithms. Journal of the American Academy of Audiology, 20(2), 89-98.
Plyler, P. N., Alworth, L. N., Rossini, T. P., & Mapes, K. E. (2011). Effects of speech signal content and speaker gender on acceptance of noise in listeners with normal hearing. International Journal of Audiology, 50(4), 243-248.
Recker, K. L., & Edwards, B. W. (2013). The effect of presentation level on normal-hearing and hearing-impaired listeners' acceptable speech and noise levels. Journal of the American Academy of Audiology, 24(1), 17-25. doi: 10.3766/jaaa.24.1.3.
Recker, K. L., Micheyl, C., & Edwards, B. W. in preparation.
Recker, K., McKinney, M. F., & Edwards, B. (2011). Can acceptable noise levels be predicted from a noise-tolerance questionnaire? Canadian Hearing Report, 6(3), 31-38.
Recker, K, McKinney, M. F., & Edwards B. (2014). Loudness as a cue for acceptable noise levels. Journal of the American Academy of Audiology, 25(6), 605-622.
Rogers, D. S., Harkrider, A. W., Burchfield, S. B., & Nabelek, A. K. (2003). The influence of listener's gender on the acceptance of background noise. Journal of the American Academy of Audiology, 14(7), 372-382.
Sato, H., Morimoto, M., & Ota, R. (2011). Acceptable range of speech level in noisy sound fields for young adults and elderly persons. Journal of the Acoustical Society of America, 130(3), 1411-1419. doi: 10.1121/1.3609122.
Tampas, J. W., & Harkrider, A. W. (2006). Auditory evoked potentials in females with high and low acceptance of background noise when listening to speech. Journal of the Acoustical Society of America, 119(3), 1548-1561.
Valentine, S. (2009). Unpublished raw data.
von Hapsburg, D., & Bahng, J. (2006). Acceptance of background noise levels in bilingual (Korean-English) listeners. Journal of the American Academy of Audiology, 17(9), 649-658.
Wu, Y. H., & Stangl, E. (2013). The effect of hearing aid signal-processing schemes on acceptable noise levels: perception and prediction. Ear and Hearing, 34(3), 333-341. doi: 10.1097/AUD.0b013e31827417d4.
Cite this Content as:
Recker, K. (2015, January). Acceptable Noise Levels: a useful tool? AudiologyOnline, Article 13199. Retrieved from https://www.audiologyonline.com.