
In recent years, open canal (OC) hearing instruments have become a popular style selection for individuals with mild-to-moderate downward sloping hearing loss. One of the reasons for their popularity is that such instruments do not create the so-called "occlusion effect" that irritates so many users of conventional hearing instruments when a closed fitting is employed (Mueller & Ricketts, 2006).
The response of an OC instrument when measured with an occluded coupler will deviate very much from its response in the in situ condition (Martin, 2006;International Electrotechnical Commission, 2005;American National Standards Institute, 2003). It is desirable, therefore, to measure the electroacoustic performance of open canal instruments in an "open" configuration, in which in situ conditions are simulated as much as possible. However, several problems can potentially occur with non-occluded coupler measurements because of the interference of the direct and processed sound signals. The purpose of this article is to describe the factors that affect the real-ear response of OC instruments, and to suggest a method of measuring the performance of OC hearing instruments so that in situ conditions are simulated as close as possible, and the results are stable and repeatable.
Operation of an open-ear instrument
In a typical OC fitting, a non-occluding ear canal tip or dome is used. This dome allows a substantial amount of sound energy to enter and to escape from the ear canal. Such a dome performs similarly to an earmold with a very large vent, therefore eliminating or minimizing the occlusion sensation.
The operation of an OC behind-the-ear (BTE) instrument is illustrated in Figure 1. In an OC fitting, some of the amplified sound energy from the receiver (amplified path) reaches the eardrum, while some of the amplified sound escapes out from the open canal and forms a feedback path back to the microphone (feedback sound pressure level (SPL)). Sound energy from the external sound source also goes through the dome directly into the open ear canal, forming a feed forward SPL.
The major contributors to the open coupler response of an OC BTE in the ear (or measured with an ear simulator) are:
- amplified path
- feed forward SPL
- feedback SPL
- processing delay of the BTE circuit
The sound pressure that the receiver creates in the open canal without the influence of the feed forward SPL or the feedback SPL can be referred to as amplified path SPL.
Most if not all OC BTEs today employ circuits with digital signal processing (DSP). The DSP causes a signal delay of 2-6 ms between the input and the output signal. The summation of the delayed receiver SPL with the feed forward SPL (no delay) will create a coupler response with ripples (comb filter effect). The ripples will have maximum amplitude where the amplified path and the feed forward SPL are similar in intensity.
Another source of the ripples would be a summation of the input SPL (no delay) and the feedback SPL (delayed). The relationship between the feedback SPL and the input SPL are critical for the in situ feedback stability of the open canal instrument and will be analyzed later.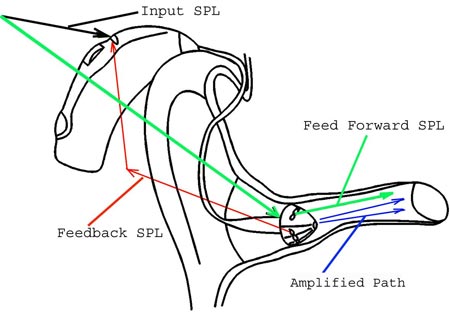
Figure 1. Operation of an open-ear hearing instrument
Amplified path in the open canal
A simulated response of the amplified path SPL in the occluded ear simulator is shown in Figure 2 (solid black line). The occluded ear simulator keeps the sound energy from leaking out, therefore, making it possible to obtain relatively high gain throughout the frequency range. In OC hearing aids most of the sound energy, especially at low frequencies, escapes from the ear canal through the gaps in the dome. The acoustic mass of the open canal partially blocks the sound energy at high frequencies from escaping, therefore enabling the creation of more sound pressure at the ear drum. A simulated open-ear amplified path SPL in the ear simulator is shown in Figure 2 (blue line). The SPL falls below 2000 Hz at the rate of 12 dB per octave due to the leak of the sound energy from the ear canal. As a consequence, OC instruments do not provide any positive insertion gain at low frequencies.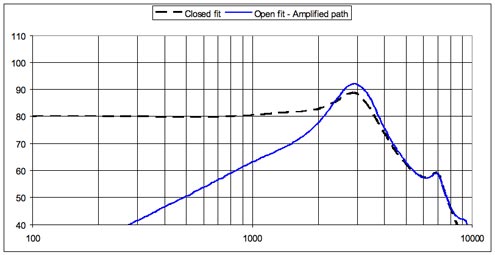
Figure 2. SPL in the ear simulator: Closed fit (black);open fit due to the amplified path only (blue)
Feedback SPL
The feedback SPL is formed by the sound energy that escapes the open ear canal and reaches the microphone of the OC BTE. Figure 3 shows a simulated open-loop frequency response of the feedback SPL for various gains. The input SPL is constant within 100-10000Hz (60 dB SPL - black dashed line).
The open-loop feedback response indicates how stable the instrument would be in normal conditions (closed-loop mode). The feedback in the closed-loop mode will occur if the open-loop feedback SPL reaches the input SPL (critical gain). The instrument will operate without the feedback if the open-loop feedback SPL response is lower than the input SPL (below the critical gain). The minimum difference between input SPL and open-loop feedback SPL is often referred to as the feedback margin.
The gain-feedback trade-off is one of the most important aspects of the performance of OC hearing instruments. The gain of such instruments can be increased as long as the feedback margin is less than zero. An instrument with a 0 dB feedback margin will be unstable. An instrument with a high feedback margin will be stable, but may not provide a sufficient gain. Observe that the feedback margins illustrated in Figure 3 are 14 dB (low gain), 7 dB (medium gain) and 1.3 dB (high gain) at 2.8 kHz.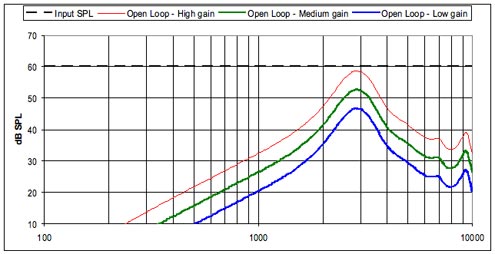
Figure 3. Sound pressure levels at the microphone inlet created by the outside sound source (black horizontal line) and by an open-loop feedback SPL for three different hearing aid gain settings (low, medium and high).
The simulated closed-loop responses of the OC instrument with feedback margins illustrated in Figure 3 are shown in Figure 4. The effects of the feed forward SPL are ignored and only the responses of amplified path SPL with feedback effects are shown.
The ripples shown in the response curves are caused by the summation of the input SPL and the feedback SPL shifted in time by the processing delay of the hearing aid circuit (3 ms delay was used for this example). Notice that the amplitude of ripples increase as the feedback margin becomes smaller. The feedback stability of the high gain setting (red) is low;a small increase of the gain will cause the instrument to start the feedback oscillation.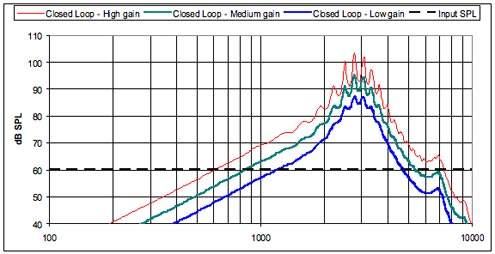
Figure 4. Simulated amplified path SPL with feedback effects: low gain (blue), medium gain (green) and high gain (red). The hearing instrument circuit delay is 3 ms. Feed forward SPL effects are ignored.
Feed forward SPL
OC instruments allow external sound energy to reach the eardrum directly through the holes in the dome. A simulated frequency response of the feed forward SPL in the ear simulator is shown in Figure 5 (red line). The feed forward SPL is very close to the input SPL at low frequencies, and rises to 15 dB at 3 kHz due to the increased impedance of the ear simulator. Feed forward SPL drops above 3.5 kHz due to the filtering effect of the acoustic inertia of air in the extended ear canal of the ear simulator.
Figure 5 also shows a simulated amplified path SPL without the feedback effects (blue line).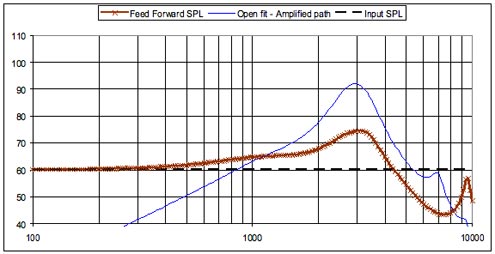
Figure 5. Simulated amplified path SPL (blue line) and feed forward SPL (red line) of the open ear instrument. The input SPL at the microphone is constant at 60 dB SPL (black dotted line).
The open coupler response includes a summation of the amplified path SPL with feedback effects and the feed forward SPL. At low frequencies (100 - 300 Hz) the open coupler response will be equal to the input SPL (60 dB SPL, as shown in Figure 5) At higher frequencies ripples appear due to the summation of the feed forward SPL and the amplified path SPL shifted in time by the processing delay of the hearing instrument circuit. The ripples will have maximum amplitude where the feed forward SPL and the amplified path SPL are equal.
Figure 6 shows simulated open coupler responses of an OC instrument with various gains and 3ms circuit delay on the ear simulator. In this example, both feedback SPL and feed forward SPL effects are accounted for. The instrument with the highest gain shows larger ripples at approximately 3 kHz than the instruments with low and medium gains. Further increasing the gain will cause the instrument to feed back at a frequency of one of the peaks in the 3 kHz region.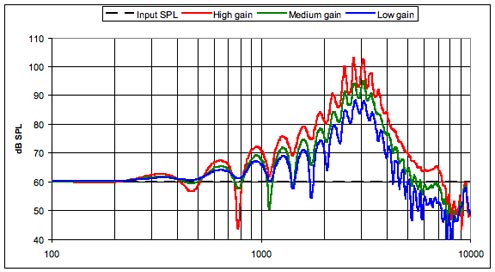
Figure 6. Simulated open coupler responses of an OC instrument with various gains and 3 ms circuit delay on the ear simulator.
A circuit with longer delay will create ripples with shorter frequency intervals between the neighboring peaks. Figure 7 shows a response of a high gain instrument with a constant delay of 6 ms. The red curve in Figure 6 was produced by a high gain circuit with a 3 ms delay. In comparing these two curves, it can be seen that ripples from the 6 ms circuit (Figure 7) have shorter frequency intervals between the neighboring peeks than the ripples from the 3 ms delay circuit (Figure 6).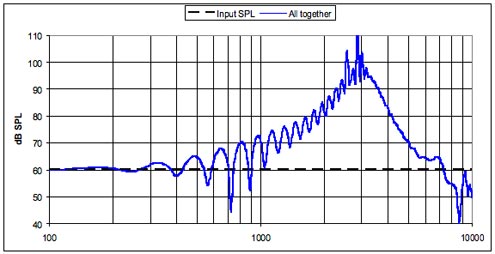
Figure 7. Simulated open coupler response of an OC instrument with high gain and 6 ms circuit delay.
Measuring the coupler response of OC instruments
When measuring the performance of traditional (non-OC) hearing instruments in a coupler, a closed coupler is used so that the acoustic output of the instrument is sealed to the measurement coupler or ear simulator (Martin, 2006;International Electrotechnical Commission, 2005;American National Standards Institute, 2003). In order to simulate in situ conditions as close as possible, however, it is necessary to measure the performance of OC instruments in a coupler an "open" manner. The existing tool for such measurements would be a real-ear simulator in accordance with IEC 711 (such as Bruel and Kjaer 4157 with an Extended Ear Simulator DB 2012, dB-100 Zwislocki coupler) or a specific open ear coupler (open ear coupler from Frye Electronics). An example is shown in Figure 8.
However, the following problems will occur with non-occluded coupler measurements:
- Summation of feed forward SPL and amplified path SPL results in an output frequency response with sharp notches (comb filter effect);
- Sound leaking from the non-occluded coupler or ear simulator may lead to acoustic feedback which in turn distorts the output signal (frequency response)
- Summation of the input SPL and the feedback SPL that depends on the orientation and placement of the coupler and hearing instrument relative to the sound source and processing delay of the circuit.
These measurement artifacts would reduce the reliability of the measurement, limiting the practical application. An example of this is shown in Figure 9, which is the actual measurement of an OC instrument for both the closed and open conditions. Note that this coupler test arrangement also can be used to measure the feed- forward SPL (hearing instrument turned off;green dashed line in Figure 9). Neither ripples nor feedback effects are expected during such test.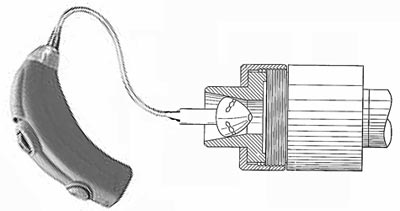
Figure 8. Ear Simulator 4157 with Ear Canal Extension DB 2012 setup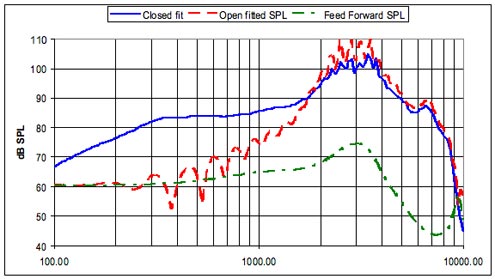
Figure 9. The same instrument measured in closed coupler (blue) and in open coupler (red). The green dashed line represents the feed-forward output (hearing aid muted for this measure).
A relatively simple modification of the test setup will allow to improve the consistency and repeatability of test results of OC instruments. An acoustic shield around the coupler, as illustrated in Figure 10, blocks the feed forward SPL and the feedback SPL and allows to measure the Amplified path SPL directly. After the canal tip is placed into the ear extension of the ear simulator, a putty seal closes off an aperture of the acoustic shield where the sound tube (or the receiver harness) passes through the opening of the acoustic shield towards the coupler. The hearing instrument assembled on the ear simulator with the acoustic shield is placed into the test chamber and tested. Sound absorbing material may optionally be provided inside the acoustic shield as shown on Figure 10 to avoid resonances in the enclosed space.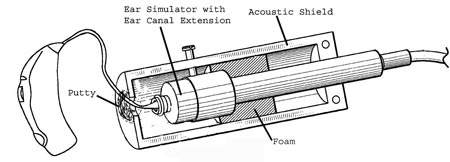
Figure10. Ear simulator with acoustic shield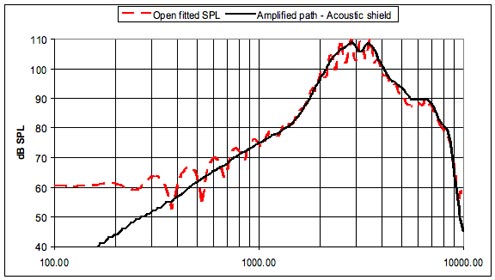
Figure11. The same instrument measured in open coupler (red response) and in the open coupler with using the acoustic shield modification (black response).
Figure 11 shows a measured response of the OC hearing instrument in a coupler without the acoustic shield compared to the response the acoustic shield modification. Advantages of using the acoustic shield for these measurements are:
- No summation of direct and processed sound, since the direct sound cannot leak through the canal tip into the coupler;
- Sound leaking from the canal tip cannot reach the hearing aid microphone, thus eliminating acoustic feedback problems
- Alignment of the coupler relative to the hearing aid and sound source and the processing delay of the circuit are no longer critical.
Practical application of the acoustic shield modification - case example
Using the acoustic shield modification for coupler measurements of open canal instruments has many practical applications. One such application would involve determining the effect of programming changes on the instrument's in situ response since the acoustic shield modification enables measurement of amplified gain (or SPL) directly.
For example, an audiologist may consider increasing low frequency gain in an open fitting to adjust for sound quality or loudness issues, or for a patient whose hearing loss has progressed to include the low frequencies. Since modern hearing aids provide for a wide range of gain adjustment at various frequency bands in multiple channels, it seems reasonable that an audiologist may attempt to use such an adjustment to compensate for reduced low frequency gain in open canal instruments. Typically, a hearing instrument fitted with a closed earmold will allow for the delivery of a substantial amount of sound energy into the occluded ear canal, therefore providing the required insertion gain for patients with significant hearing losses at low frequencies. However, an open canal instrument cannot do the same because a substantial portion of sound energy at low frequencies will leak out of the ear canal. While increased low frequency gain adjustments will yield very predictable in situ results when used in a conventional (occluded) fitting, the results in open canal instruments are not so predictable. Since the acoustic shield modification enables measurement of amplified gain (or SPL) directly, it demonstrates the potential pitfalls of attempts at low frequency correction with open canal instruments.
Figure 12 shows a simulated gain response of an open canal instrument in the ear. The open canal gain curve (solid brown line) shows an insertion gain at 400 Hz of approximately 5 dB. Let us assume that an audiologist wants to increase the insertion gain at 400 Hz by 10 dB by selective adjustment of the instrument gain in the fitting software. The resulting electrical gain increase of the hearing aid amplifier is shown on Figure 13.
The increased gain of the amplifier will cause the proportional gain increase of the amplified path (shown in Figure 14). But the resulting gain increase in the ear canal will be less than the electrical gain increase (or the gain increase of the amplified path), because it forms as a sum of the feed forward gain and the amplified gain. That is, the amplified gain at 400 Hz is almost the same as the feed forward gain (see Figure 12). Therefore, the 10 dB increase of the amplified gain results in less than 10 dB increase of the actual open canal gain. The actual gain will be about 6 dB, rather than 10 dB.
The resulting gain increase that is shown in Figure 15 (together with the electrical gain increase) would be even less at 200 Hz (only about 3 dB of gain) because the initial amplified gain at 200 Hz is -12 dB, it increases to -2 dB after adding the electrical correction. The summation of feed forward gain of 0.3 dB and the amplified gain of -2 dB results in 3 dB of open fitted gain (less than the electrical gain increase of 10 dB).
The consequences of boosting an electrical gain to compensate for a low insertion gain of open canal instruments at low frequencies include an increased current drain and high harmonic distortions. Given the lack of acoustic benefit (i.e. less increase in actual insertion gain as compared to electrical gain increase) as demonstrated in a coupler using the acoustic shield modification, we believe that low frequency gain corrections should be used with caution in open canal instruments. If a gain boost of 10 dB or more is required, it makes good clinical sense to consider using a more closed earmold, rather than maintaining the open fitting.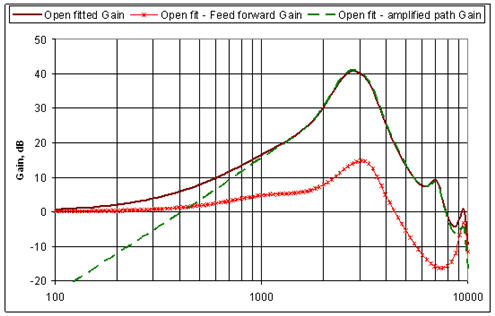
Figure12. Simulated responses of open canal instrument in the ear with 60 dB SPL input (circuit delay is ignored).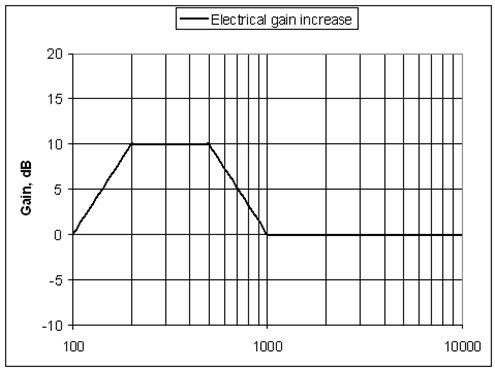
Figure13. Instrument gain increased by 10 dB between 200 and 500 Hz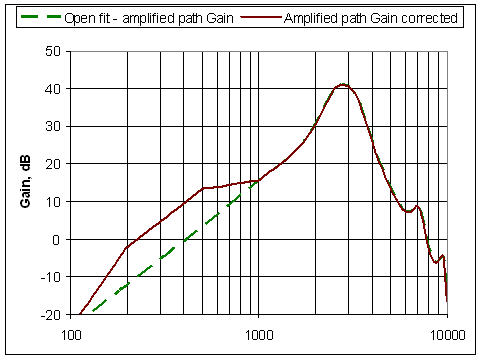
Figure14. Amplified path gain of an open canal instrument with and without electrical correction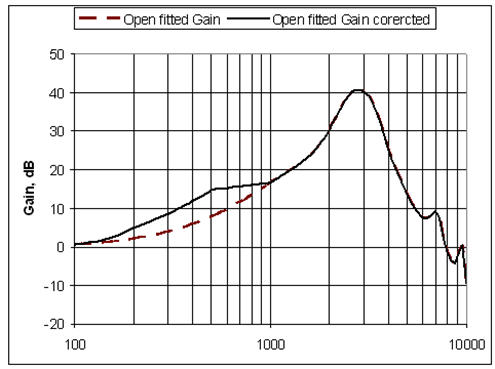
Figure15. Open fitted SPL of an open canal instrument with and without electrical correction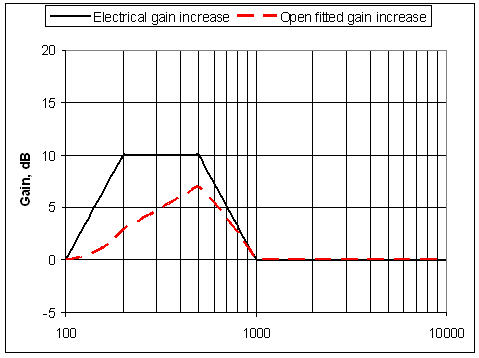
Figure16. Electrical gain increase and open fitted gain increase of an open canal instrument.
References
American National Standards Institute. (2003). ANSI S3.22-2003: Specification of hearing aid characteristics. Author.
International Electrotechnical Commission. (2005). IEC 60118-8 Ed. 2.0. Author.
Martin R.L. (2006). Introducing "open-ear" couplers for testing open-fitted hearing aids. Hearing Journal, 59(8), 48-49.
Mueller H.G., Ricketts, T.A. (2006). Open-canal fittings: Ten take-home tips. Hearing Journal, 59(11),24-39.
