
Learning Outcomes
After this course learners will be able to:
- Describe clearly the different methods manufacturers use to create a frequency lowering result.
- Identify when frequency lowering should be employed to enhance patient understanding of speech.
- Implement a step-by-step fitting procedure that programs frequency lowering for maximum patient benefit.
Introduction and Overview
It is my pleasure to share with you some of the latest research on frequency lowering clinical procedures and the operational capabilities of Audioscan equipment designed to implement those procedures. We'll begin with an overview of the concept of frequency lowering and when to employ it as a treatment strategy. Then, we'll review the various approaches hearing instrument manufacturers have created to deliver a frequency lowering result. Next, we'll define the goals and procedures that a clinician will want to follow when fitting and verifying frequency lowering technologies. Finally, we'll end with a discussion of the speech intelligibility index score as it relates to hearing instruments where frequency lowering has been engaged.
Frequency Lowering
First, we will begin by overviewing the concept of frequency lowering. Frequency lowering is the process of shifting a range of input frequencies into a different and lower range of output frequencies. Fundamentally, this is an amplification technique that distorts the input signal, but for some hearing losses, particularly high-frequency hearing losses, this induced distortion may, in fact, prove to be useful.
When to Use It
For some hearing losses, the high-frequency region of the audiogram may prove to be unaidable directly, yet there may be some important speech cues that fall within that unaidable region. In such circumstances, it may prove to be beneficial to shift the input energy in this unaidable frequency range to reside in a lower range of output frequencies -- frequencies that are aidable. In so doing, the important high-frequency speech cues would then produce an audible output result for the patient. With practice, the patient can come to recognize these altered speech cues as representative of the original high-frequency phonemes that were produced.
Figure 1 shows an example of a Real Ear Aided Response, or REAR, obtained within Audioscan's Speechmap® verification tool. This REAR was obtained in the presence of a 65 dB SPL average speech input signal. Notice that in the area circled in green, the aided output remains below the threshold line shown in red. This is a clear indication that for this fitting, audibility has not been restored for these frequencies when 65 dB SPL average speech is present. If audibility cannot be restored by adding additional gain within this frequency region (perhaps because of the bandwidth and/or gain limitations of the hearing aid being used) or if audibility cannot be restored by selecting a different hearing aid, then this might be a situation where frequency lowering could be employed in an attempt to make important speech cues in this frequency range, audible in a lower aidable frequency range.
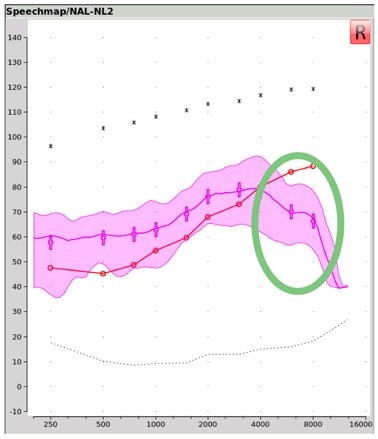
Figure 1. Real ear aided response (REAR) obtained with Audioscan's Speechmap verification tool.
Technological Approaches
There are several approaches that hearing instrument manufacturers have utilized to execute their frequency lowering function.
Approach #1: Frequency transposition. The first approach we'll describe is frequency transposition. In Figure 2, you are looking at a green line that represents the aided output across frequency. The faded area to the right of the dotted line labeled ‘Start Frequency’ represents that portion of this aided output that is inaudible, labeled as the ‘Unaidable Region’.
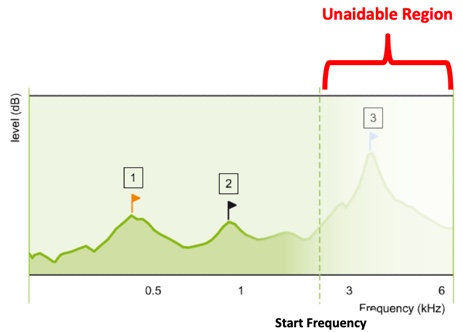
Figure 2. Aided output across frequency (from Nyffeler (2009), with permission).
In frequency transposition, the algorithm is designed to cut or copy a portion of this unaidable region and paste it within a lower frequency region that is aidable. We've labeled this region as the ‘Target Region’. As you can see in Figure 3, once frequency transposition has been employed, there are now two components of input energy occupying this output frequency space. One component is the transposed input energy, and the other component is the input energy that was in the target region, to begin with.
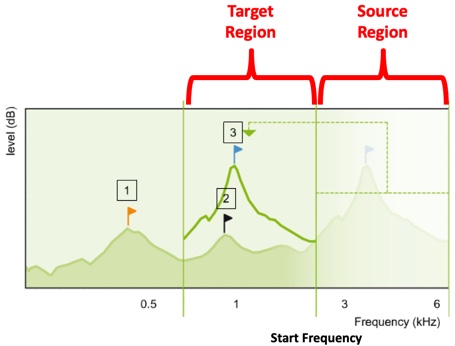
Figure 3. Frequency transposition approach (from Nyffeler (2009), with permission).
How might this frequency transposition effect appear in an electroacoustic measurement? Let's start with an input condition example. In Figure 4, we see the unaided, long-term average speech spectrum, or LTASS, for a 65 dB SPL calibrated speech input. In this case, the carrot passage. This represents the average input energy of normal conversational speech across frequency.
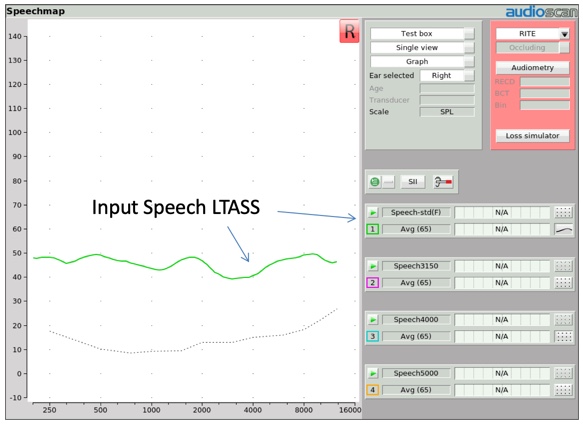
Figure 4. Long-term average speech spectrum (LTASS) for average (65 dB SPL) speech.
Several years ago, Audioscan created four altered versions of this LTASS to be used to verify frequency lowering technologies. In Figure 5, we show one of those altered input signals, labeled Speech 3150. When you compare the LTASS of this Speech-3150 input stimulus to the conventional LTASS of the carrot passage, you can see some distinctive differences. All of the one-third octave bands above 1000 Hz have been dramatically reduced in input amplitude, with the exception of one one-third octave band centered at 3150 Hz. This creates a stimulus environment that delivers a distinctive high frequency hump in the LTASS shape. This same effect can be produced with hump center frequencies at 4000, 5000, and 6300 Hz.
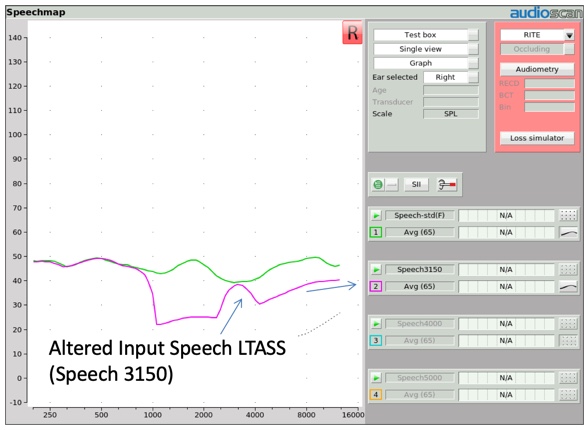
Figure 5. Altered input speech LTASS.
In Figure 6, a Speech-5000 input stimulus at 65 dB is delivered to a hearing aid without any frequency lowering activated. The input condition is represented in gold, and the aided output condition is represented in purple. Notice how the aided version of this distinctive input hump, centered at 5000 Hz, is reproduced as a distinctive output hump also at 5000 Hz.
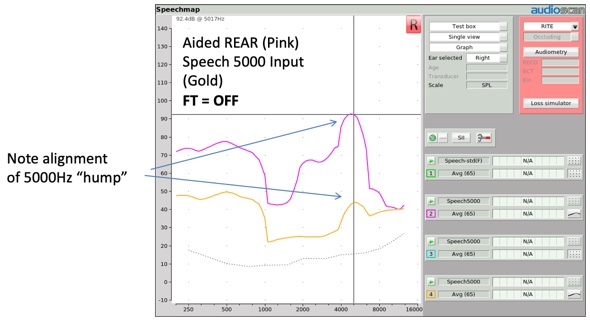
Figure 6. Alignment of Speech-5000 Hz "hump".
When this same input condition is presented to a hearing aid with frequency transposition activated (Figure 7), the aided high frequency hump should appear at a lower frequency. This shift in the center frequency of the aided hump is evidence that frequency transposition has taken place.
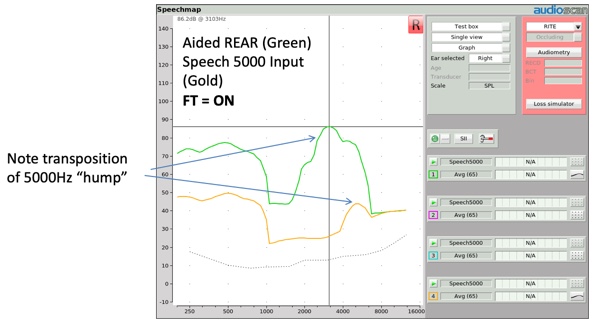
Figure 7. Transposition of Speech-5000 Hz "hump".
More recently, another input stimulus option has been added to the arsenal of frequency lowering input stimuli. It is a simulated version of the "S" phoneme of a female talker as determined from the ISTS (International Speech Test Signal) passage (Glista & Scollie, 2009). We will talk later about how this input stimulus (and its companion "SH" stimulus) was created and why. For now, Figure 8 shows what the "S" input stimulus looks like at a 65 dB SPL presentation level.
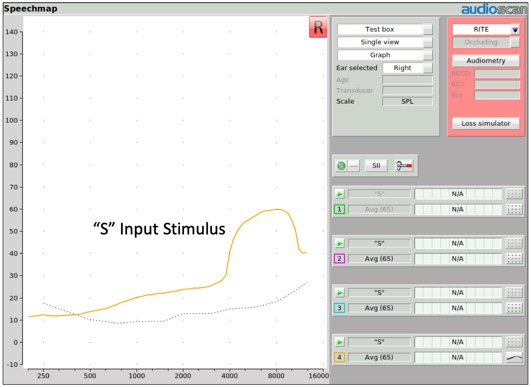
Figure 8. "S" input stimulus.
When you deliver the "S" stimulus to a hearing aid employing frequency transposition, you'll once again be able to expose a distinctive shift of this input hump to a lower frequency region (Figure 9). Thus several stimuli are available for you to use to verify the presence of frequency transposition.
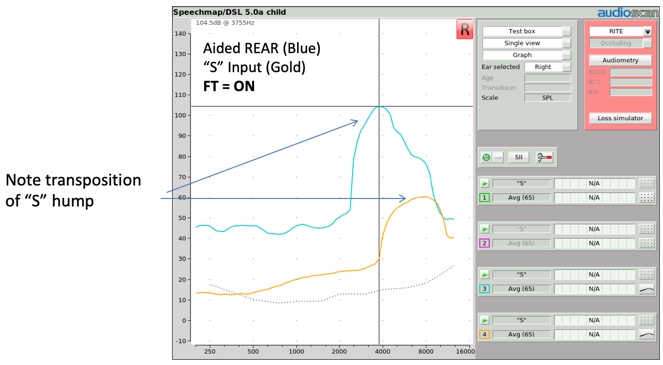
Figure 9. Transposition of "S" hump.
Frequency transposition technology can be found in Widex products, identified as "Audibility Extender" (which utilizes a cut and paste approach), and in Oticon products, identified as "Speech Rescue" (which utilizes a copy and paste approach).
Approach #2: Frequency compression. The second approach we will describe is frequency compression (Figure 10). In much the same fashion as amplitude compression decreases applied gain as input level increases above the input level knee point, frequency compression decreases the output frequency produced by the aid as the input frequency increases above the frequency compression knee point.
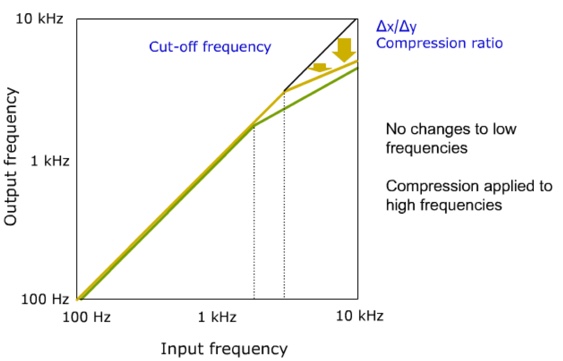
Figure 10. Frequency compression (from Nyffeler (2009), with permission).
Using the same image we used before to illustrate frequency transposition, Figure 11 shows a representation of output amplitude across frequency, with the faded area representing the unaidable region for this patient. The frequency compression knee point, identified here as the cutoff frequency, defines where the compression effect begins. Input frequencies below this cutoff are not compressed and frequencies above this cutoff are compressed. The magnitude of this compression is defined by the compression ratio deployed.
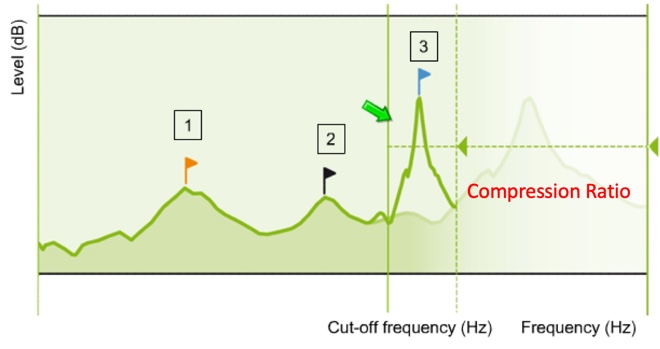
Figure 11. Representation of output amplitude across frequency (from Nyffeler (2009), with permission).
In Sound Recover 2, Phonak's latest version of their frequency compression technology, they have added an adaptive element to their frequency compression procedure. In Figure 12, CT 1 (the lower cutoff), represents the compression knee point that I described earlier. In Sound Recover 2, there is a second cutoff frequency, labeled here as CT 2, placed within the range of frequencies targeted for compression. Now all frequencies above CT 2 (above 8 kHz) are always compressed. However, for input frequencies between CT 1 and CT 2, frequency compression is adaptive. In other words, frequency compression won't be activated in this region unless there are relevant speech cues identified as present within this input bandwidth. Otherwise, this bandwidth will continue to be processed linearly.
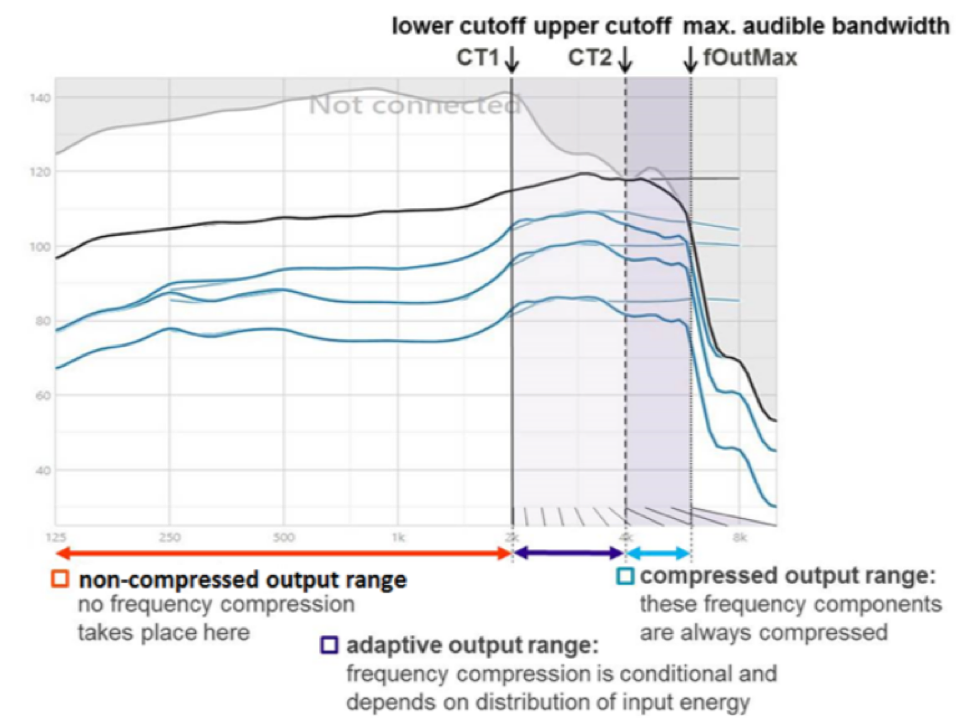
Figure 12. Adaptive frequency compression (from Phonak, with permission Jones (2019)).
When a hearing instrument with frequency compression activated is tested utilizing the "S" stimulus, two things should be observable in the resulting output measurement (Figure 13). First, as was the case with frequency transposition, the center frequency of the "S" stimulus should be located at a lower frequency than the center frequency of the input signal. Second, the output bandwidth of this input hump should look narrower, reflecting the fact that frequencies are being compressed into a narrower output bandwidth.
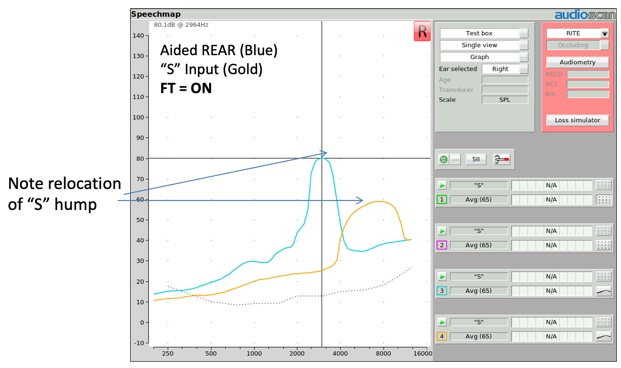
Figure 13. Relocation of "S" hump.
As mentioned earlier, frequency compression can be found in Phonak products and is identified as Sound Recover. Frequency compression can also be found in Sivanto Products (identified as FC) as well as in Unitron products.
Approach #3: Frequency Translation. The third approach we'll describe is frequency translation. To explain this approach, let's look at Figure 14. Imagine that this image is a representation of a hearing aid's bandwidth divided into six hearing aid channels. The higher channel numbers indicate higher frequencies.
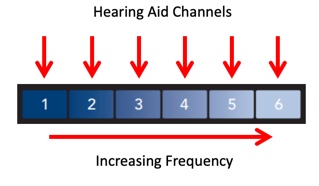
Figure 14. Hearing aid bandwidth divided into 6 channels (from Starkey, with permission Crukley (2019)).
Using the illustration in Figure 15, one could describe frequency transposition in this fashion. In this example, the 4, 5, and 6 bands have been transposed so that the input frequencies in band 4 reside in the same output band space as the input frequencies in band 3.
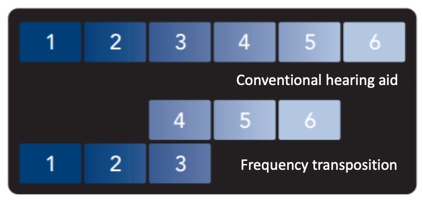
Figure 15. Illustration of frequency transposition (from Starkey, with permission Crukley (2019)).
Similarly, using the graphic in Figure 16, frequency compression could be depicted this way, with the knee point between the 3 and 4 bands and the compressed output bands depicted above the knee point.
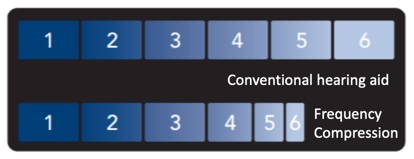
Figure 16. Illustration of frequency compression (from Starkey, with permission Crukley (2019)).
Using Figure 17 as the image reference, frequency translation can be depicted in this way. In this example, an "S" phoneme has been identified as part of the input content residing in band 6. Having identified the presence of this phoneme, if frequency translation is activated, it will create a supplemental representation of this phoneme in a lower band. In this case, the supplemental phoneme was placed in band 3. The original "S" input content is not removed from the output. Rather, it is supplemented with a lower frequency representation of that phoneme. If no speech phoneme is detected in an upper band, no frequency translation is activated.
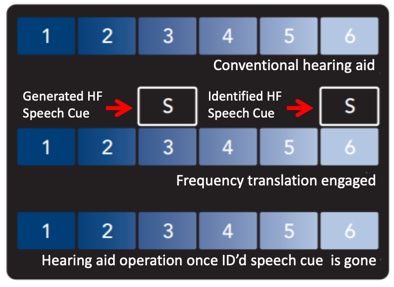
Figure 17. Illustration of frequency translation (from Starkey, with permission Crukley (2019)).
When a hearing instrument with frequency translation activated is tested using the "S" stimulus, the resulting output image will reflect two humps (Figure 18). The lower frequency hump is the "S" representation created by the circuitry, but the original "S" sound is also still present, as evidenced by the second hump aligning with the "S" input signal, although somewhat truncated by the bandwidth of the hearing aid's design itself.
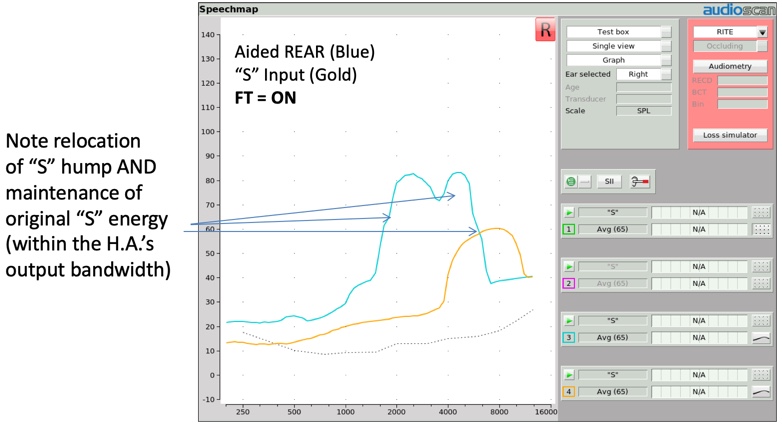
Figure 18. Relocation of "S" hump and maintenance of original "S" energy.
Frequency translation can be found in Starkey products and is identified as Spectral IQ.
Verification Protocol
Now that we've reviewed the various ways frequency lowering can be delivered through hearing aid technology, let's take a look at the clinical protocol that can be used to fit and verify that frequency lowering has been properly adjusted for a given patient's hearing condition.
Goals
There are two main goals of frequency lowering verification, which have been built into the clinical procedure that was developed at Western University (Scollie et al., 2016). The first goal of the frequency lowering clinical procedure is to define a methodology that you can use to objectively determine whether or not a given hearing loss or fitting condition should be augmented by activating frequency lowering (i.e., to determine whether a given patient is a candidate for frequency lowering to be used).
Second, if frequency lowering is to be used, the clinical procedure is designed to confirm that the settings of the frequency lowering procedure have been correctly adjusted to restore audibility for the missing target speech cues, and also to ensure that there is minimal impact on the original audible bandwidth. It's worth noting that this clinical procedure is also designed to achieve these goals regardless of the frequency lowering approach that's being used.
Stimulus Options
Since we're primarily interested in restoring the audibility of high frequency speech cues, it seems to make sense that we use test stimuli with appropriate high frequency content. Three approaches have been used over the years to accomplish this:
Live "S" and "SH" produced by the testing clinician. One approach is for the testing clinician to simply vocalize an "S" or an "SH" and use that input as the test stimulus. This approach has an advantage of using stimuli that actually represents the critical phonemes important for frequency lowering to audibly restore. It also easy to produce. However, the disadvantage of this approach is that the spectrum and the level of this form of stimulus production is not calibrated. Thus, their content can vary from one test to the next, as well as from one clinician to the next. As a result, this approach could confound test-retest reliability.
Audioscan "filtered" carrot passage. Another approach that you could utilize is the filtered carrot passage one-third octave hump stimuli that I described earlier (available within the Audioscan Speech signal menu). One advantage of using this approach is that it is calibrated and pre-stored in all of the test systems. In other words, the same stimulus condition can be present from one test to the next and from one clinician to the next. The disadvantage of this approach is that the filtered one-third octave bandwidth of the stimulus is actually narrower than the frication bandwidth of a naturally produced "S" or "SH" sound. In addition, these stimuli generate peak energy that corresponds with the LTASS level, not necessarily the peak level of an isolated phoneme, and certainly, peak energy would drive audibility as well. Thus, these stimuli may underestimate the actual audibility that's being delivered via frequency lowering for the phonemes we're targeting to make audible. As such, a hearing care professional might erroneously program a higher amount of frequency lowering effect than is truly necessary.
Calibrated and stored "S" and "SH" stimuli. A third approach is to use calibrated input signals representative of the "S" and "SH" phonemes. Using this approach would deliver a more representative bandwidth of these fricatives. This approach would also capture peak energy levels, key components that contribute to the audibility of these fricatives, and these stimuli could be stored in the test system for good test-retest reliability.
Method for Creating Calibrated Fricative Stimuli
To this end, Scollie and colleagues (2016) at Western University have worked to create two calibrated stimulus options for use when fitting frequency lowering devices. They have also designed the clinical procedure we will shortly be describing. These researchers started their new input stimulus procedure by extracting occurrences of the "S" and "SH" fricatives contained within the international speech test signal (ISTS). This signal is one of the calibrated speech passage choices available within the Speechmap stimulus menu and is used for Speechmap fitting purposes. The ISTS signal was built using multi-talkers that are female, where the primary energy “S’ and “SH” is higher in frequency than with male speakers. Once any residue from adjacent vowels was extracted from these excised fricatives, the result was then compared to other clinically produced fricative stimuli. This led to a solid definition of the frequency range and the energy levels of interest for each phoneme. Once those representative definitions were obtained, white noise was then shaped to fabricate these bandwidth and energy level components (Scollie et al., 2016).
Figure 19 shows the two input stimuli configurations. The pink curve is the "S" stimulus bandwidth and level, and the blue curve is the "SH" stimulus bandwidth and level in average conversational speech. Note that each stimulus captures overall energy level, specifically peak energy, an important component in the overall audibility of these particular phonemes.
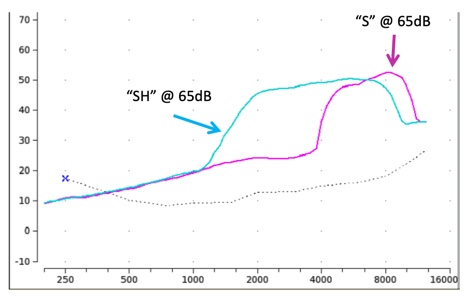
Figure 19. The "S" and "SH" input stimulus spectra.
Clinical Procedure
Next, let's take a look at the associated clinical procedure and how these stimuli are utilized within it.
Step One. The frequency lowering clinical procedure begins first by completing a conventional Speechmap verification fitting. The frequency lowering feature that may be present in the hearing aid being fitted needs to be turned off. Once the fitting is completed, you would then isolate the Real Ear Aided Response result that you obtained in the presence of 65 dB calibrated speech (Figure 20).
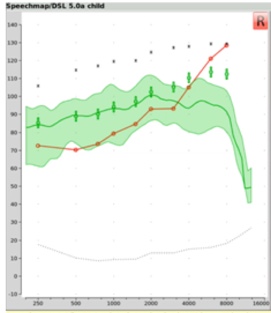
Figure 20. REAR result obtained in the presence of a 65 dB SPL average speech passage.
Step Two. Next, you'll want to determine if frequency lowering may be appropriate for this patient. To do this, you need to first turn off any noise reduction feature that the hearing instrument may have. The reason you need to do this is because the "S" signal may be interpreted by that noise reduction circuit as noise, and would thus potentially cause the device to start to reduce gain. By turning the noise reduction feature off, we eliminate the risk that any gain reduction associated with noise reduction would be activated. Then, you're going to need to conduct another test inside your Speechmap screen separate from the test that you've just completed, which includes the previous REAR for average conversational speech.
For the next step, we need to choose a test option other than Test 1. First, you would click on Test 3. Then, open up the stimulus menu. Select the "S" stimulus from the drop down menu that appears (Figure 21).
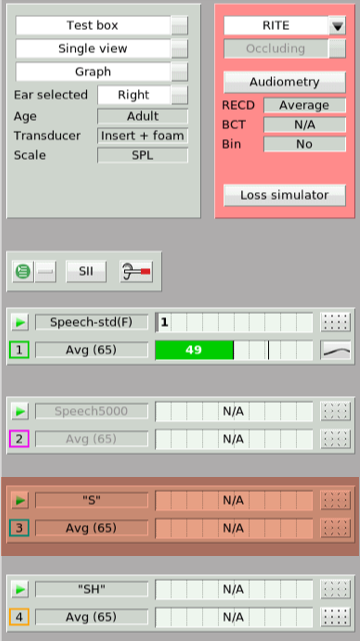
Figure 21. Test 3 ("S" stimulus).
Figure 22 shows the output result in the presence of that "S" signal (the blue line). There's no need to select an input level with this "S" stimulus as it's preset to be presented at 65 dB SPL. What we've produced is an aided "S" response on the Speechmap screen. You'll want to determine if the settings that are currently programmed into this hearing aid produce an audible "S" result. This stimulus is audible if some portion of the aided "S" result lands above the threshold line. In this particular example, none of the aided "S" result lands above the threshold line. Therefore, this phoneme is not audible with the hearing aid operating at its current settings.
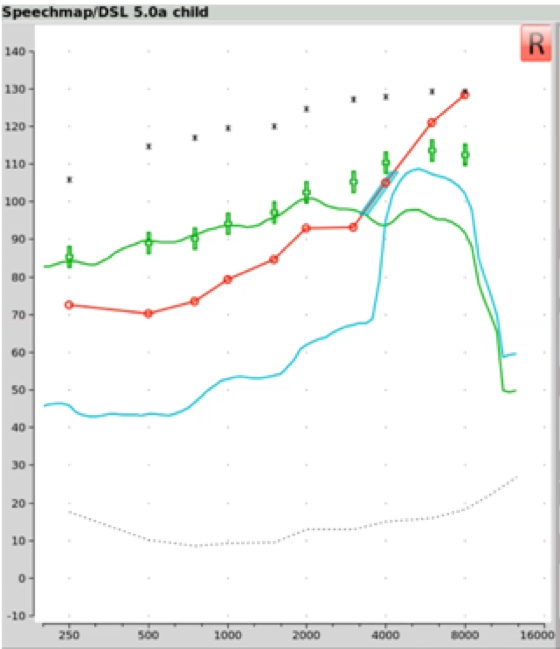
Figure 22. Output results in the presence of the "S" signal (blue line).
If the conventional methods of addressing this issue are not viable options for this particular patient (e.g., adding more gain to the existing hearing aid settings or switching to a different hearing aid), then you may need to activate frequency lowering to move the "S" stimulus into an aidable frequency region.
Step Three. If you're going to activate frequency lowering, then you must first identify the maximum audible output frequency (MAOF) range. The MAOF range is the range of frequencies that can be identified using as your starting point the previously measured 65 dB SPL REAR average speech banana. In Figure 23, the low-frequency end of the MAOF range is defined as the frequency where the aided long term average speech spectrum (LTASS) for an average speech input (the thick line in the middle of the green shaded area) first crosses back under threshold. The high frequency end of the MAOF range is defined as the frequency where the peak aided 99thpercentile line (the top line of the green shaded area) for an average speech input first crosses back under threshold. The range of frequencies between these two points is the MAOF range.
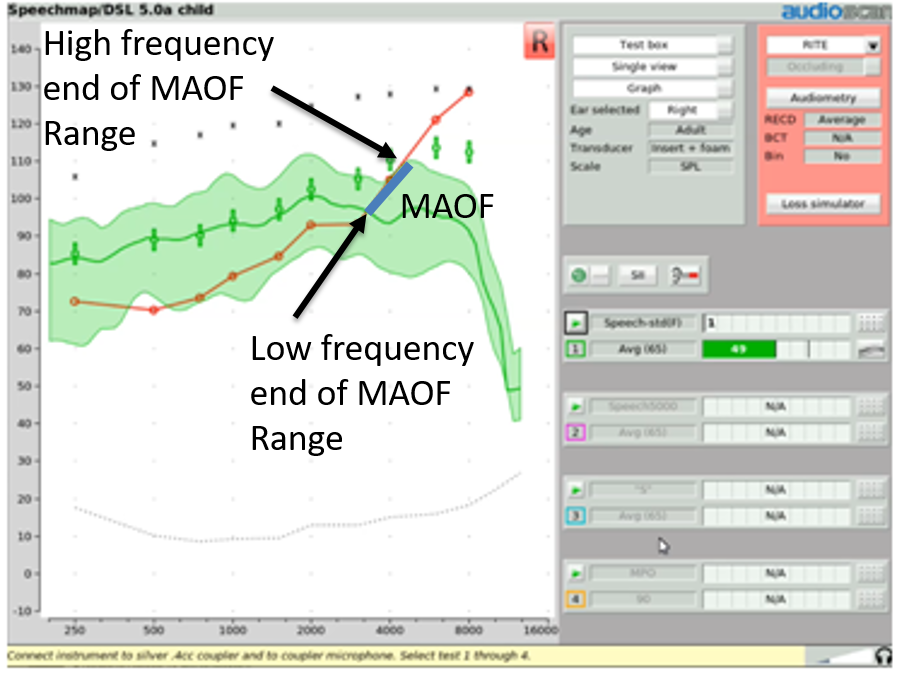
Figure 23. MAOF range.
With Audioscan equipment, rather than manually calculating the MAOF range, you can choose to activate an MAOF highlighter, which will calculate and graphically highlight the MAOF range directly on the Speechmap audiogram. To do this, start a test and select the "S" stimulus. From the stimulus poster that appears, open the “Show MAOF” menu. Select the test that contains a previously measured REAR for 65 dB SPL average speech (in our example, this is Test 1). This will produce a highlighted area on the SPL audiogram that represents the MAOF range for the fitting you are currently working with.
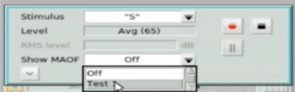
Figure 24. Activating MAOF highlighter.
Step Four. With the MAOF range now highlighted, you can begin the process of fitting the frequency lowering feature appropriately for your patient's hearing loss. We start by activating an "S" stimulus presentation at its default 65 dB SPL level and activate the MAOF highlighter. Then go into your fitting software and activate the frequency lowering feature at the default setting. If needed, you will adjust the provided frequency lowering controls until you get the hump of this "S" sound positioned so that the upper shoulder of that "S" lands inside of the MAOF range (Figure 25). Ideally, you'll want to get the downward side or upper shoulder of this aided "S" hump positioned as close to the high frequency end of the MAOF range as possible.
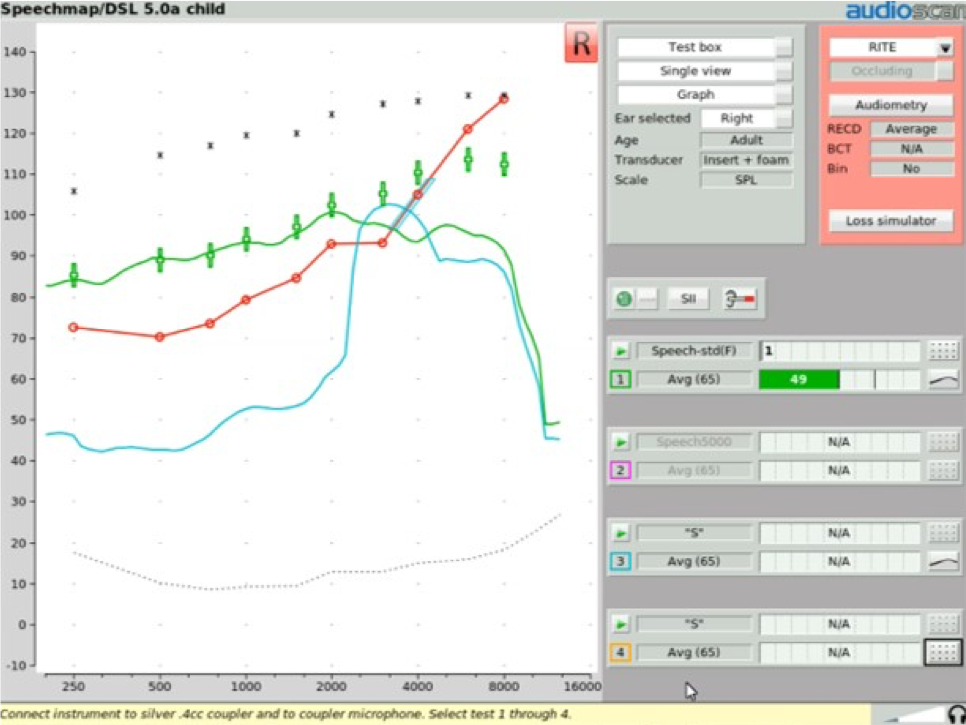
Figure 25. Fitting the frequency lowering feature for your patient.
Achieving this fitting goal will accomplish two things. First, it will move the "S" into the patient's aidable listening range. As you can see in Figure 25, there is now "S" energy above threshold, providing audibility of this phoneme for the patient. Second, this restoration of "S" audibility has been achieved with minimal interference with the original aided bandwidth. The frequency lowered output energy is not overwhelming the target region with transposed energy. That is, audibility of “S” has been restored with minimal impact on the audibility of the other sounds that would naturally be landing in this particular frequency region.
Step Five. Once the frequency lowering feature has been adjusted in this fashion to deliver audibility for the "S" stimulus, as an option, you may then want to activate another Speechmap test to determine the audibility of the "SH" stimulus. You would start the fourth test and in the stimulus menu, select "SH". At that point, you would see a gold Real Ear Aided Response image appear on the screen, which is the aided result in the presence of this "SH" input condition. There are a couple of things that you'll want to confirm when you get this result displayed up on your screen. First, you want to confirm that the "SH" sound also produces audible output. The next thing that you'll want to confirm is that the audibility signature of this "SH" stimulus is distinctively different than the audibility signature of the previously recorded "S" stimulus. In other words, these two sounds should sound distinctively different to the listener to the extent possible. This verifies that the "SH" is both audible and not going to be confused with the "S" sound. Again, it's worth noting that this fitting procedure is appropriate to use regardless of the frequency lowering technology that you may be employing.
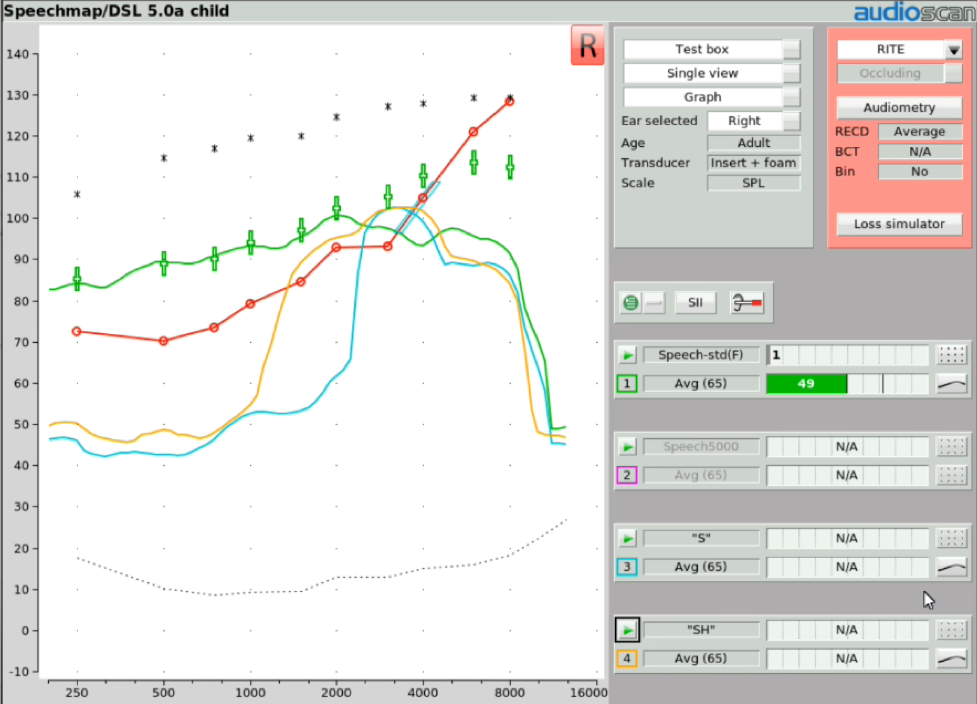
Figure 26. Determining the audibility of the "SH" stimulus.
Step Six. At this point, you have completed the objective procedures for fitting and verifying the frequency lowering function of the hearing instrument. As an additional step, you might consider doing your own subjective listening check. This can provide you with an understanding of the magnitude of change that frequency lowering has introduced. Verifit systems include a monitoring headset that allows you to listen to the output of the hearing instrument(s) that you are testing. The monitoring headset provided with Verifit2 allows you to listen to two hearing aids at the same time so you can determine how much sounds are altered by the frequency lowering procedure you just employed.
Step Seven. Now that the frequency lowering has been programmed, should you desire noise reduction for your patient, you should reactivate any noise reduction feature of the hearing instrument that you had turned off in order to complete this clinical procedure.
During the initial fitting and subsequent follow-up appointments, track the patient's opinions / comments about the hearing aid(s) performance and their utility delivering usable speech information. You can also document performance with outcome measures that can include aided speech discrimination tests in quiet and in noise. These outcome measures can help in defining whether these altered high frequency sounds are providing meaningful value and are contributing to the understanding and discrimination of speech content.
If there are other caregivers or therapists that may on occasion be in a situation where they might want to, for example, perform a hearing aid listening check, inform them that these devices are going to sound different than traditional hearing aids. That difference might be perceived by an uninformed listener as distortion. Caregivers need to understand that the distortion they may be hearing is intentionally present and is there for the purposes of assisting in making high frequency speech cues more available for the patient, given their hearing loss condition.
Frequency Lowering and the SII Score
Another subject in the frequency lowering area worth discussing is the speech intelligibility index score (SII). Clinicians have asked about how the SII score and its calculation interfaces with measurements made when frequency lowering is engaged. As such, it's worthwhile to review what the SII is and how it is incorporated into fittings where frequency lowering is involved.
What is SII?
The SII score is a way of quantifying the likely intelligibility of speech based on the proportion of speech cues that are audible. The simplest way to understand how the SII score is determined is to reference it back to the old count-the-dots method that Mead Killion and Gus Mueller devised twenty years ago and subsequently updated in 2010. Figure 27 shows an unaided speech banana comprised of a series of dots. This is an dB HL scaled graphic, so any of the dots that are below the threshold line (the diagonal thick line or the dotted line) would be counted as audible. The number of dots in each bandwidth represents the importance of that bandwidth in terms of intelligibility. Any of the dots that are above the line are not counted because they're not audible. Clearly, the more dots that are placed into the patient's aidable listening range, the higher the speech intelligibility index score is going to be.
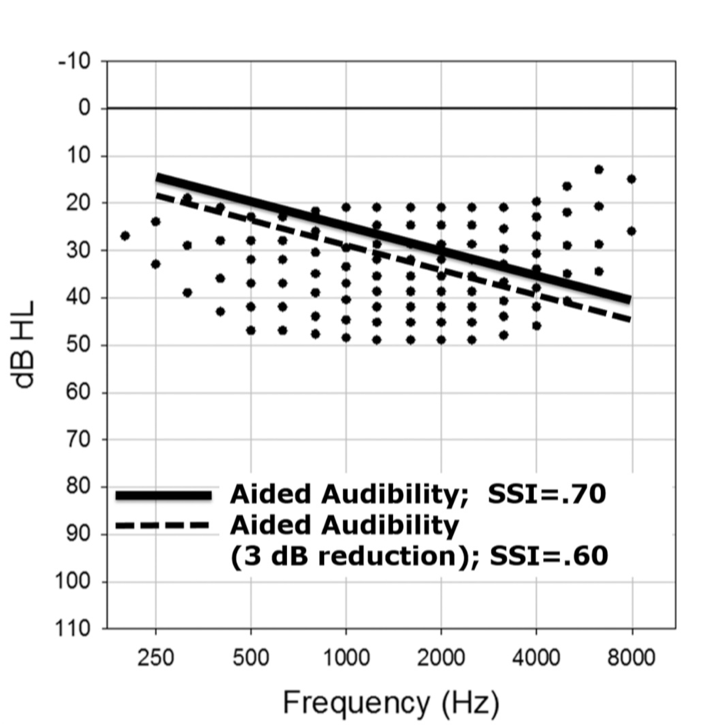
Figure 27. Count-the-dots method (Killion & Mueller, 2010).
Aided and Unaided SII Inside of Speechmap
Within the Speechmap display screen, the unaided and aided SII scores appear as Audibars for each of the tests that you may be doing (Figure 28). For Test 1, Test 2, Test 3, and Test 4, there are a series of bars for the left hearing instrument and another set of bars for the right hearing instrument, that represent the unaided (which is in gray for the input level that's being tested) and the aided SII result as well. In this example of Test 2, where the input level is 65 dB and the unaided SII is 28, the aided speech banana (represented by this pink shaded area and all of the dots that are above threshold here being counted) shows an SII score of 73. You can very quickly and easily visualize and quantify the SII score in the aided condition when you're doing a Speechmap test that utilizes the calibrated speech input stimulus designed for completing this test.
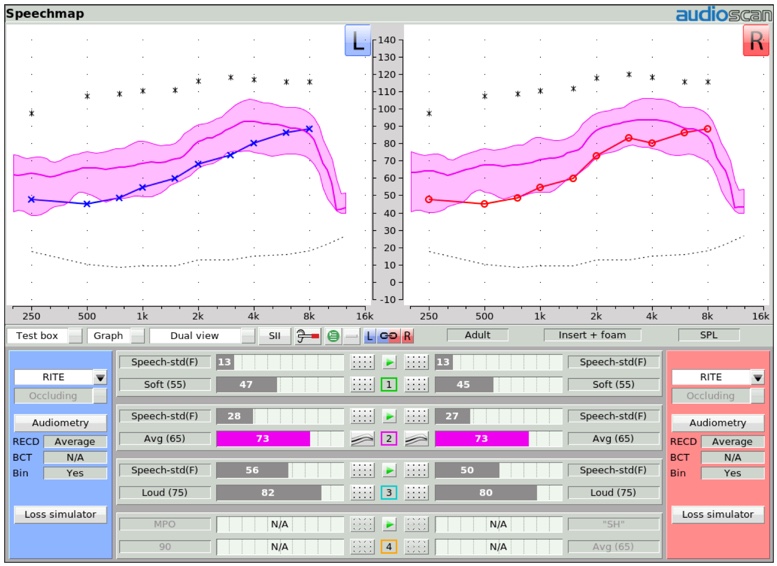
Figure 28. Speechmap display screen of unaided and aided SII scores.
"S" and "SH" Stimulus
Figure 29 shows a depiction of the Speechmap test menu screen. As you can see, when an “S” or “SH” stimulus is selected, no associated SII calculation is displayed. The bars on that test result screen will show "N/A". The main reason for this is because these stimuli do not produce an aided broadband speech result (which is what the SII calculation is designed to quantify), but rather the result for an isolated phoneme that has additionally been "altered" by the frequency lowering process that was engaged. As such, the SII number is not displayed when "S" or "SH" are selected.
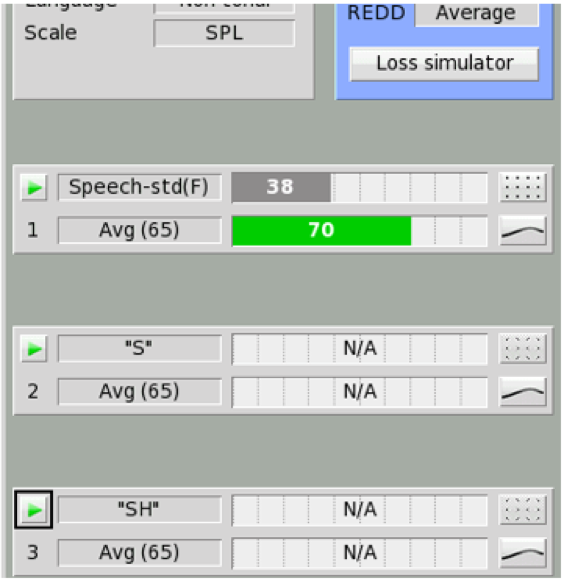
Figure 29. SII calculation approach for average speech and “S”, “SH” input test signals.
SHARP Audibility Estimates with Nonlinear Frequency Compression
One attempt to quantify the impact frequency lowering may have on SII has been pursued by the researchers at Boystown National Research Hospital. These researchers developed the Situational Hearing Aid Response Profile (SHARP), a tool that can be used to estimate likely SII for various listening conditions a child may encounter using hearing aid devices programmed in a certain way.
More recently, these researchers have added an SII predictor to this tool that estimates the improvement in SII that can be associated with the activation of frequency compression. To give you an idea of how this works, in Figure 30, you see a depiction of the SHARP display screen that is displaying the aided Speechmap result for a 65 dB speech passage. You will notice that there is a “Dot” placed at each one-third octave increment of the LTASS line in the middle of this blue area. Each dot is assigned the SII “dots” value for each of these one-third octave frequency range segments. Since not all of the SII dots are audible, the SII score is not 100. In this case, the aided SII score is predicted to be 77.
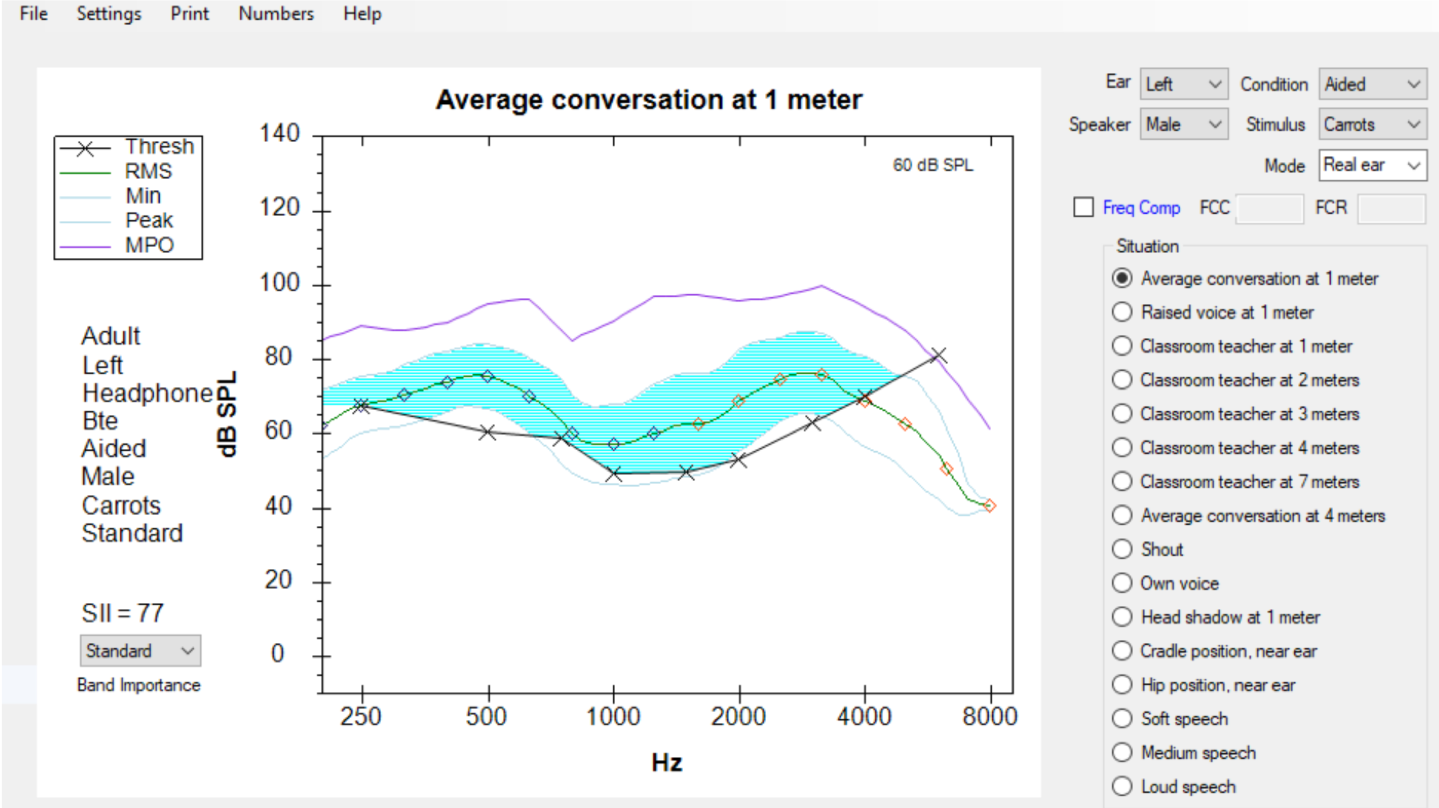
Figure 30. Conventional SHARP display.
Also, notice in Figure 30 that just above the list of listening situations that can be represented by this SHARP display is a Frequency Compression box. When this box is checked, and the subsequent compression knee point and ratio are entered, this tool can be used to predict how this form of frequency lowering may affect the aided SII score.
In the display shown in Figure 31, the frequency compression tool has been turned on. The knee point is identified as 2000 Hz, and the compression ratio is identified as 2.0. With this assignment, the display now "squeezes" more SII dots into the blue audible area, thus increasing the predicted SII score from 77 to 90. Clinical comparisons between this prediction of SII and the subsequent measurements of the aided SII score on individuals indicate that this tool is a reasonably valid predictor of the impact on SII this form of frequency lowering could provide.
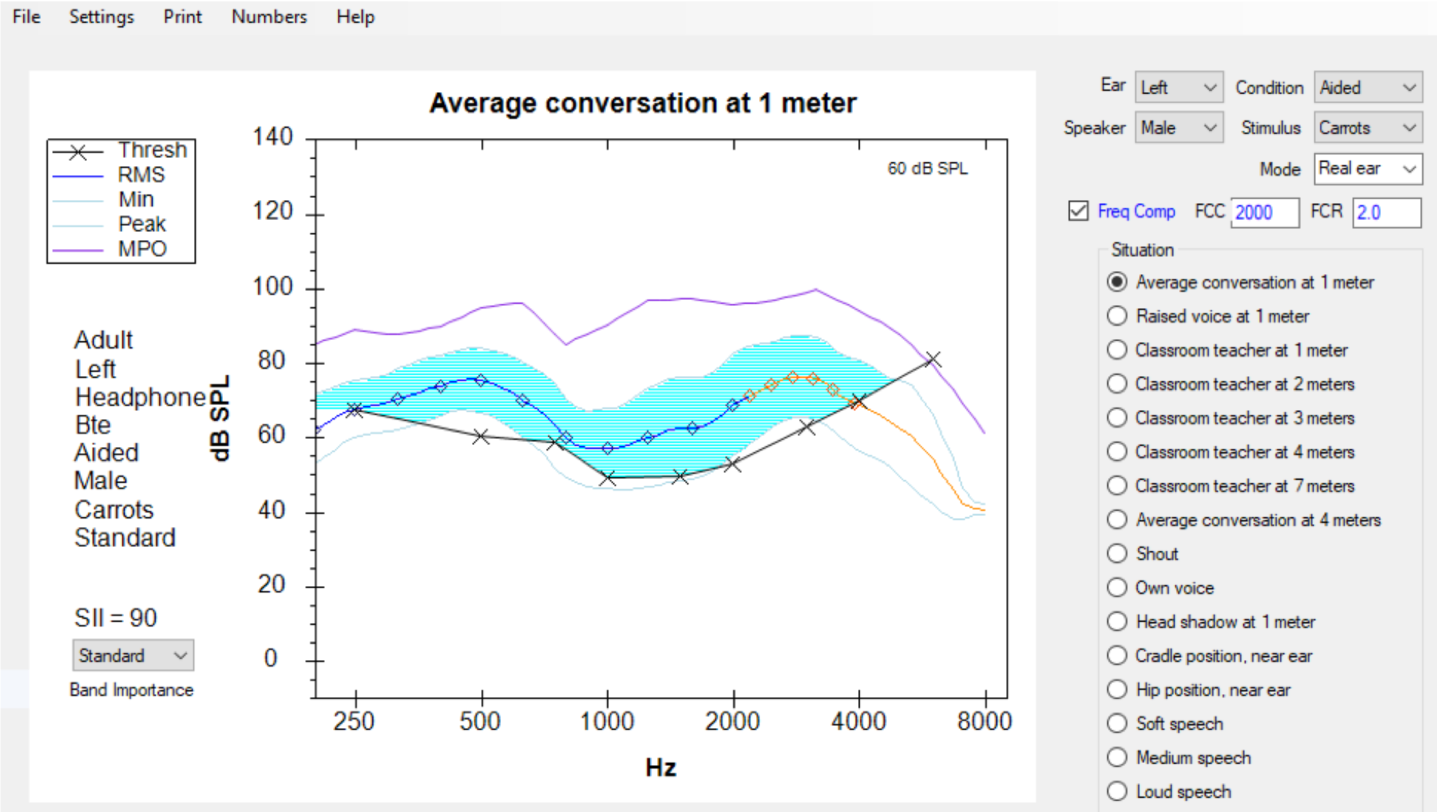
Figure 31. SHARP display with "Frequency Compression" selected.
It's important to underscore that this tool is only valid for use with frequency compression technologies. Speechmap data that has been obtained with the Verifit system, once stored electronically, can be directly downloaded into this SHARP tool. Clinicians may find this to be a valuable tool, not only to provide clinicians with information regarding how a particular hearing aid fitting will impact speech intelligibility in various listening conditions, but also to predict the impact that frequency compression can have on improving or enhancing the SII score.
Summary and Conclusion
In summary, we have explained that frequency lowering is a hearing instrument processing feature that can be utilized to restore audibility for speech sounds that may fall outside of a patient's aidable frequency range. Several technologies have been developed by hearing instrument manufacturers to deliver a frequency lowering effect. These include:
- Frequency transposition
- Frequency compression
- Frequency translation
Audioscan's verification systems can be used to:
- Objectively determine frequency lowering candidacy
- Adjust frequency lowering settings to restore audibility for important speech cues with minimal interference with the existing aided bandwidth
- Verify sound quality and distinctiveness (through the monitoring headsets)
- Aid in counseling
If you're interested in exploring additional information about frequency lowering verification with Audioscan equipment, you're invited to visit the education section of the Audioscan website, which can be found at audioscan.com. Also, you will find detailed operational information within the User's Manual, which is electronically embedded with the online help feature of Audioscan equipment.
References
Brennan, M., & McCreery, R. (2014). SHARP updates enable audibility estimates with nonlinear frequency compression. The Hearing Journal, 67(3), 14-16.
Galster, J. A., Valentine, S., Dundas, J. A., & Fitz, K. (2011). Spectral iQ: Audibly improving access to high-frequency sounds. Eden Prairie, MN: White paper, Starkey Laboratories Inc.
Glista, D., & Scollie, S. (2009). Modified verification approaches for frequency lowering devices. AudiologyOnline, Article 871. Retrieved from www.audiologyonline.com
Killion, M. & Mueller, H. (2010) Twenty years later: A NEW Count-The-Dots method. Hearing Journal, 63(1):10-17.
Nyffeler, M. (2009) Speech Study Coordinator, Phonak Hearing Instruments, Switzerland, Phonak Virtual Audiology Conference.
Scollie, S., Glista, D., Seto, J., Dunn, A., Schuett, B., Hawkins, M., Pourmand, N., & Parsa, V. (2016). Fitting Frequency-Lowering Signal Processing Applying the American Academy of Audiology Pediatric Amplification Guideline: Updates and Protocols. Journal of the American Academy of Audiology, 27(3): 219-236.
Citation
Smriga, D. (2019). Frequency lowering fitting and verification. AudiologyOnline, Article 25644. Retrieved from https://www.audiologyonline.com