
Editor’s note: This text course is an edited transcript of an Otometrics/Audiology Systems webinar on AudiologyOnline. Download the course handout.
Learning Objectives
After this course, the participant will be able to:
- Describe the features and benefits of FRESH noise.
- Discuss the inherent problems using narrowband noise in the sound field as a test stimulus.
- Explain how to make informed decisions regarding test protocols and stimuli selection for pediatrics when tested in the sound field in both the unaided or aided conditions.
Introduction
Keeley Moore: FRESH noise, or frequency-specific hearing assessment noise, is a narrowband noise (NBN) stimulus designed for the purpose of measuring hearing thresholds. It is frequency specific due to extremely steep filter slopes. Because of these steeply sloping filters slopes, the stimulus does not spread beyond the desired frequency range. In addition to being frequency specific, it is appropriate for threshold testing because it is calibrated in dB HL, unlike narrowband noise.
FRESH noise came about because of the realization that narrowband noise was being used as a stimulus for testing. Studies show that when you test threshold levels with different stimuli, you find approximately the same threshold results with pure tones, frequency modulated tones, and FRESH noise. However, with narrowband noise, threshold values not consistent with thresholds obtained with the other stimuli. This obviously leads to errors in testing. Narrowband noise was originally designed not as a testing stimuli but as a masking noise, in order to address the challenge of how to go about testing an individual ear.
In the 1800s, Robert Barany recognized the need to mask out the sounds entering one ear when testing the opposite ear. He understood that there was the potential of the non-test ear hearing the signal being presented to the test ear when it crossed over the head. Barany created the Barany Box. It was similar to a wind-up toy. The Barany box was placed into the hearing ear and it created an extremely loud buzzing sound. The examiner shouted into the deaf ear to determine if the patient could hear anything over the buzzing noise. The problem was that it was about 110 dB. If you weren't hearing-impaired before using the Barany box, chances are you could be afterwards.
In the 1950s, the advantage of masking with narrowband noise over wide band noise was recognized. Masking efficiency refers to the relation between a sound’s ability to mask and its loudness. A sound with a high masking efficiency is one with good masking ability but with minimal loudness. We know that more energy is needed in a masking stimulus to mask a tone of the same intensity. We want to cover up the tone, so the narrowband noise needs to be a little bit louder than that tone. Effective Masking Level (EML) is the difference in decibels between the level of a tone and the level of a noise that masks that tone. This increase, or correction factor, is built into the audiometer's calibration in the masking channel. This correction factor is called the minimal effective masking correction (MEMC). MEMC is the correction that must be added to a tone’s levels to arrive at a minimal noise level that will effectively mask that tone. This definition comes from Dr. Stanley Gelfand.
The ANSI Standards for Audiometers includes the Effective Masking Noise Levels that are built into the audiometer’s masking channel calibration. When you choose narrowband noise in the audiometer, it is displayed in the dBEM, or dB effective masking level, not in dBHL (hearing level). Therefore, the narrowband noise from your audiometer is intended to mask a signal. It was never intended to be a stimulus for determining a threshold.
For example, let’s say you set up your audiometer to present a tone at 50 dB at 1000 Hz, and then select narrowband noise to mask that tone. The output of the tone will be 50 dBHL, but the output of the masking will be 56 dBEM (effective masking level). That's because 6 dB of effective masking has been added to the narrowband noise masking channel, in order to cover up the 50 dB HL signal. You can now see that if you're using narrowband noise as your test signal for obtaining thresholds, you will be obtaining better thresholds or in other words, underestimating the hearing loss. Also, the error produced can be substantial, especially with a steeply sloping hearing loss
Dillon and Walker (1982) did some research on stimuli for audiometric testing, and found that pure tones caused standing waves in the soundfield. Pure tones show sound intensity variations in the test booth, so the intensity of the signal reaching the subject will vary depending on exactly where the subject is located.
Because of these issues, we found that we could not use pure tones as a stimulus for threshold testing in the soundfield. Therefore, we started using warble tones, which can vary the pitch by 5% and 5 Hz, but remain fairly accurate in terms of measuring equivalent thresholds as pure tones. We know that narrowband and broadband noise can provide inaccurate results, and even more so with sloping hearing losses (Walker, Dillon and Byrne, 1984).
There is additional research that supports the finding that narrowband noise is not an effective stimulus to use for threshold testing (Orchik & Mosher, 1975; Orchik & Rintelmann, 1978; Stephens & Rintelmann, 1978). In summary, we are not getting true thresholds if we are using narrowband noise as a stimulus.
How Did NBN Come to be Used as a Stimulus?
It was discovered early on that children responded very quickly to narrowband noise. However, NBN only provides a loose estimation of a child's hearing ability and only with a flat hearing loss. If there is more of a slope to the hearing loss, the more inaccurate we are likely to be. We began testing children in sound field with narrowband noise, and then eventually these popular stimuli made their way into testing pediatrics under headphones and inserts. We know that results using narrowband noise for the most part are not going to be equivalent to other stimuli. There is a disconnect between what we know and what we have practiced. We know that narrowband noise was intended to be an effective masking noise. It has effective masking noise built into the calibration. It was intended to cover up a stimulus -- it was never intended to be a stimulus.
Figure 1 demonstrates the difference between a pure tone, FRESH noise, and narrowband noise for threshold testing. Let’s assume the patient we are testing has the audiogram as shown in the figure, with a true threshold of 50 dB HL at 2 kHz. If we present a 2 kHz pure tone at 50 dBHL (left panel), we are testing only 2 kHz. If this is the softest point the patient can hear, we mark that as the threshold.
In the second panel, you see the same frequency tested using FRESH noise. We are still testing a fairly narrow band. We can feel confident that if this is the lowest level the patient can hear, it is the true threshold.
In the panel on the far right is the narrowband noise at 50 dB HL at 2000 Hz. You can see it has a much, much wider band. The patient will hear the NBN where it has spilled over into the audible range, that is, where the audiogram is better in the lower frequencies (marked with a blue circle in Figure 1). We will mark a threshold for 2 kHz that is better than the true threshold of 50 dBHL. In this way, we are underestimating hearing loss, and overestimating hearing sensitivity. With a flat hearing loss, it is not as much of an issue. A narrowband noise stimulus will remain within the inaudible range across all frequencies. The more slope the hearing loss has, the more inaccurate we're likely to be when we're using a narrowband noise stimulus for threshold testing.
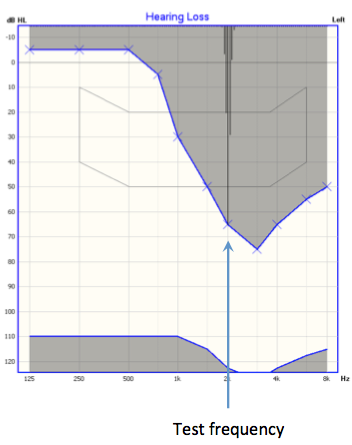
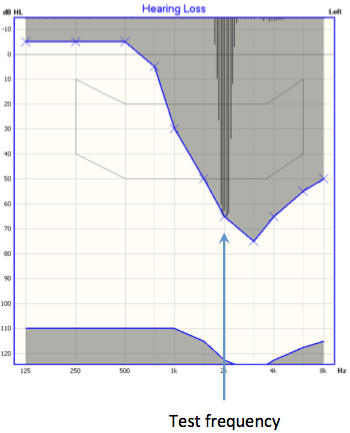
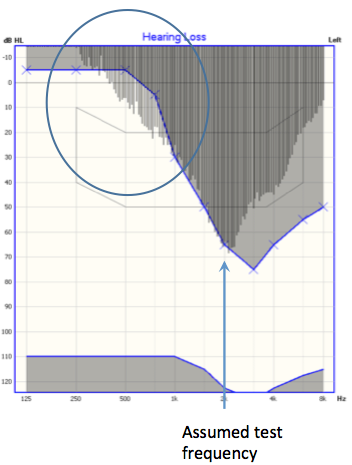
Figure 1. Presentation of a 2000 Hz stimulus using the OTOsuite Hearing Loss Simulator: pure tone (left panel), FRESH noise (middle panel), and narrowband noise (right panel).
FRESH Noise
FRESH noise is based on research by Walker, Dillon and Byrne (1984) that pinpointed the recommended bandwidths of stimuli for use in sound field audiometry. They defined the maximum bandwidths and deviations that could be used for various stimuli while still obtaining accurate results.
FRESH noise is available in the Astera and it is now available in the Aurical as well. Within the Classic Mode, under the Channel Settings options, FRESH noise is available under the stimulus category, along with pure tones and warble tones (Figure 2). All of these will yield equivalent results. Narrowband a masking sound option, as it should be. The Sunshine panel is available when using a touchscreen.
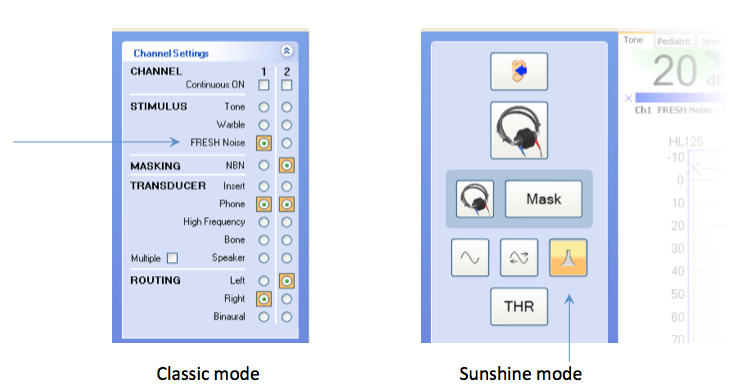
Figure 2. FRESH noise in the Astera control panels.
A graphical representation of how wide narrowband noise is shown in Figure 3. You can see the tip of NBN is narrow, but the tail is very wide. When used as a test stimulus it would be spilling over into other frequencies. Warble tones varies a little, by about 5 Hz, but we are still within our test frequency. FRESH noise follows within that as well.
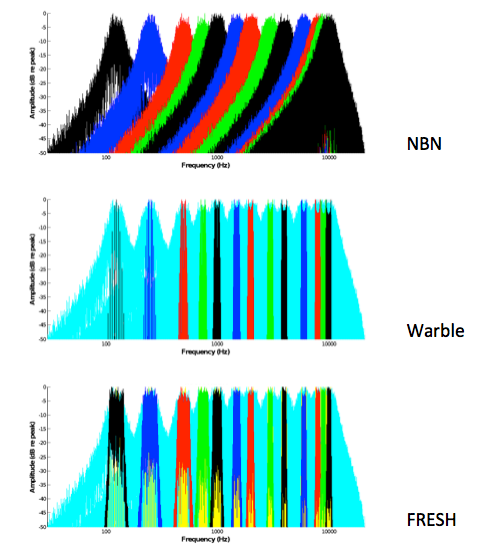
Figure 3. Comparison of the bandwidths of NBN, Warble and FRESH noise.
Sound Samples
The following sound samples enable you to hear and compare what these signals sound like.

Narrowband noise at 500 Hz.
FRESH noise at 500 Hz.
With FRESH noise, we're still testing 500 Hz, but we don't have nearly that spread of sound.
Narrowband noise at 1000 Hz.
The FRESH noise at 1000 Hz.
FRESH noise sounds more hollow. It's very frequency specific. It's not going to create off-frequency listening like narrowband noise.
We did a pilot study with a subject with high frequency hearing loss. First, we obtained an audiogram with pure tones as the test stimulus. Then, using the same ear in the same test subject, we obtained an audiogram with FRESH noise as the test stimulus. The two audiograms were within test-retest reliability; they were very consistent with each other. Then, using the same ear and same test subject, we obtained an audiogram with narrowband noise as the test stimulus. We found quite a bit of difference as compared to the other two audiograms. Narrowband noise underestimated the thresholds. You will find these results in your handout.
What consequence does this have? If you look at the audiogram for this ears obtained using a narrowband noise stimulus, and compare it side-by-side with the true audiogram obtained using pure tone thresholds, you can see the difference is significant (Figure 4). Obviously we're underestimating the hearing loss, but how does that translate to our fitting?
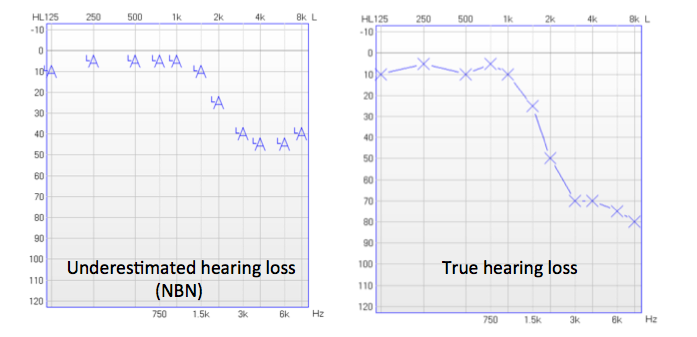
Figure 4. Thresholds obtained with narrowband noise stimulus (left) and with pure tone stimulus (right) for the same ear.
If we plug these thresholds into our software to calculate DSL5 prescriptive fitting targets, we see that the targets for both of these audiograms are very different (Figure 5). What would be considered a good fitting in terms of matching DSL5 targets would be very different for both of these audiograms.
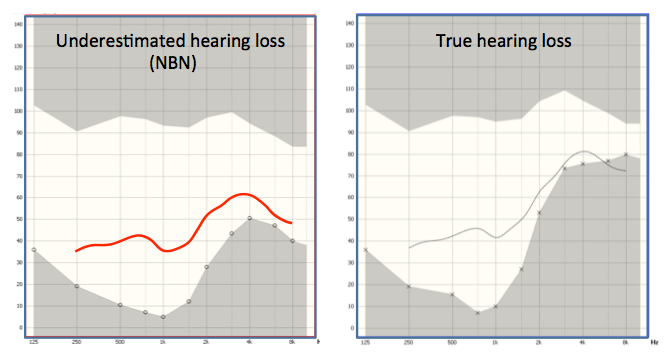
Figure 5. DSL5 targets for audiogram obtained with narrowband noise stimulus which underestimated the true hearing thresholds (left), and for the true hearing loss (right) for the same ear.
Research Study
At this time, I will turn the webinar over to Dr. Dawn Violetto to present research she has conducted on this topic.
Dr. Dawn Violetto: Thank you, Keeley. I am the Director of Audiology at Child’s Voice, which is the listening and spoken language program for children with hearing loss in Illinois. I work with children who have hearing aids, and many who use cochlear implants (CIs). We do a lot of sound field testing in the aided condition for children with CIs. For children with hearing aids, we use real ear testing, but sometimes we use aided testing as a cross check for real ear testing.
Based on Keeley's presentation, we know that we should be using warble pure tones (WPTs) in the unaided condition and also in the aided condition. However, we also know that kids pay better attention to a noise stimulus in the sound field. We also saw that the hearing loss could be underestimated using narrowband noise in the sound field in the unaided condition. We were curious to see if this would carry over into the aided condition.
I wanted to conduct a formal investigation. In the aided condition, I wanted to know if warbled pure tones and FRESH noise produced the same results. In other words, are they interchangeable as a stimulus? At the same time, I also wanted to see if we were getting better thresholds (overestimation of hearing sensitivity) with narrowband noise.
This is important to me because the best way to verify that children with cochlear implants have access to all speech sounds with their implants is to use sound field aided testing. We need to be as accurate as possible. We use sound field testing to verify that the maps of the implants are valid. Given that we're a listening and spoken language program, it is absolutely imperative for us to ensure that these children have access to all soft speech sounds in order to learn language.
I had seen some disparaging results with narrowband noise testing and warble pure tones. My hypothesis was that narrowband noise was going to overestimate aided thresholds compared to warble pure tones and FRESH noise.
One of the implications was the possibility of underestimating thresholds in the unaided condition. Let me provide you with one possible scenario. You test hearing in the unaided condition with narrowband noise. Potentially, you are going to underestimate a sloping hearing loss. Then, you're improperly diagnosing the degree and slope of the hearing loss. Now you're going to take that unaided audiogram and you're going to fit hearing aids based off of inaccurate narrowband noise thresholds. You will likely be under-fitting the hearing loss. I hope that you would use real-ear or Real-Ear-to-Coupler-Difference (RECD), but as we know some kids don't allow us to do that. Sometimes you do have to use aided testing in the sound field as verification of your fitting. Then, if you use the narrowband noise as an aided detection sound source, you're going to overestimate where the aided thresholds are. You're underestimating in the unaided condition, and my assumption was that you would then be overestimating in the aided condition. Their aided detection is going to be poor and then it's going to impact their speech and language development, because they don't have access to all speech sounds.
Very often, when we do our intake testing at the clinic, we find that the childrens’ thresholds are much worse in the high frequencies than were predicted. Then we reprogram the hearing aids based on real-ear measurements with the new thresholds. We put them in the booth again using warble pure tones or FRESH noise. We get a much better response, and then the child starts to make progress.
There are also implications for children with CIs. With CIs, aided detection is also crucial for mapping as I mentioned. It's used routinely to establish, create and adjust maps. Even a 10 dB difference in thresholds, in my experience here in the clinic with children using CIs, can make a significant difference for them in order to learn speech sounds and language.
Test Protocol
Our test protocol included 31 ears, of children aged 3 years through 12 years. We had 13 hearing aid ears and 18 cochlear implant ears. We utilized conditioned play audiometry or conventional audiometry (if the kids were able to do that). We conducted testing using the Astera audiometer and a randomized block presentation of stimulus. That means that as we had to obtain thresholds with narrowband noise, FRESH noise, and warble pure tones for each child, we presented a different stimulus first with each child. For one child we'd start with narrowband noise, another child we'd start with FRESH noise, another child we'd start with warble pure tones. This is a boring task and the kids needed a lot of encouragement to stay on track. If we always started with narrowband noise, for example, by the time they got to FRESH noise, they may be extinguishing on the behavior, and we wanted to try and prevent that.
We were concerned that the kids would get bored or fatigued. When they were getting antsy, we stopped the testing and continued to collect more data on another day. We gathered octaves first, and then if we could, we gathered inter-octaves, but it wasn't always possible. We had a lot of data to analyze, so I enlisted the help of an independent statistician, Mr. Andrew Drago. He used a factorial design to look at the factors of channels, frequency, and stimulus interaction. We assessed the data from the hearing aids and the cochlear implants separately.
Hearing Aid Findings
With the hearing aids, we found no statistical difference between the aided thresholds obtained with FRESH noise and warble pure tones. In other words, they were interchangeable as test stimuli, which is what had hoped would be the case. We saw that there was a statistical significance between the aided thresholds obtained using WPT and FRESH noise, versus those obtained using narrowband noise. The results indicated that narrowband noise significantly overestimated hearing sensitivity, or made thresholds seem better, compared to WPT or FRESH noise.
We did not witness any interaction of channels on the hearing aids. This was possibly because there were not many different hearing aid manufacturers represented (the brands of hearing aids used by the children consisted of two manufacturers). If we had 100 kids with 100 hearing aids across several different brands, we may see some significance as far as how many channels were active, but we did not see any in this study.
Frequency was significant with the hearing aid data. We saw more variation in the higher frequencies than we did in the lower frequencies. There was a greater difference between thresholds obtained using NBN, WPT and FRESH noise in the higher frequencies as compared to the lower frequencies.
Figure 6 shows one of the working audiograms that we used to collect data. In this example you can see that there was less variability in the lower frequencies; the thresholds obtained with the different stimuli are almost always aligned together. Once you move into the higher frequencies, you see FRESH noise and WPT thresholds fall away from NBN, especially at 6000–8000 Hz. We found as much as a 30 dB difference at 6000 Hz with some children. At 8000 Hz, it was even more than that, depending on the child.
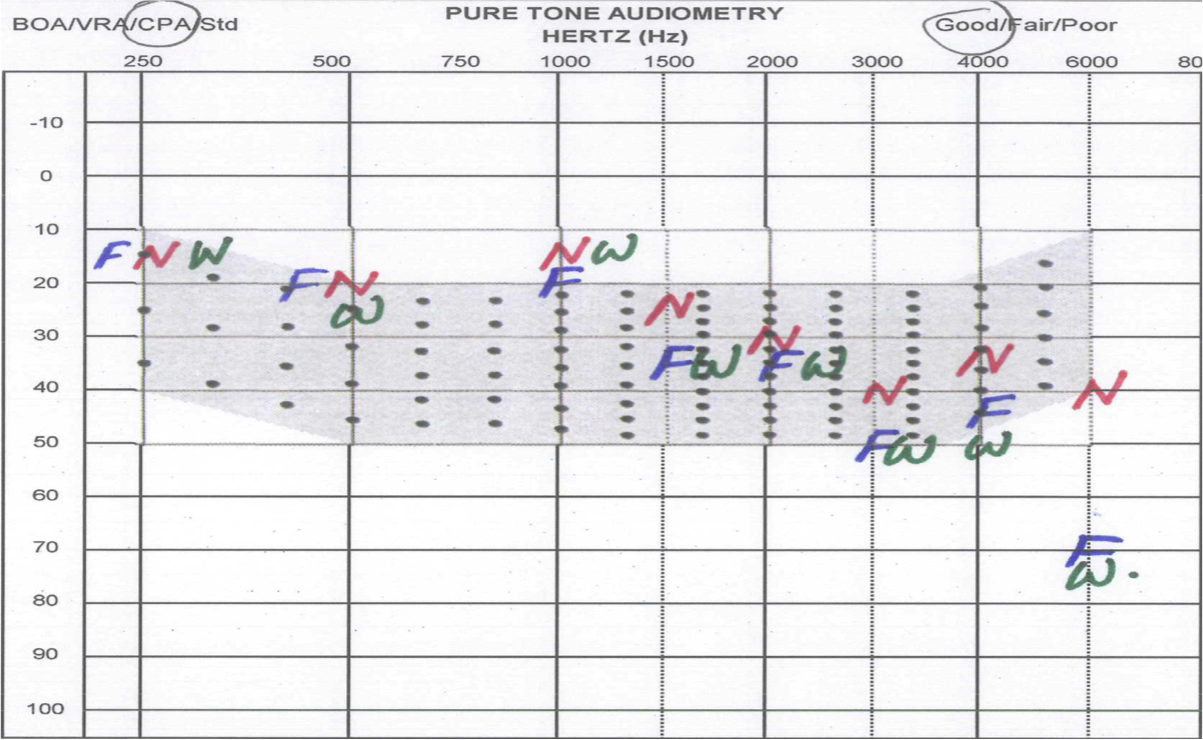
Figure 6. Audiogram used to collect data.
When we plotted the results onto a graph (Figure 7). The variation between FRESH noise and WPT was less than 1 dB. The variation between FRESH noise to NBN and WPT to NBN was over 5 dB but could be up to a 20 dB difference.
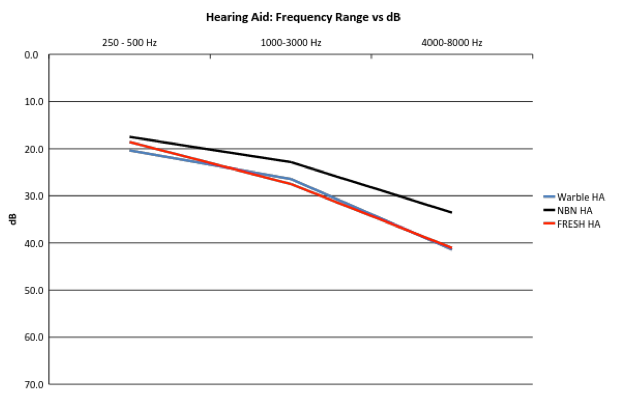
Figure 7. Hearing aid data: Frequency Range vs. dB for the various stimuli.
This was not included in the study, but I wanted to determine if I could visually see what was happening within the hearing aids by comparing channel stimulation with FRESH noise, warble pure tone and narrowband noise. I set up our clinic’s Mr. Potato Head in the booth where the children would normally sit at the same distance measured from the speaker. On his head I placed the active hearing aid connected to the manufacturer's programming screen on our computer. We could see exactly what was happening in the channels once we presented each stimulus to the hearing aid. I took a screenshot of the hearing aid channels when they were presented with each of the stimuli at 1000 Hz, and put them on a graph side by side (Figure 8). For the WPT and the FRESH noise, you can see that they look very similar. You have tight activation of channels from 750 Hz up to about 1500 Hz. Looking at the NBN stimulus, you can see there are many more channels being activated in this hearing aid, from 250 Hz all the way through 4000 Hz. It's a relatively flat response to the 1000 Hz narrowband noise stimulus.
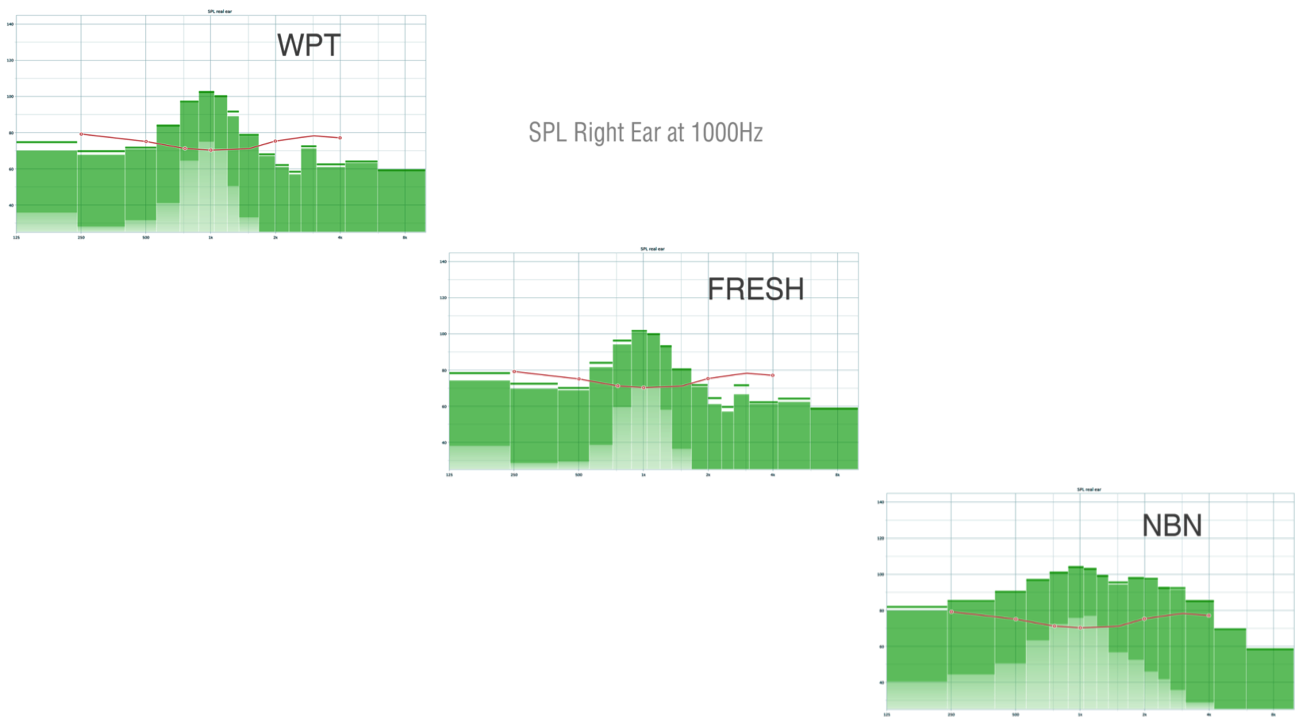
Figure 8. Hearing aid channels stimulated by WPT, FRESH noise and NBN presented at 1000 Hz.
This is an example of off-channel stimulation. Although we are presenting 1000 Hz, many channels are activated by the narrowband noise stimulus. We achieved these results by only testing the hearing aid; if we were testing an actual child with this narrowband noise stimulus, determining which channel the child was actually responding to would be difficult.
Using the same set up, I repeated this with the stimuli at 4000 Hz. You can see this graph in your handout. With WPT and FRESH noise, there was tight channel activation around 4000 Hz, with only two main channels being stimulated. When we looked at NBN, the stimulation ranged from 1500 Hz through 8000 Hz. Again, a lot of channels were activated, which would make it hard to determine to which one the child was responding to if we used this stimuli in a testing situation, i.e. we wouldn't know if they were responding to 4 kHz or 8 kHz. Then we performed a 500 Hz channel activation. For both WPT and FRESH noise, four channels were activated. At 500 Hz with NBN, stimulation occured all the way up through 2000 Hz. We were able to see the effect of the narrowband noise stimulus in the hearing aids, based on what Keeley presented earlier in Figure 3, that is, how the tail of NBN is rather wide compared to FRESH noise and WPTs.
Cochlear Implant Findings
When we examined the CI results, we found that once again, there was no statistical difference between aided thresholds obtained with WPT and those obtained with FRESH noise. They were interchangeable as stimuli. We did find a significant difference between aided thresholds obtained with NBN versus FRESH noise, and with NBN versus WPT. Frequency was not significant with the cochlear implants. In other words, we saw the same kind of separation across the whole frequency range that we tested. Channels were not significant with the cochlear implants. With hearing aids, there is more variation in the number of channels across models and brands. With implants, there are only three manufacturers, so there is less variation across products. We did look at each child to see if they had all 12 or 16 channels active. We didn't find a significant difference, likely because there just is not enough variation in the equipment that's out there. Most implants had 22 channels active.
Figure 9 shows the implant findings for frequency versus decibel range. The black line is thresholds obtained with NBN. Our average thresholds were 20 to 25 dB with NBN. The blue line represents thresholds with WPT and the red is FRESH noise; these two were very close together. Again, there was a flat response across the frequency range and not much difference from low to high frequencies. The average difference in aided thresholds between FRESH noise and WPTs was 1.1 dB; these were interchangeable as stimuli. The average difference between thresholds with NBN and WPT was 8.7 dB. The average difference between thresholds with NBN and FRESH noise was 7.6 dB.
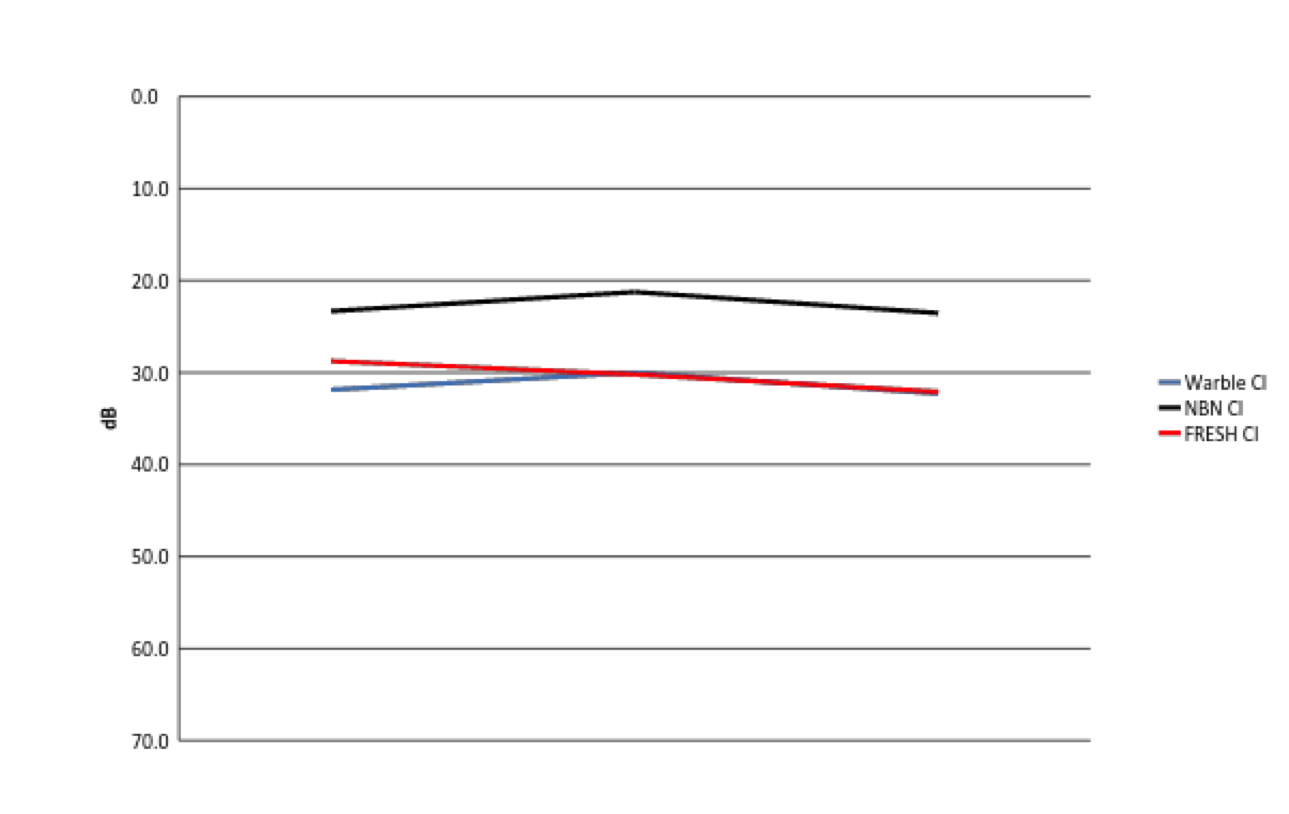
Figure 9. Cochlear implant data: Frequency Range vs. dB.
There is a much greater variability in thresholds with NBN, which is overestimating aided thresholds. This relates to speech and language development, as children need good access to very soft sounds, especially high frequency soft sounds. Those sounds include important morphological markers in the English language. If kids can’t hear those sounds, they can't say them. It's critical for them to be able to hear those sounds.
If I had a child in my clinic with thresholds in the 30 to 35 dB range, I would consider remapping them to give them a little bit better access to speech sounds. I like to try to get the aided thresholds in the 20 to 25 dB region to give children the best access we can. If you see an audiogram with aided thresholds that are 20 to 25 dB, and you obtained them with NBN, you might have thought that the fitting was optimal. However, knowing what we now know about narrowband noise overestimating thresholds, I would be concerned. Think about what you're seeing on your audiogram and realize that your NBN thresholds may not be accurate; they're probably going to be about 8 to 10 dB worse.
Abby was one of my test subjects. At the time I worked with Abby, she had one cochlear implant and one hearing aid. Like we did with the hearing aids, we set Abby up live in the booth so we could present the stimuli and see what was happening with the implant in terms of channel activation. She worked on a coloring book while we presented warble pure tone, narrowband noise, and FRESH noise to her implant.
At 500 Hz with a warble pure tone, most of the activation occurred in the lower frequencies. Because she was using a Cochlear device with dual activation of channels, there is a little stimulation in the highs. With FRESH noise, the majority of stimulation occurred in the lower frequencies. With narrowband noise, a lot more activation occurred in each of the channels, all the way up through 1700 Hz. When you see this, you can understand why you overestimate thresholds when you test using narrowband noise.
At 4000 Hz, for warble pure tone, only two channels activated, which is what we'd expect. We saw a similar result for FRESH noise. For narrowband noise, many channels were activated - from 1000 Hz all the way up through 8000 Hz. This activity is consistent with the thresholds that you receive with NBN, and why you see it across the frequency range for implants. At 1000 Hz, again there was much more broad spread of channel activation for NBN than for WPT or FRESH noise.
The next graph is a visual representation of all the data combined (Figure 10). The dashed lines are the cochlear implant results. The solid lines are the hearing aid responses.
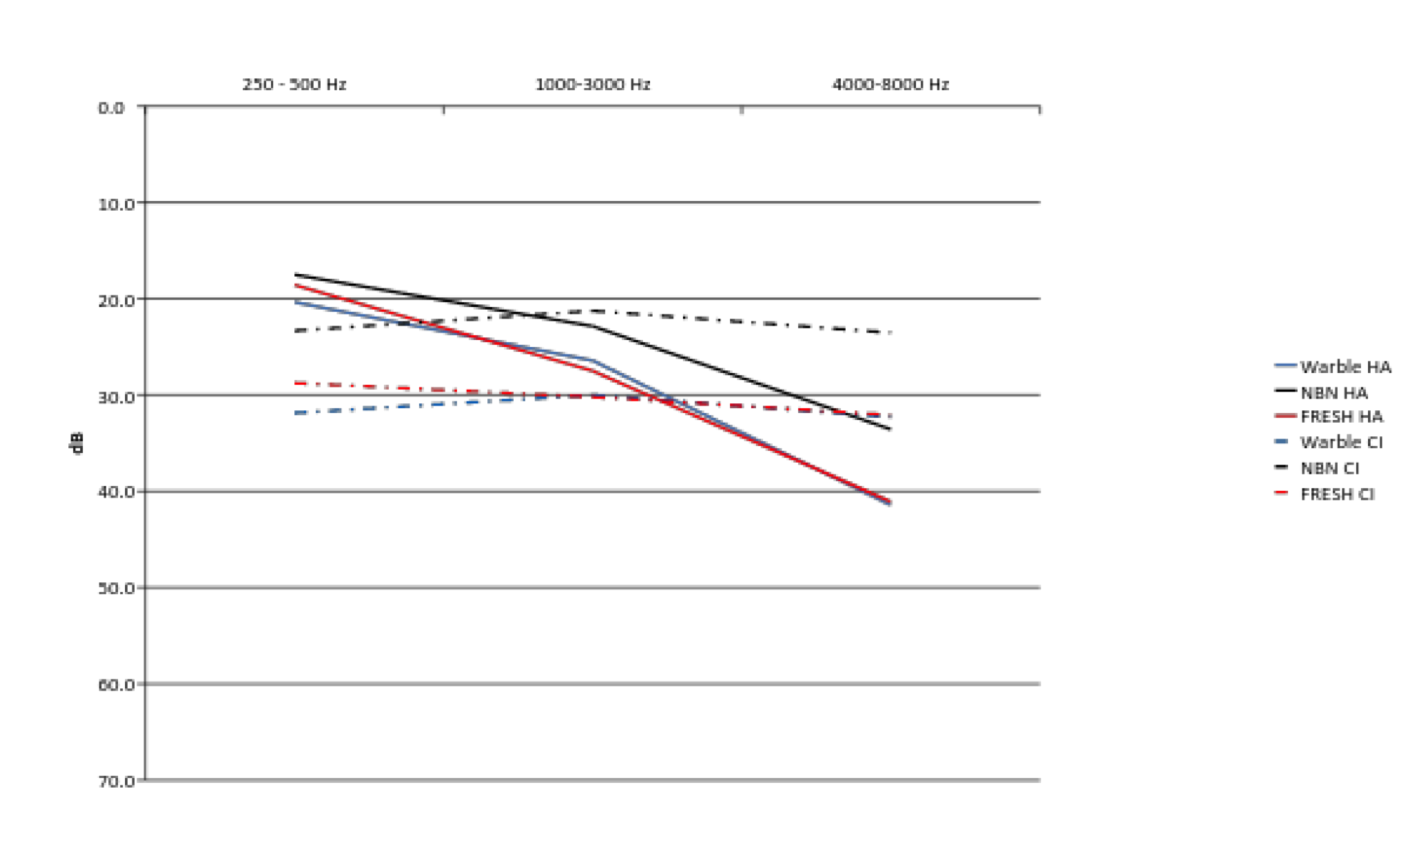
Figure 10. Combined data.
Take Home Messages
There are three take home messages from these results.
- FRESH noise and warble pure tones are interchangeable as test stimuli in the sound field, in both the unaided and aided conditions. You could use either one and expect to obtain the same result.
- Narrowband noise significantly overestimates aided thresholds for both hearing aids and cochlear implants across the frequency range in the sound field condition.
- Instead of using narrowband noise to mark thresholds, use FRESH noise and/or warble pure tones.
Audiologists have told me, “All I have is warble pure tones and nothing else on my audiometer. I don't have FRESH noise.” It is a valid argument because the babies do get bored with warble pure tones in the sound field very quickly. I would say you can use narrowband noise as a distractor, but you should not mark thresholds from it. You want to make sure that when you're marking a threshold that you're using WPT or FRESH noise. Studies have consistently shown that using NBN, not only will you overestimate in the unaided condition, especially with a sloping hearing loss, but you will also overestimate in the aided condition.
Future Research
I'm currently running a second study with a group of children here at the school, to try to obtain inter-octave responses (having already obtained octave responses). That will allow us to look frequency by frequency and quantify the degree to which they are overestimating the thresholds at each particular frequency using NBN. We also want to analyze why stimulus and frequency have a significant impact. Furthermore, I would like to determine if the processing strategy used for an implant affects the resulting difference across NBN, FRESH noise and WPT. If you are not familiar, in implants there are different strategies of processing sound (e.g., ACE, Speak, etc.). We would like to gather more data with a larger variance of channels active, and a wider array of devices and products. For example, if you had an implant device with a very limited number of channels active (for example, a child with only 6 electrodes active), would you see a bigger difference between NBN and WPT/FRESH noise because you're not getting the discrete finite frequency allocation that you would in a child who has 22 electrodes active in his implant. In hearing aids, is there going to be a large difference between a hearing aid that only has 6 channels versus one that has 20 channels?
Conclusions
In summary, do not use narrowband noise for marking thresholds. Make sure that you use warble pure tones or FRESH noise in the sound field for all testing. At bare minimum, take an RECD of the child, regardless of age (even infants). Use actual ear data versus average. I almost never use average data unless I absolutely cannot get an RECD, which happens every once in a while. If you take that RECD and program the hearing aid in the test box, at least you've measured the RECD and you're using that in your calculation. We need to re-educate everyone to do it properly. After you’ve taken this course, we hope you leave with a better sense of how to test children and how to test them accurately.
References
Dillon, H., & Walker, G. (1982). Comparison of stimuli used in sound field audiometric testing. Journal of the Acoustical Society of America, 71,161-172.
Orchik, D.J. & Mosher, N.L. (1975). Narrow band noise audiometry: The effect of filter slope. Journal of the American Audiology Society, 1(2), 50-53.
Orchik, D.J., & Rintelmann, W.R. (1978). Comparison of pure-tone, warble-tone, and narrow-band noise thresholds of young normal hearing children. Journal of the American Audiology Society, 3, 214-220.
Stephens, M., & Rintelmann, W. (1978). The influence of audiometric configuration on pure-tone, warble-tone and narrow band noise thresholds of adults with sensorineural hearing losses. Journal of the American Audiology Society, 3, 221-226.
Walker, G., Dillon, H., & Byrne, D. (1984). Sound field audiometry: Recommended stimuli and procedures. Ear & Hearing, 5,13-21.
Citation
Moore, K., & Violetto, D. (2016, May). FRESH noise - a fresh approach to pediatric testing. AudiologyOnline, Article 17035. Retrieved from www.audiologyonline.com