
The first article in this two-part series provided an overview of how telemetry is used to measure the electrically evoked compound action potential (ECAP) in patients with cochlear implants (Hughes, 2006). It also provided a summary of the two methods used to separate stimulus artifact from the ECAP response (subtraction method and alternating polarity) so that readers would have a basic understanding of how the ECAP is resolved and what parameters are involved in ECAP measurement. Lastly, the article provided a comprehensive summary of the major research findings regarding ECAP measurements and their relation to programming levels (threshold, upper comfort levels, and dynamic range) for a variety of devices and stimulation rates. For ECAP thresholds to be used appropriately in a clinical setting, it is essential to know how to obtain good ECAP recordings, how to correctly measure ECAP amplitudes, and how to accurately determine threshold. This is the focus of the present article.
The current clinical software applications for ECAP measurement have been written to be very user-friendly so that individuals with minimal evoked potentials experience can easily use them. These applications offer features such as automatic peak picking to determine ECAP amplitude as well as linear regression analysis to interpolate thresholds. Some systems offer automatic optimization of stimulus and recording parameters so that the user does not have to make these adjustments manually. This is advantageous for users with minimal understanding of the effects of stimulus and recording parameters on the measured ECAP response. Even with these added features, however, the user should at least have a good working knowledge of what constitutes "good" and "bad" ECAP recordings, how to accurately measure ECAP amplitudes (and deciding if over-riding the computer's amplitude measures is necessary), and how to decide whether or not certain waveforms should be included in the regression analysis used for threshold estimation. The purpose of the present article is to: (1) provide the reader with an overview of the features of current software applications used for ECAP measurement, (2) discuss relevant stimulation and recording parameters and provide tips for optimizing these parameters, (3) provide guidelines for correct amplitude measurement, and (4) describe the process of accurate threshold determination.
Overview of Current ECAP Software
Neural Response Telemetry, Cochlear Corporation
Neural Response Telemetry (NRT) is the name of the software that was first used commercially to measure the ECAP in patients with Nucleus 24 devices. The current Nucleus programming software, Custom Sound, includes a component called Custom Sound EP, which is used for different electrophysiologic measures including the ECAP. NRT has been incorporated into Custom Sound EP, which offers two different ways to measure the ECAP: (1) automatic test mode (AutoNRT) or (2) manual test mode (Advanced NRT). The primary difference between the two modes is that the AutoNRT mode uses coded-in algorithms to automatically determine stimulus and recording parameter changes in order to optimize the ECAP response. In Advanced NRT, stimulus and recording parameters are optimized by the user. Clearly, the user must have a good working knowledge of the effect of stimulus and recording parameters in order to use the manual mode effectively. In AutoNRT, a forward-masking subtraction method is used to resolve the ECAP from stimulus artifact (Abbas et al., 1999; Brown et al., 1990, 1998, 2000; Dillier et al., 2002). The Advanced NRT mode provides multiple options for artifact reduction, including the subtraction method and alternating polarity.
Neural Response Imaging, Advanced Bionics Corporation
The current Advanced Bionics clinical programming software, SoundWave, contains a feature called Neural Response Imaging (NRI), which is used to measure the ECAP. NRI uses alternating polarity with signal averaging to separate the neural response from stimulus artifact. The alternating polarity method is simpler than the forward-masking subtraction method, so there are fewer user-controlled parameters to manipulate.
Auditory Nerve Response Telemetry, Med-El Corporation
Auditory Nerve Response Telemetry (ART) is not yet available in the CI Studio+ programming software for the Med-El device. ART uses either alternating polarity or a scaled template method to separate the neural response from stimulus artifact.
Table 1 summarizes the user-controlled parameters for AutoNRT, Advanced NRT, and NRI. Advanced NRT has an advanced parameter set that allows for more manipulations than are listed here. As can be seen from Table 1, Advanced NRT is a bit more complicated than NRI or AutoNRT due to the greater number of parameters that can be manipulated. Some clinicians (and most researchers) like the flexibility that Advanced NRT offers. AutoNRT and NRI are much simpler, and from the user's standpoint, are more practical for everyday clinical use.
Table 1.
Stimulation and Recording Parameters
Clearly, as the number of user-controlled parameters increases, so must the clinician's working knowledge of how each parameter change affects the recorded ECAP response. The most common user-controlled parameters that affect ECAP measures are: recording delay (NRT only), recording electrode, current level, amplifier gain, number of averages, and stimulation rate. Pertinent information for each of these parameters is discussed below:
Recording Delay
The recording (or sampling) delay is the amount of time between offset of the probe pulse and onset of recording. This parameter is user-controlled only in NRT; it is not available in NRI because the recording begins 107.75 microseconds before the stimulus is presented (L. Litvak, personal communication). The purpose of introducing a delay between stimulus offset and recording onset is to avoid saturation of the recording amplifier (Abbas et al., 1999; Diller et al., 2002). Shorter delays are more likely to yield amplifier saturation, which can obscure or distort the ECAP response. However, if the delay is too long, the recording may not capture the leading negative peak of the ECAP, which makes it impossible to correctly measure the amplitude. Thus, the delay should be decreased (shortened) if a negative peak cannot be resolved, and the delay should be increased if morphology is poor. Generally, delays between about 50 and 120 microseconds yield the best NRT results. With the new Freedom device, it may be necessary to increase the delay to as long as 180 microseconds for best results. Recording delay is typically the first parameter that should be manipulated to optimize ECAP recordings obtained with NRT.
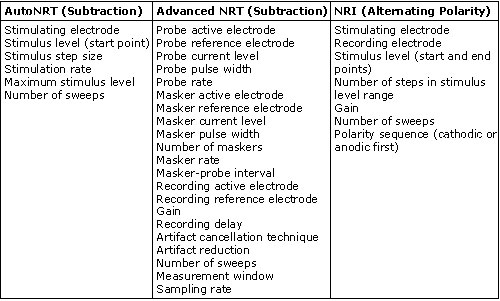
Figure 1 illustrates the effect of recording delay parameters: The left panel shows an ECAP waveform obtained in NRT with a recording delay of 122 microseconds, and the right panel shows an ECAP obtained in NRI with no recording delay. Note the presence of stimulus artifact between 0 and 500 microseconds in the trace on the right, whereas the recording delay in the trace on the left yields a clear ECAP with no effects of amplifier saturation from stimulus artifact.
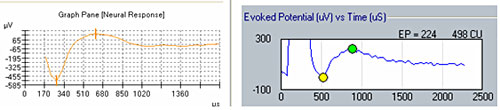
Figure 1. Example of ECAP with recording delay (left) and without recording delay (right).
Recording Electrode
The default recording electrode setting in both NRT and NRI is two electrode positions apical to the stimulating electrode. In most cases, this setting works well and does not often need to be adjusted. In some cases, however, the default position yields a recording that is contaminated by effects of amplifier saturation from stimulus artifact. The easy solution is to either change the recording electrode to one or two additional positions apically or try recording from two to three electrode positions on the basal side of the stimulating electrode. It should be noted, however, that the overall ECAP amplitude will generally get smaller as the recording electrode is moved farther away from the stimulating electrode (Abbas et al., 1999; Cohen et al., 2004; Frijns et al., 2002). This is something to consider if ECAP amplitudes or thresholds are to be compared across electrodes; it is generally best to use fairly consistent recording electrode spacings across the array in those cases. An example of the effects of changing the recording electrode on ECAP amplitude is shown below in Figure 2. In this example, the stimulus was presented to electrode 7; excessive artifact precluded recording from the two electrodes adjacent to the stimulating electrode (electrodes 6 and 8).
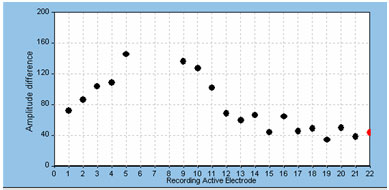
Figure 2. Example of effect of changing recording electrode on ECAP amplitude.
Finally, we have found significant problems with artifact contamination when using electrodes 12, 14, and 16 to record the ECAP in the Nucleus 24R(CS) Contour. This problem was attributed to the circuit layout in that device, which has been changed in the Nucleus 24RE Freedom device. An example of this contamination effect is shown in Figure 3. Here, the stimulus was delivered to electrode 11. Recording electrode number and probe level are shown to the right of each waveform.
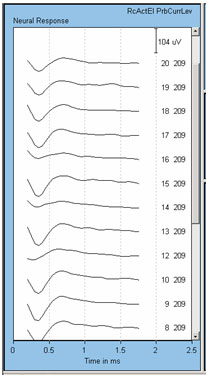
Figure 3. Example of anomaly with recording from electrodes 12, 14, and 16 in the Nucleus 24R(CS). Recording electrode is indicated next to each waveform. Note the smaller amplitudes for recording electrodes 12, 14, and 16.
Current Level
As with any evoked potential, ECAP amplitude increases with stimulus level. If there is no neural response, generally the first step is to increase stimulus level (in accordance with the patient's subjective tolerance levels, of course). It is important to be mindful of voltage compliance limits within the device when requesting high current levels. If the requested current level is high and the electrode impedance is relatively high, the device will consequently produce insufficient voltage for the amount of current that the user is requesting. In NRI, a blue ring will outline the green electrode impedance icon to indicate that voltage compliance has been exceeded (see Figure 4). In NRT, a red "X" will appear next to any recording that is "invalid"; this would include recordings made when voltage compliance was exceeded. To determine whether the recording is invalid because of voltage compliance limits, the user can simply mouse over the red "X" and an explanation box will appear stating that the electrode is out of compliance. Additionally, very high stimulus levels may make amplifier saturation more problematic. An example of this using NRT is shown in Figure 5. In this example, waveforms tagged with the red "X" have been clipped because they are outside of the amplifier's range. If changing the recording delay or recording electrode does not alleviate artifact contamination, then a reduction in stimulus level may help, as long as a measurable ECAP response can still be obtained.
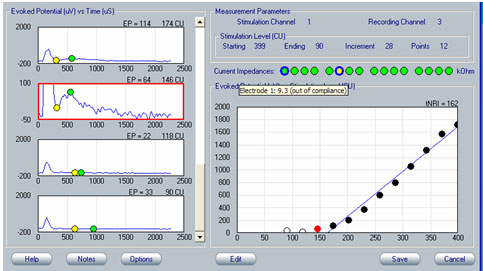
Figure 4. Example of out-of-voltage-compliance indicator (blue ring) for impedance measures in NRI. The yellow circle indicates an open circuit.
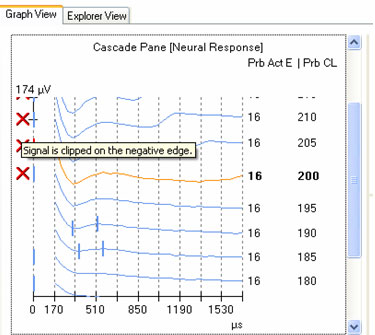
Figure 5. Example of invalid waveform indicator (red "X") in NRT,
Amplifier Gain
If amplifier saturation presents a significant problem that cannot be resolved by extending the recording delay (if that option is available), recording from an electrode that is farther away or reducing the stimulus level, then reducing the amplifier gain may help (Abbas et al., 1999; Dillier et al., 2002). The default gain for NRI is 300 and the only other option is 1000. NRT in Custom Sound EP has four gains to choose from: 40, 50, 60, and 70. The default gain is 50. In all previous versions of NRT the default gain was 60 (the only other useable option was 40). The new default of 50 seems to produce less amplifier saturation than the old default of 60, with less noise problems than a gain of 40. The noise level typically increases when the gain is reduced, so the number of averages should be at least doubled when reducing gain.
Number of Averages
As with any evoked potential, increasing the number of averages will reduce the amount of noise in the recorded ECAP response. In the current version of SoundWave, the default number of averages for NRI is 32 (this will be increased to 128 in the next version). Options include 16, 32, 64, 128, and 256. We always increase the averages to at least 64 during intraoperative testing and sometimes to 128 during postoperative testing, depending on the noisiness of the ECAP response. The current default setting for the number of sweeps in Custom Sound EP is 35 for AutoNRT and 50 for Advanced NRT, regardless of whether intraoperative or postoperative testing mode is chosen. We typically find that 50-100 averages work best in most cases. Fewer averages are typically used in the operating room due to limitations in testing time. Generally, the number of averages should be increased for lower amplifier gains and for lower stimulus levels to compensate for the increased noise level in the recording.
Stimulation Rate
One difference between the automatic and manual NRT modes is that the default stimulation rate for the manual mode (Advanced NRT) is 80 Hz, whereas in AutoNRT it is 250 Hz when the intraoperative mode is chosen (in postoperative mode, both AutoNRT and Advanced NRT defaults are 80 Hz). This is important to note if you are switching back and forth between Auto and Advanced modes to make intraoperative ECAP measures across the electrode array within a subject or if you are comparing intraoperative to postoperative AutoNRT measures. Thresholds can be slightly higher (and amplitudes slightly smaller) for the faster stimulation rate. Currently, stimulation rate is not a user-controlled option in NRI.
Amplitude Measurement: Picking Peaks
ECAP amplitude is typically measured from the leading trough (negative peak, or N1) to the following positive peak or plateau (P2). Examples of measured ECAPs obtained with NRT and NRI can be seen in the left and right panels, respectively, of Figure 1. Both NRT and NRI have built-in algorithms that identify peaks automatically so the user does not have to measure ECAP amplitudes manually. However, sometimes the automatic "peak-picker" will mark artifact or noise in the absence of a neural response, or it will inaccurately mark a neural response contaminated with artifact. NRT uses a series of decision-making rules to determine whether or not a response exists. If it determines there is no response, then no peaks will be picked and the trace will be marked as "no response" by a short vertical hash mark at time zero in the cascade pane. An example of this can be seen for probe levels of 180 CL and 170 CL in the left panel of Figure 6. In contrast, NRI does not have a built-in method to automatically identify a no-response waveform. Therefore, a "peak" will always be selected, even if one does not truly exist. An example of this can be seen in Figure 7, where "peaks" have been picked in the absence of a true ECAP response. Although NRT does have the capability of indicating a no-response waveform, it will sometimes mark peaks when no visible ECAP exists. An example of this is shown in Figure 6 for probe levels of 185, 175, and 165 CL. An expanded view of the waveform at 165 CL is shown in the bottom right panel of Figure 6. The peak-peak amplitude that is marked in this case is no larger than the peak-peak amplitude of the noise. Both NRT and NRI use the automatically picked amplitudes to plot an input-output (growth) function (as shown in the top right panel of Figure 6) and then apply a linear regression analysis to determine the ECAP threshold. As can be seen in the top right panel of Figure 6, the inclusion of several waveforms that are incorrectly marked as a response (e.g., 165, 175, and 185 CL) result in a shallower slope of the regression line and thus, a lower estimated ECAP threshold. This issue is discussed further in the next section.
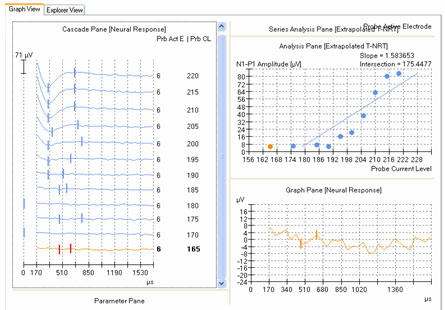
Figure 6. Amplitude growth function in NRT. Left panel: ECAP waveforms for progressively lower stimulus levels. Vertical marks indicate results from automatic peak-picker. Top right panel: ECAP amplitudes plotted as a function of stimulus level. Bottom right panel: Close-up view of a single waveform selected from the panel on the left (probe stimulus level 165 CL).
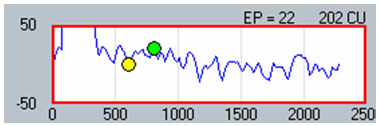
Figure 7. Example of automatic peak-picker results for a no-response waveform in NRI.
The following simple rules can help to accurately measure ECAP amplitudes and to determine whether or not the automatically-selected peaks would need to be evaluated manually:
- Compare to waveforms at other levels.
If the ECAP is near threshold, look at the latency and morphology of the waveforms at higher stimulus levels to help gauge whether a response remains, and if so, where to mark the peaks. As stimulus level decreases, the amplitude of the ECAP will decrease and the latency may increase slightly. An example can be seen in the left panel of Figure 6. Note the large difference in the marked N1 latency (denoted by the left-most vertical hash mark) between the 185 CL waveform and all of the other waveforms at higher levels. This sudden, large shift in N1 latency is a clue that the waveform may be marked incorrectly. - Change the amplitude scale for better viewing.
If it is difficult to ascertain whether a response exits (i.e., it is near threshold), change the amplitude scale to encompass a smaller range. This will effectively zoom in on the waveform so that the user can then determine whether a response is present. In NRI, simply click once on the waveform and then hit the up arrow on the keyboard to zoom in (the down arrow zooms back out). On the NRT screen, the waveform that is selected on the left-hand panel (see Figure 6) will be shown in greater detail in the bottom right panel. - Consider the overall noise floor.
The ECAP should always be larger than the noise floor; otherwise it is difficult to be sure that the marked peaks belong to the physiologic response and not to recording noise. In the bottom right panel of Figure 6 and in Figure 7, the difference between the marked "peaks" is not different from the peak-peak amplitude measured at any other latency in the trace (i.e., the noise). The noise floor in th Custom Sound version of NRT is typically under about 10 microvolts. In NRI, it is typically around 50-100 microvolts (in previous versions of NRT, the noise floor was roughly 20-40 microvolts). Therefore, it is generally not possible to measure an ECAP under about 10 microvolts with NRT or under about 50-100 microvolts with NRI.
ECAP thresholds can be determined using one of two methods. The first method uses visual detection to determine the lowest stimulus that elicits a measurable response. This method of determining threshold is similar to that used in most audiology clinics to determine ABR threshold. This method can use either an ascending or descending stimulus level. Ideally, initial responses should be obtained at a high enough suprathreshold level so that the user can ensure that the neural response decreases with amplitude AutoNRT uses an algorithm-based version of the visual detection method to determine ECAP threshold (Botros, van Dijk & Killian, 2006). One drawback to the visual detection method is that for systems with a relatively high noise floor, the true threshold can be obscured by the noise, yielding a threshold estimate that is likely too high.
The second method involves applying a linear regression analysis to points on an input-output (or amplitude growth) function. Threshold is determined as the level at which the regression line crosses zero amplitude (i.e., intercept of the x-axis where y = 0). The advantage to this method is that lower thresholds can be extrapolated for high-noise systems. One drawback to this method is that at least three suprathreshold data points are needed to reasonably calculate a regression intercept or threshold, which can be difficult to do for patients whose ECAP thresholds are near their maximum loudness comfort levels. In addition, it is crucial to not include data points for regression analysis where (1) the function rolls over or saturates at higher stimulus levels or (2) there are multiple zero-amplitude points or points within the noise floor. Figure 8 shows an example of an ECAP amplitude growth function obtained with NRI that rolls over at higher stimulation levels and has multiple data points within the noise floor. In the left panel of Figure 8, all data points are included in the regression analysis, yielding a calculated ECAP threshold (called tNRI) of 130 clinical units (CU). In the right panel of Figure 8, the data point for the highest stimulus level has been omitted due to a decrease in amplitude. In addition, the three lowest-amplitude data points have been omitted from regression analysis because they are in the noise floor (which is between 50-100 microvolts for this system). The resulting tNRI is now 174 CU, which is much closer to (but still lower than) the visual detection threshold of 202 CU (which is the first point above the noise floor). Another example, briefly discussed in the previous section, can be seen in Figure 6. The automatic peak-picker labeled probe current levels of 180 and 170 as "no response", but did pick peaks for probe current levels of 175 and 165. The regression line in the upper right panel of Figure 6 is calculated on all amplitudes in the plot, yielding a predicted threshold (T-NRT) of 175 CL, which is much lower than the visual detection threshold of 190 CL. When the amplitude measures are unmarked on the no-response waveforms, the T-NRT becomes 189.8 CL (see Figure 9), which is virtually the same as the visual detection threshold. These examples illustrate the importance of selective inclusion of data points for an accurate determination of threshold on the basis of linear regression analysis. In a study comparing visual detection thresholds to tNRI (linear regression thresholds), Han et al. (2005) found that tNRI was, on average, 32 CU lower than visual detection thresholds, which is consistent with the example shown in Figure 9.
Because AutoNRT and Advanced (manual) NRT use different methods to calculate threshold (visual detection versus linear regression, respectively), different threshold values are often obtained for the same electrode tested in both modes. As stated above, visual detection thresholds (i.e., AutoNRT) will typically be higher than regression thresholds (i.e., Advanced NRT) due to differences in how threshold is defined. AutoNRT may also produce higher thresholds because its default number of averages (35 sweeps) is less than that for Advanced NRT (50 sweeps). As stated previously, fewer averages tend to produce higher thresholds due to higher noise levels. It is important for clinicians to be aware of the differences between AutoNRT thresholds and Advanced NRT thresholds if T-NRT data from both methods are combined for use in programming a single map. Because the Custom Sound programming software does not differentiate between thresholds obtained in the auto versus manual modes (both can be used together in programming), we find it helpful to name the T-NRT files in such a way that designates the data collection method (e.g., include "auto" in the filename for thresholds obtained in AutoNRT).
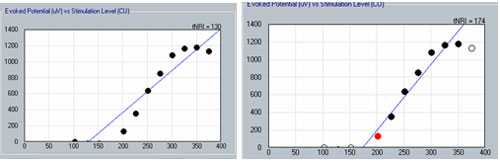
Figure 8. Example illustrating the change in linear regression threshold (tNRI) when no-response waveforms are excluded from regression analysis. Left panel: before exclusion; right panel: after exclusion.
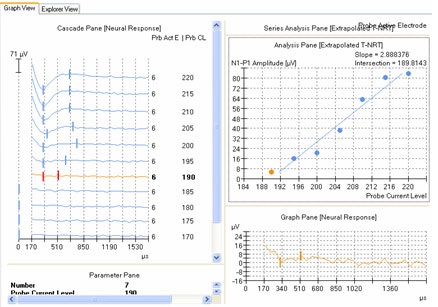
Figure 9. Example of new linear regression threshold (T-NRT) after no-response waveforms are excluded from regression analysis. Compare with Figure 6.
Summary
ECAP measures can provide valuable objective information to assist with programming cochlear implant speech processors, regardless of device type or processing strategy used. ECAP measures are quickly and easily made in a clinical setting and can be especially useful when coupled with other objective measures such as the electrically evoked stapedial reflex threshold (ESRT). The clinician should exercise care to ensure that automatic ECAP peak-picking algorithms do indeed yield correct measures and that there is agreement between extrapolated (i.e., linear regression) thresholds and visual detection thresholds.
References
Abbas, P. J., Brown, C. J., Shallop, J. K., Firszt, J. B., Hughes, M. L., Hong, S. H. & Staller, S. J. (1999). Summary of results using the Nucleus CI24M implant to record the electrically evoked compound action potential. Ear and Hearing, 20, 45-59.
Botros, A., van Dijk, B., & Killian, M. (2006). AutoNRTTM: An automated system that measures ECAP thresholds with the Nucleus FreedomTM cochlear implant via machine intelligence. Artificial Intelligence in Medicine, doi: 10.1016/j.artmed.2006.06.003.
Brown, C. J., Abbas, P. J., & Gantz, B. (1990). Electrically evoked whole-nerve action potentials: Data from human cochlear implant users. Journal of the Acoustical Society of America, 88(3), 1385-1391.
Brown, C. J., Abbas, P. J., & Gantz, B. (1998). Preliminary experience with Neural Response Telemetry in the Nucleus CI24M cochlear implant. The American Journal of Otology, 19, 320-327.
Brown, C. J., Hughes, M. L., Luk, B., Abbas, P. J., Wolaver, A., & Gervais, J. (2000). The relationship between EAP and EABR thresholds and levels used to program the Nucleus 24 speech processor: Data from adults. Ear and Hearing, 21, 151-163.
Cohen, L. T., Saunders, E., & Richardson, L. M. (2004). Spatial spread of neural excitation: comparison of compound action potential and forward-masking data in cochlear implant recipients. International Journal of Audiology, 43, 346-355.
Dillier, N., Lai, W. K., Almqvist, B., Frohne, C., Müller-Deile, J., Stecker, M., von Wallenberg, E. (2002). Meaurement of the electrically evoked compound action potential via a neural response telemetry system. Annals of Otology, Rhinology & Laryngology, 111(5), 407-414.
Frijns, J. H. M., Briaire, J. J., de Laat, J. A. P. M., & Grote, J. J. (2002). Initial evaluation of the Clarion CII cochlear implant: Speech perception and neural response imaging. Ear and Hearing, 23, 184-197.
Han, D.-M., Chen, X.-Q., Zhao, X.-T., Kong, Y. Li, Y.-X., Liu, S., Liu, B., & Mo, L.-Y. (2005). Comparisons between Neural Response Imaging thresholds, electrically evoked auditory reflex thresholds and most comfortable loudness levels in CII Bionic Ear users with HiResolution sound processing strategies. Acta Oto-Laryngologica, 125, 732-735.
Hughes, M. L. (2006). Fundamentals of clinical ECAP measures in cochlear implants, Part 1: Use of the ECAP in speech processor programming. Audiology Online, April 10, 2006, Article 1569. Retrieved April 10, 2006 from the Articles Archive on www.audiologyonline.com. Direct access URL located at: www.audiologyonline.com/articles/article_detail.asp?article_id=1569