
Learning Outcomes
After reading this article, professionals will be able to:
- Describe how audiological and non-audiological variables influence hearing aid wear time.
- Explain the main variables that influence wear time.
- List the strengths and limitations of statistical tests with big data.
Introduction
Hearing aids can provide better hearing and improved hearing-related quality of life to people with hearing loss. Despite this, many people with hearing loss who could benefit from wearing hearing aids choose not to. Studies have shown as little as 1 in 10 older adults with confirmed hearing loss using hearing aids (Gopinath et al., 2011), lower uptake numbers are expected for regions with higher poverty levels and reduced access to audiology services as well as cultural influence with negative impact on uptake rates (Bisgaard et al., 2021). There are many studies of hearing aid uptake and usage that have revealed relationships between a myriad of different factors and hearing aid use. Examples of such factors include audiometric profile, demographic characteristics, socio-economic factors, expectations, support from significant others, and provider influence (Gallagher & Woodside, 2018; Jenstad, 2011; Knudsen, 2010; Leeuwen, 2021; McCormack & Fortnum, 2013; Pouyandeh & Hoseinabadi, 2019; Saunders et al., 2016; Sciacca et al., 2017; Simpson et al., 2019; Wong et al., 2003). It has been typical for such research to be conducted by directly surveying users and non-users of hearing aids, by analyzing data collected in the context of large epidemiological studies, or by experimental design. All these methods provide valuable insights that can be used to promote hearing aid usage and to improve the experience of those who opt for hearing aids. However, sample sizes from these data sources can be limited due to the resources and effort to effectively collect them.
Another source of insights that is becoming increasingly common is big data. The term “big data” refers to the storage of large data sets (>1 GB) and related algorithms that are used in various areas to reveal hidden patterns, trends, and associations, that cannot be obtained by more classical approaches either due to the sheer number of factors involved or a lack of meaningful a-priori hypotheses about the nature of the problem (Davenport, 2012; Davenport 2013; McAfee, 2012). Analysis of “big data” can lead to insights that improve products and services, influence strategic business decisions, inform public health policy, and more. Within audiology, a growing body of research is leveraging big data from a variety of sources such as hearing aid fitting software (Mellor et al., 2018; Singh & Launer, 2018), electronic health records (Saunders et al., 2021), and especially hearing aid data-logging (Christiansen et al., 2021; Pasta et al., 2021).
Modern hearing aids can store data on how they are being used, referred to as hearing aid data-logging. Most commonly, data-logging information records how long hearing aids are switched on, and the changes made by hearing aids users in volume or programs. Many also record the amount of time that they are used in different acoustic environments. Therefore, data-logging might serve as an objective measure of how the person using the hearing aids interacts and uses them.
GN Hearing A/S is a manufacturer of hearing aids under the brand names of ReSound, Beltone and Interton. The GN Online Service (GNOS) is the cloud-based storage system that stores data, including hearing aid data-logging and patient details, such as age, gender, hearing loss and region. Importantly, where patients have provided consent for GN Hearing A/S to collect and use their data for research, information is sent from GNOS to the GN Hearing data lake where it undergoes an anonymization process, removing identifiable information (name etc) from the data. Data is stored in a raw, unformatted style, and is therefore extracted for specific use cases, such as understanding use of product features. Because the GN Hearing data lake contains anonymized patient information (age, gender, country) and the corresponding hearing aid data-logging data, it is possible to analyze some variables known to influence hearing aid use, such as hearing loss severity, age, gender, and hearing aid style (Hickson et al., 2014; Ng & Loke, 2014) and examine how these variables scale with big data. The aim of this study was to explore how known audiological and non-audiological variables that influence hearing aid usage scale from a large manufacturer dataset. It is a further aim to explore typical and atypical hearing aid use.
Method
Design and Participants
This paper presents a retrospective cross-sectional analysis of anonymized patient hearing aids that were in use between 1 January 2021 and 31 January 2021. The study did not undergo ethical approval, as patient identifiable information (name, address) was not available. All patients whose data was included in this paper have provided consent for GN Hearing A/S to receive and process their data for research. Inclusion criteria were that the patient was between 30 and 89 years, gender was identified, an audiogram was available and at least two separate hearing aid data-logging packages were available in the specified period. While people can be fit with either one or two hearing aids, previous studies have indicated is it uncommon for people who are fit bilaterally to have different patterns of hearing aid use (Laplante-Lévesque et al., 2014). Therefore, in the present study, one hearing aid per person was analyzed. The hearing aid from the better hearing ear was included. Better hearing was defined as the side with the best four frequency average hearing threshold. We excluded hearing aids that had been associated with multiple patients – for example, trial hearing aids. A total of 23,402 hearing aids and corresponding patient details were included.
Dataset
The GNOS data lake consists of anonymized patient and hearing aid records of which both the hearing care professional (HCP) has registered to use this system and the patient has consented to collecting and using their data for research. Data originates from fitting software (FSW) and/or from the hearing aid to an app. Regarding the former, data is transferred from FSW to the data lake, after an event i.e., after a fitting appointment. Regarding the latter, data is transferred from the app to the data lake daily.
Data Preparation
With such datasets, where data is being received in its raw format, the first step is to clean and prepare the data, removing illogical and duplicate entries that occur through transferring the data. After the data is cleaned, variables or features are then extracted, and sub-groups are created. The feature extraction and creation of subgroups are further described in Table 1.
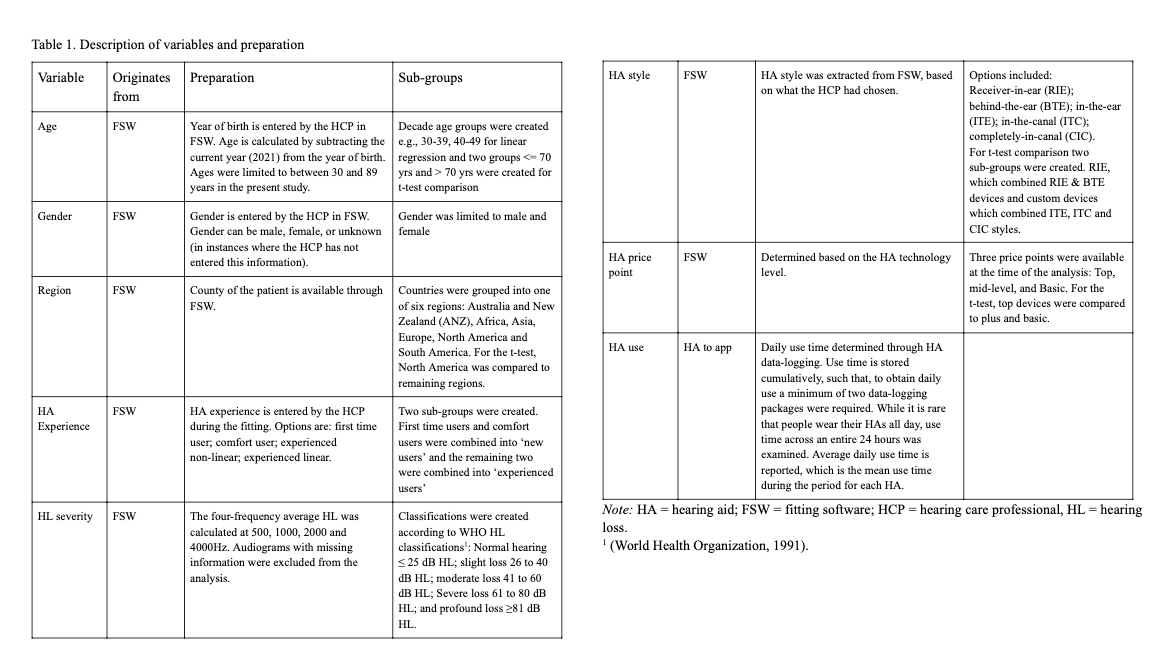
Table 1. Description of variables and preparation. Click on the table to view it full size in a new window.
Procedure
Each of the variables was extracted, cleaned, and prepared, applying inclusion and exclusion criteria and creating sub-group classifications as described in Table 1. After cleaning and preparing each variable, they were joined, to make one dataset for analysis; the better hearing ear side for each patient was used for the analysis.
Data Analysis
Analysis was completed using Python (version 3.6.12) with the help of Jupyter Notebook. A histogram displays the distribution of mean use time for the entire sample. Box and whisker plots display mean daily use time for the sub-groups. Independent t-tests explored hearing aid use between the sub-groups and given the size of the dataset, confidence intervals and effect sizes (Cohen’s d) were calculated to interpret the magnitude of significance, where d= 0.2, 0.5, and 0.8 represented a small, medium, and large effect size, respectively (Brydges, 2019). Multiple linear regression was used to examine the relationship between bivariate factors and hearing aid use. A significance level of p<.05 was applied in all analyses.
Results
Sample
In total, 23,402 patients were included in the final analysis. Of these, more patients were male (64.4%) and 35.6% were female. Patients had a mean age of 67.7 years (SD = 11.9) and by age group, 2.9% were 30 to 39 years, 5.6% were 40 to 49 years, 12.8% were 50 to 50, 29.1% were 60 to 69 years, 34.8% were 70 to 79 years and 14.7% were 80 to 89 years. Most patients were from North America (67.7%), followed by Europe (20.9%), South America (6.5%), Asia (2.9%), Australia and New Zealand (ANZ) (1.4%) and 0.6% were from Africa. RIE devices were the most common device (88.7%), a further 6.6% had BTE devices and the remaining had a custom device with 2.3% having an ITC, 1% having a CIC, and 0.8% having an ITE device. By price point, 62% had a top-level hearing aid, 19.2% had a mid-level, and 18.6% had a basic-level hearing aid. By hearing loss classification, 6.8%, 31%, 45.2%, 13.7%, and 3.3% of people had normal hearing, slight/mild loss, moderate loss, severe loss, and profound loss, respectively. Participants were fairly evenly distributed regarding prior hearing aid experience, with 54.4% of participants being new hearing aid users and 45.5% being experienced hearing aid users.
Distribution of Mean Daily Hearing Aid Use
Figure 1 presents the distribution of hearing aid use for the entire sample. The mean daily hearing aid usage was 10.9 hrs/day (SD = 4.8). The interquartile range was 8 to 14.2 hrs/day, and the median was 12.1 hrs/day.
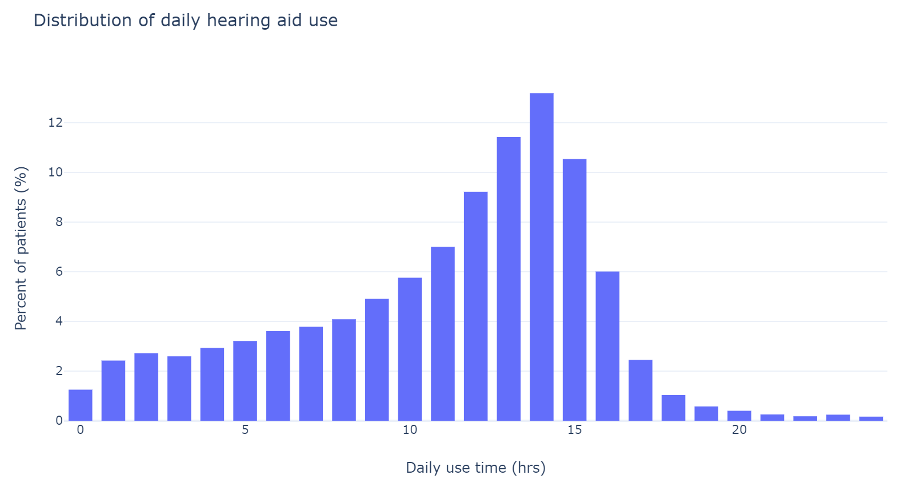
Figure 1. Histogram displaying mean daily hearing aid use of 23,402 hearing aids. In this analysis, the better hearing ear for each person was evaluated, meaning that 23,402 individuals’ hearing aid use was examined.
Distribution of Daily Hearing Aid Use: By Subgroups
Box and whisker plots for hearing aid use for the seven subgroups – gender, age, region, hearing aid style, hearing aid price point, hearing loss classification, and prior hearing aid experience – are displayed in figures 2 and 3.
There is little difference in daily use by sex or by age. There is a slight increase in median daily use for people aged 80-89 years as compared to other groups. There is some variance in use by region, with people in Africa using their hearing aids less as compared to the other regions. By device style, ITC and ITE devices have similar use time trends, which is higher than RIE, BTE, and CIC styles. There is a slight tendency for lower use with lower price points. Use time increases with hearing loss severity and experienced hearing aid users wore their hearing aids more than new users.
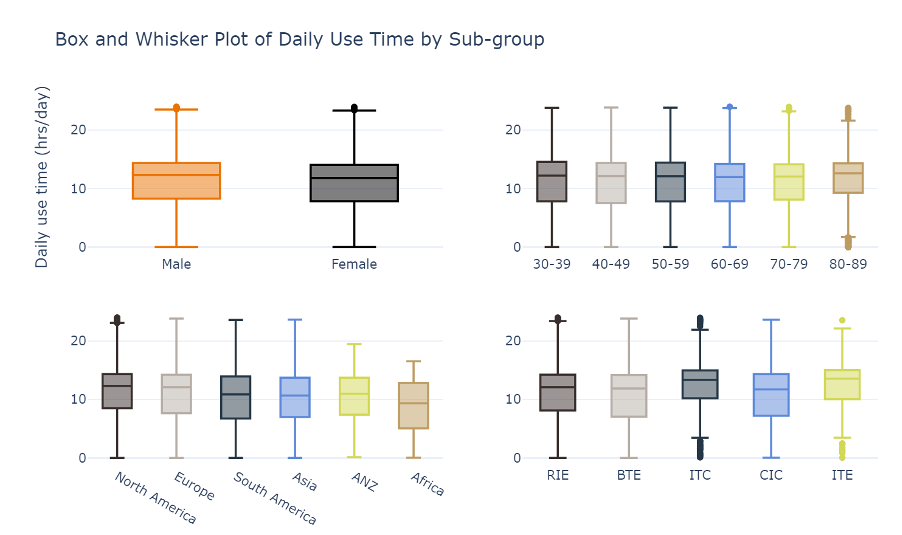
Figure 2. Box and whisker plot comparing mean daily hearing aid usage by sub-groups. Top left reflects gender, top right compares age groups, bottom left compares region and bottom right compares hearing aid style. The y-axis shows hearing aid use, ranging from 0-24 hours/day.
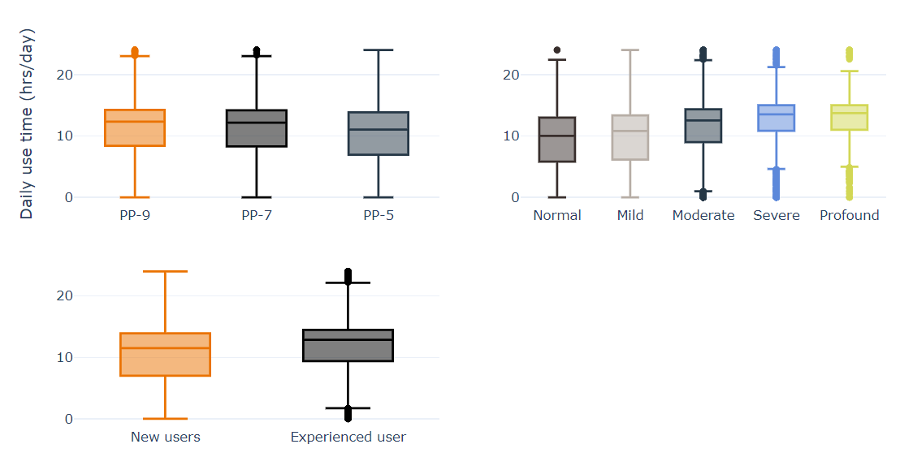
Figure 3. Box and whisker plots comparing mean daily hearing aid use for sub-groups. Top left is hearing aid price point/level of technology, top right is hearing loss classification and bottom left is hearing aid experience level. The y-axis shows hearing aid use, ranging from 0-24 hours/day.
Predictors of Hearing Aid Use
Table 2 presents the results of the independent t-tests for the seven variables, where each variable was condensed into two groups. All sub-group analysis yielded significant differences in the analysis. However, hearing loss classification, form factor and hearing aid experience were the only variables that yielded an effect size greater than 0.2, with hearing loss classification having the greatest effect. For the remaining variables – gender, age, region, and price point – the effect size was less than 0.2, suggesting that while these differences are statistically significant, they have negligible effects on hearing aid use.
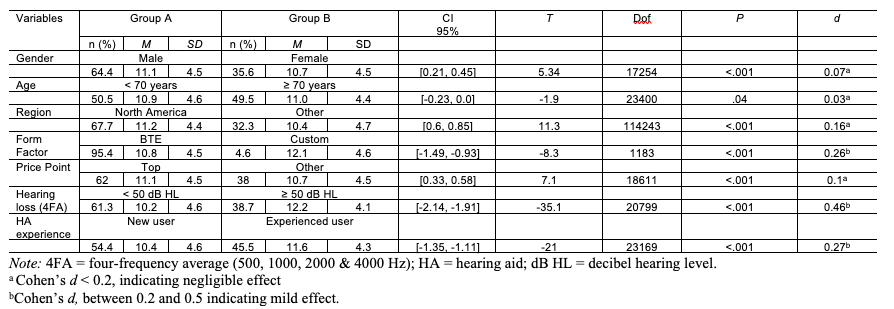
Table 2. Bivariate analysis of daily hours of hearing aid use between groups. Click on the table to view it full size in a new window.
Multiple Linear Regression
To further explore the relative contribution of the predictor we performed a multiple-linear regression analysis. The overall regression was statistically significant (R2 = .16, F(1, 23) = 89.64, p < .001). Cohen (1988) suggests an R2 value between .13 and .26 has a moderate effect. The coefficients and their corresponding significance levels are shown in table 3.
Price point surprisingly was the only variable that was non-significant across all parameters. For the remaining groups, there were features that were non-significant, such as age group (70-79), region (Asia), and form-factor (CIC). As can be seen from Table 3, all remaining features were significant. As an example of how to interpret the results, after controlling for age, gender, region, and style of hearing aid, people with normal hearing were using their hearing aids 3.7 hours less than a person with a profound hearing loss (figure 3) and women used their hearing aids 0.4 hours more than men (figure 2).
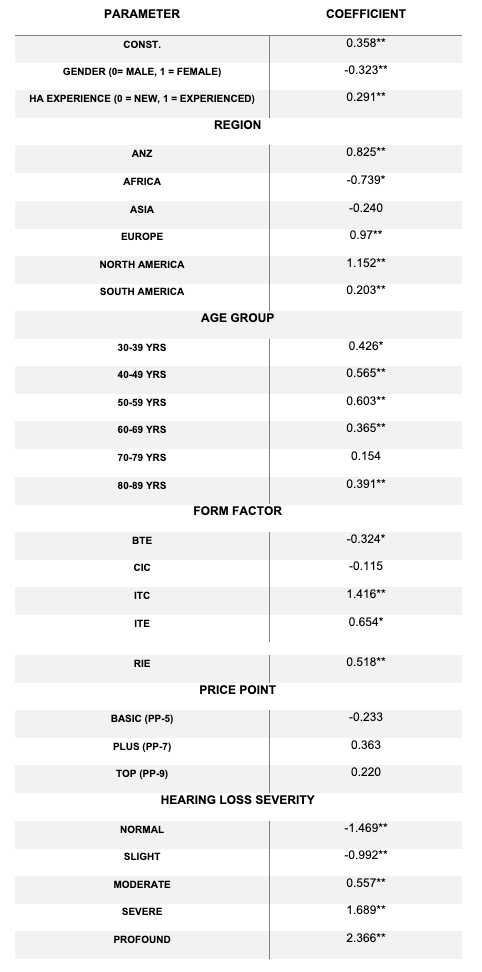
Table 3. Multiple Linear Regression with mean hearing aid use as the dependent variable. *significant at .05, **significant at .01
Discussion
Using a hearing aid has been shown to improve physical aspects of quality of life for patients with confirmed hearing loss (Kateifidis et al., 2017). Longer daily use of hearing aids has been highlighted as an indicator of improved satisfaction and benefit (Kaplan-Neeman, 2012). Degree of hearing loss, age of patient and type/level of hearing loss have been found to be indicators for satisfaction (Kateifidis et al., 2017). The data from the current study supports these trends. We aimed to explore how some of the variables associated with hearing aid use scale with a large dataset and to explore typical and atypical hearing aid use. Variables explored were limited to those available in the anonymized GN Hearing data lake – age, gender, hearing aid experience, region, price-point, hearing aid style, and hearing loss severity. Mean daily hearing aid use was the independent variable – determined through objective hearing aid data-logging. Overall, mean daily use was high among the sample, and hearing loss severity was the strongest predictor of hearing aid use. Additionally, multiple linear regression was significant, explaining some of the variance in hearing aid usage.
The mean daily use time for the entire sample of 23,402 hearing aids was 10.9 hrs/day (SD = 4.8). This is toward the higher end of daily hearing aid use, as reported through data-logging (Laplante-Lévesque et al., 2014; Pasta et al., 2021; Solheim & Hickson, 2017). To the authors’ knowledge, this is the first-time data-logging has been reported on so many devices. As one of the aims of this study was to examine typical and atypical hearing aid usage, it was somewhat surprising to see hearing aid use of more than 18 hours per day represented in the data. It must be noted that assessing hearing aid use via objective data-logging does not necessarily equal hearing aid wear time. That is, it is more likely that people who are logging hearing aid usage of more than 18 hours per day may not be aware that they are not turning the device off. It is well documented that people wearing hearing aids have difficulties with managing their devices (Bennett et al., 2018), and in the current study, we see how data-logging may be an important means for identifying people who may need additional counselling on hearing aid management. This finding is consistent with other studies that have identified data-logging is used by HCPs for hearing aid counselling (Saunders et al., 2020).
Reports of low hearing aid use, i.e., less than 1 hour per day is common within the literature (Hartley et al., 2010; Kaplan-Neeman, 2012) yet few devices in this analysis included low use. This is likely influenced by the inclusion criteria. That is, for people to be included in this analysis, they must have opened the hearing aid app on their smart phone at least twice during that time and had a Bluetooth connection between the hearing aid and the app, allowing for the data to transfer from the hearing aid to the app and then onto GNOS and the data lake. It is, therefore, more likely, that the people represented in this group are motivated and ‘active’ hearing aid users, yielding higher hearing aid usage, and people who did not use their hearing aids during this period, were not captured in the data. It is not possible within the current analysis to identify people who were not using their hearing aids during this time. Previous research reporting daily non-use varies considerably from as little as 4% (Stark & Hickson, 2004) to as high as 24% (Hartley et al., 2010), making it also challenging to infer the proportion of non-users missing in this analysis.
Both bivariate analysis and effect size of independent t-tests and multiple linear regression show most variables had a significant impact on hearing aid usage. The multiple linear regression indicated all variables except price-point were significantly associated with hearing aid use. This is expected as variables were chosen based on the literature (Laplante-Lévesque et al., 2014; Solheim & Hickson, 2017). For example, after controlling for age, gender, region and form factor, the mean difference between users with normal hearing and those with a profound hearing loss was 3.5 hours, confirming the importance of hearing loss severity. These findings help to show the relative differences across groups and indicate the complexity of predicting hearing aid use, given that only 16% of hearing aid use is explained by the variables included in the analysis. While 16% variance is a moderate effect (Cohen, 1988) it also suggests that the remaining 84% variance is linked to patient differences that were not variables in the current study. Such variables could include motivation, marital status, and/or employment (Leeuwen, 2021).
It is interesting to note that almost 7% of patients included in this sample had hearing thresholds within normal limits. In other words, more than 1600 people with what is considered clinically normal hearing were using hearing aids during the specified period. There are multiple reasons that could explain this. One is that these people could have measured hearing loss in higher frequencies (greater than 4kHz) that was not captured by the four-frequency average used as selection criteria for inclusion in the study. The dataset may also include people who use hearing aids for tinnitus management. Tinnitus status of patients was not measured in the present study and could be explored in future analyses. And finally, some patients may use hearing aids in management of hidden hearing loss.
While markets that do not have access to the cloud and remote fine tuning are not shown in the present data and we cannot control for socio-demographic status within the sample, the present study allowed for novel insights enabling the comparison of different regions within the one dataset. We already know that regional differences exist in terms of delivering hearing care and often people who must pay for the devices in part or in full are likely to be more invested and therefore use the hearing aids more (Picou, 2020). In the present study, regional differences such as delivery of hearing care, payment of hearing aids, societal acceptance of hearing aids, family support etc are probably reflected in the results but the dataset does not have the granularity to isolate these factors.
Clinical Implications, Strengths, and Limitations
There are several clinical implications from this study. First, we can see that datalogging may not always indicate wear time, given that a proportion of devices in this study have indicated very high use times (more than 18 hrs/day). It is likely these patients need counselling on how to turn on and off their hearing aids. We also see that some variables known to influence hearing aid use are not covered in this study, such as motivation and marital status etc.
While this study included a large sample of hearing aids, it is clear the sample is heavily biased. That is, the data only represents people who have consented for GN Hearing to process their data and moreover, the sample mainly reflected RIE users from North America, as compared to other regions or form factors. It also only includes people who have a smart phone and used a GN Hearing A/S app connected to their hearing aid during the specified time-period. It is probable that other people were actively using their hearing aids during the same time, but did not use the app; therefore, their data is not reflected. In other words, the sample could be categorized as ‘active app users.’
Conclusion
Big data is a useful tool for exploring how known audiological and non-audiological factors scale and influence hearing aid use and, as expected, hearing loss severity had the strongest effect on hearing aid use. However, solely relying on big data has limitations as the data is often highly biased and misses important elements that would contribute to understanding hearing aid usage behaviors.
References
Bennett, R. J., Laplante-Lévesque, A., Meyer, C. J., & Eikelboom, R. H. (2018). Exploring Hearing Aid Problems: Perspectives of Hearing Aid Owners and Clinicians. Ear and Hearing, 39(1), 172–187. https://doi.org/10.1097/AUD.0000000000000477
Bisgaard, N., Zimmer, S., Laureyns, M., & Groth, J. (2021). A model for estimating hearing aid coverage world-wide using historical data on hearing aid sales. International Journal of Audiology, 1-9. https://doi.org/10.1080/14992027.2021.1962551
Brydges, C. R. (2019). Effect Size Guidelines, Sample Size Calculations, and Statistical Power in Gerontology. Innovation in Aging, 3(4), igz036. https://doi.org/10.1093/geroni/igz036
Christensen, J. H., Saunders, G. H., Havtorn, L., & Pontoppidan, N. H. (2021). Real-World Hearing Aid Usage Patterns and Smartphone Connectivity. Front. Digit. Health, 3:722186. doi: 10.3389/fdgth.2021.722186
Cohen, J. (1988). Statistical power analysis for the behavioral sciences. Lawrence Erlbaum Associates. Hillsdale, NJ, 20-26.
Davenport, T. H., Barth, P., & Bean, R. (2012). How 'big data' is different. MIT Sloan Review, 54(1).
Gallagher, N. E. & Woodside, J. V. (2018). Factors affecting hearing aid adoption and use: A qualitative study. Journal of the American Academy of Audiology, 29(4), 300-312.
Gopinath, B., Schneider, J., Hartley, D., Teber, E., McMahon, C. M., Leeder, S. R., & Mitchell, P. (2011). Incidence and predictors of hearing aid use and ownership among older adults with hearing loss. Annals of Epidemiology, 21(7), 497-506.
Hartley, D., Rochtchina, E., Newall, P., Golding, M. & Mitchell, P. (2010). Use of hearing AIDS and assistive listening devices in an older Australian population. Journal of the American Academy of Audiology, 21(10), 642-653.
Hickson, L., Meyer, C., Lovelock, K., Lampert, M., & Khan, A. (2014). Factors associated with success with hearing aids in older adults. International journal of audiology, 53(sup1), S18-S27.
World Health Organization. (1991). Report of the informal working group on prevention of deafness and hearing impairment Programme planning, Geneva, 18-21 June 1991 (No. WHO/PDH/91.1. Unpublished).
Jenstad, L., & Moon, J. (2011). Systematic review of barriers and facilitators to hearing aid uptake in older adults. Audiology Research, 1(1), 91-96.
Kaplan‐Neeman, R. (2012). Hearing aid satisfaction and use in the advanced digital era. The Laryngoscope, 122(9), 2029-2036.
Kateifidis, N., Sarafis, P., Malliarou, M., Tsounis, A., Bamidis, P., & Niakas, D. (2017). Quality of life and satisfaction among patients who use hearing aids. Global Journal of Health Science, 9(6), 177-83. https://dx.doi.org/10.5539/gjhs.v9n6p177
Laplante-Lévesque, A., Nielsen, C., Jensen, L. D., & Naylor, G. (2014). Patterns of hearing aid usage predict hearing aid use amount (data logged and self-reported) and overreport. Journal of the American Academy of Audiology, 25(2), 187–198. https://doi.org/10.3766/jaaa.25.2.7
McCormack, A. & Fortnum, H. (2013). Why do people fitted with hearing aids not wear them?" International Journal of Audiology, 52(5), 360-368.
Mellor, J., Stone, M., & Keane, J. (2018). Application of Data Mining to a Large Hearing-Aid Manufacturer’s Dataset to Identify Possible Benefits for Clinicians, Manufacturers, and Users. Trends In Hearing, 22, 1-15. DOI 0.1177/2331216518773632
Ng, J. H. Y., & Loke, A. Y. (2015). Determinants of hearing-aid adoption and use among the elderly: A systematic review. International Journal of Audiology, 54(5), 291-300.
Pasta, A., Szatmari, T. I., Christensen, J. H., Jensen, K. J., Pontoppidan, N. H., Sun, K., & Larsen, J. E. (2021). Clustering Users Based on Hearing Aid Use: An Exploratory Analysis of Real-World Data. Frontiers in Digital Health, 3, 725130. https://doi.org/10.3389/fdgth.2021.725130
Picou, E. M. (2020, February). MarkeTrak 10 (MT10) survey results demonstrate high satisfaction with and benefits from hearing aids. In Seminars in Hearing (Vol. 41, No. 01, pp. 021-036). Thieme Medical Publishers.
Pouyandeh, M. H., & Hoseinabadi, R. (2019). Factors Influencing the Hearing Aids Use and Satisfaction: A Review Study. Journal of Modern Rehabilitation, 13(3), 37-146.
Saunders, G. H., Bott, A., & Tietz, L. (2020). Hearing Care Providers' Perspectives on the Utility of Datalogging Information. American Journal of Audiology, 29(3S), 610–622. https://doi.org/10.1044/2020_AJA-19-00089
Saunders, G. H., Dillard, L. K., Zobay, O., Cannon, J. B., & Naylor, G. (2021). Electronic Health Records As a Platform for Audiological Research: Data Validity, Patient Characteristics, and Hearing-Aid Use Persistence Among 731,213 U.S. Veterans. Ear and Hearing, 42(4), 927–940. https://doi.org/10.1097/AUD.0000000000000980
Saunders, G. H., Frederick, M. T., Silverman, S. C., Nielsen, C., & Laplante-Lévesque, A. (2016). Health behavior theories as predictors of hearing-aid uptake and outcomes. International Journal of Audiology, 55(Supp3), 59-68.
Sciacca, A., Meyer, C., Ekberg, K., Barr, C., & Hickson, L. (2017). Exploring audiologists' language and hearing aid uptake in initial rehabilitation appointments. American Journal of Audiology, 26(2), 110-118.
Simpson, A. N., Matthews, L. J., Cassarly, C., Dubno, J. R. (2019). Time From Hearing-aid Candidacy to Hearing-aid Adoption: a Longitudinal Cohort Study. Ear and Hearing, 40(3), 468-476.
Singh, G., & Launer, S. (2018). Time of Day and Hearing Aid Adoption. Trends in Hearing, 22, 2331216518769789. https://doi.org/10.1177/2331216518769789
Solheim, J., & Hickson, L. (2017). Hearing aid use in the elderly as measured by datalogging and self-report. International Journal of Audiology, 56(7), 472–479. https://doi.org/10.1080/14992027.2017.130320
Stark, P., & Hickson, L. (2004). Outcomes of hearing aid fitting for older people with hearing impairment and their significant others. International Journal of Audiology, 43, 390-398.
van Leeuwen, L. M., Goderie, T., van Wier, M. F., Lissenberg-Witte, B. I., Lemke, U., & Kramer, S. E. (2021). Uptake of Hearing Aids and Hearing Assistive Technology in a Working Population: Longitudinal Analyses of The Netherlands Longitudinal Study on Hearing. Ear and hearing, 42(4), 793–802.
Vestergaard Knudsen L, Öberg M, Nielsen C, Naylor G, Kramer SE. Factors Influencing Help Seeking, Hearing Aid Uptake, Hearing Aid Use and Satisfaction With Hearing Aids: A Review of the Literature. Trends in Amplification. 2010;14(3):127-154. doi:10.1177/1084713810385712
Wong, L.N., Hickson, L. and McPherson, B. (2003). Hearing aid satisfaction: what does research from the past 20 years say? Trends in Amplification, 7(4), 117-161.
Citation
Bott, A., Piechowiak, T., Groth, G., & Thunberg Jespersen, C. (2022). What big data has to say about individual differences in hearing aid use: insights from GN online services (Gnos). AudiologyOnline, Article 28295. Available at www.audiologyonline.com