
Learning Outcomes
After this course, learners will be able to:
- Describe candidacy criteria and study design from the US clinical trial on Electric-Acoustic Stimulation (EAS).
- Explain important speech perception outcomes for subjects in the US clinical trial.
- Describe outcomes for hearing sensitivity post-operatively from the clinical trial.
Introduction
Dr. Allison Racey: Today we're going to review MED-EL's recently completed Electric-Acoustic Stimulation (EAS) Clinical Trial, for which we received FDA approval. First, we will talk a little bit about the study itself, including the sites that were involved, as well as the design of the study. We'll discuss the results that we found in that clinical trial and review some comparison data between the MED-EL EAS clinical trial and the Cochlear Hybrid clinical trial. Once I've completed this discussion, I'll hand it over to Dr. Meg Dillon from the University of North Carolina, who will talk about the UNC experience, as well as some additional EAS findings.
EAS Study Review
The purpose of the clinical trial was to determine the safety and effectiveness of MED-EL electric acoustic stimulation cochlear implant system. This was an FDA regulated multicenter clinical trial which took place at 14 experienced cochlear implant centers across the United States.
Candidacy Inclusion Criteria
We were specifically looking for subjects who had sensorineural hearing loss. We enrolled subjects who were between ages of 18 and 70 at the time of implantation. Subjects in the clinical trial had normal to moderate hearing loss in the low-frequencies. In other words, they had hearing thresholds anywhere from zero dB through 1500, down to 65 dB at 250 and 500 or beyond in the mid-frequencies. In the high-frequencies, clinical trial subjects had a severe to profound hearing loss. This is truly that ski slope type of sloping hearing loss that we often see. Subjects were required to have 60% or less in the best aided condition on CNC words in quiet in order to enroll in the study. They also needed to have experience with hearing aids. This could mean that either they came in to the clinic wearing a hearing aid, or if they hadn't worn hearing aids for quite some time, they needed to complete a month-long hearing aid trial prior to enrolling in this study. Additionally, all of the subjects spoke English as their primary language.
Figure 1 shows an audiogram of the type of subjects that we targeted. Again, with the low frequency hearing from a normal to moderate degree, and then sloping into that severe to profound hearing loss in the high frequencies, with zero to 60% on CNC words in the best aided condition.
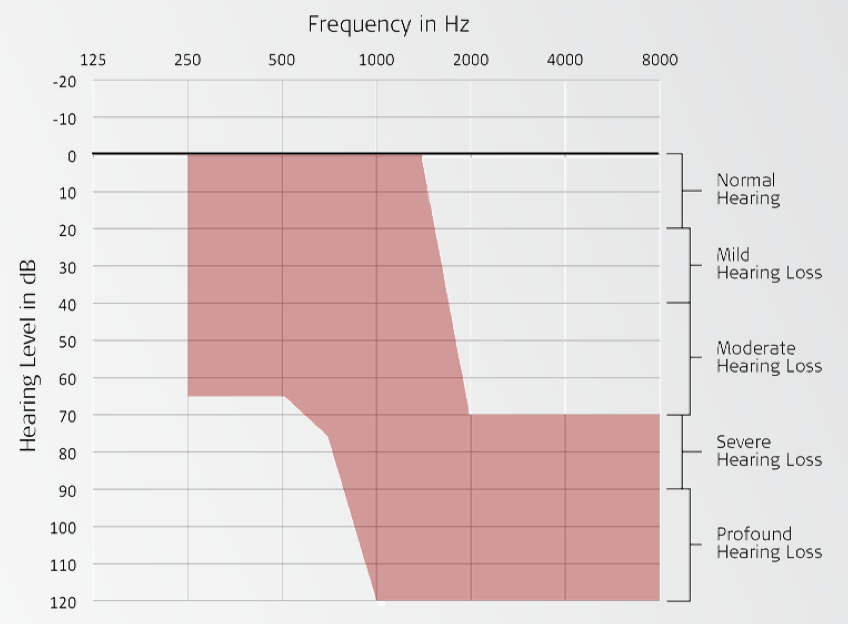
Figure 1. Candidacy inclusion criteria: sample audiogram.
Candidacy Exclusion Criteria
Anyone with evidence of a conductive or retrocochlear hearing loss was excluded from enrolling in the study. The inclusion criteria was quite strict because this was an FDA study. We didn't want any subjects who had an asymmetric hearing loss, which meant that their thresholds had to be within 20 dB between two ears. Additionally, we didn't want any subjects who had a fluctuating hearing loss. If there happened to be a change in hearing, we wanted to be able to pinpoint that it was due to participating in the clinical trial and implantation, as opposed to a naturally progressive hearing loss. We define fluctuation as greater than 10 dB at two or more frequencies within the last two years in either ear. We also did not include subjects who had any developmental delays, or had any physical or geographical limitations that would preclude their ability to follow protocol.
Clinical Trial Devices
The implants used in the clinical trial were either the PULSAR or the SONATA implant. The electrode used at the time was the FLEXEAS, which is now known as the FLEX24. We used DUET Audio Processor, which was the first generation EAS Processor from MED-EL. It was digitally programmable and uses an ear mold as a means to couple the device to the ear. It was in programmed in CI Studio programming software, which is not our current version but that's what we were using at the time for the DUET Processor. However, when we submitted to the FDA for EAS, we did receive approval for our newer generation devices, such as the CONCERT and SYNCHRONY implants, the FLEX24 electrode, and the DUET2 and SONNETEAS processors, which will now be programmed in MAESTRO.
Study Design
In terms of the protocol, the main test that we used was sentences in noise, specifically the CUNY sentence test. In order to determine the signal-to-noise ratio that was used for CUNY sentences, we completed a decision tree at three months for each subject. At three months, each subject was tested at +10 dB SNR and if they scored worse than 50%, then +10 was used moving forward. If they scored better than 50%, then +5 was tested. Again, we repeated the process: worse than 50%, they stayed at +5; better than 50%, they used zero moving forward. We also tested words in quiet, specifically CNC words which, again, was used for inclusion criteria. Of course, we wanted to see how that turned out postoperatively.
We tested three different primary conditions:
- Hearing aids pre-operatively (in order to get a sense of the subject’s starting point)
- Electric and acoustic stimulation (EAS), post-operatively
- Electric stimulation only
Subjective responses were recorded using two questionnaires: the APHAB (Abbreviated Profile of Hearing Aid Benefit) and the HDSS (Hearing Device Satisfaction Scale). The APHAB looks at subjects' perceived benefit, while the HDSS specifically looks at patient satisfaction. The end point that we used for the study was 12 months. Subjects were followed through 12 months’ post activation of the EAS device.
In our study, we wanted to answer three primary questions:
- Do subjects perform better with EAS than they did with hearing aids pre-operatively? We want to make sure that if we are implanting subjects and providing them with EAS, that they are going to do better than they were before surgery.
- If a subject were to lose hearing, would they perform better with electric stimulation only than they did with hearing aids pre-operatively? Even in a worst-case scenario, are we still providing the patient with something that's better than what they had pre-op?
- Do subjects perform better with combined electric and acoustic stimulation (EAS) than they do with electric stimulation only? Are we giving the patient a benefit by using EAS, compared to providing them with a traditional cochlear implant?
Results
A total of 73 subjects were implanted in the clinical trial. We had 67 subjects who made it to the 12-month end point. During the course of the study, we had three subjects who withdrew and two who were lost to follow-up. At the time that this data was analyzed and submitted to the FDA, we had one subject who was still undergoing testing. The average age at implantation was 53.7 years, and there was a relatively equal split between male and female subjects, with 42.5% male and 57.5% female.
With regard to our first question, if subjects would perform better with EAS than they did preoperatively with hearing aids, the answer was a resounding yes (Figure 2). Subjects went from a pre-operative baseline of 31% correct on sentences in noise, up to 73% with EAS at the 12-month interval. There was a significant improvement in scores as early as three months, and those scores continued to improve to the 12-month end point, with a 42-percentage point improvement at 12 months.
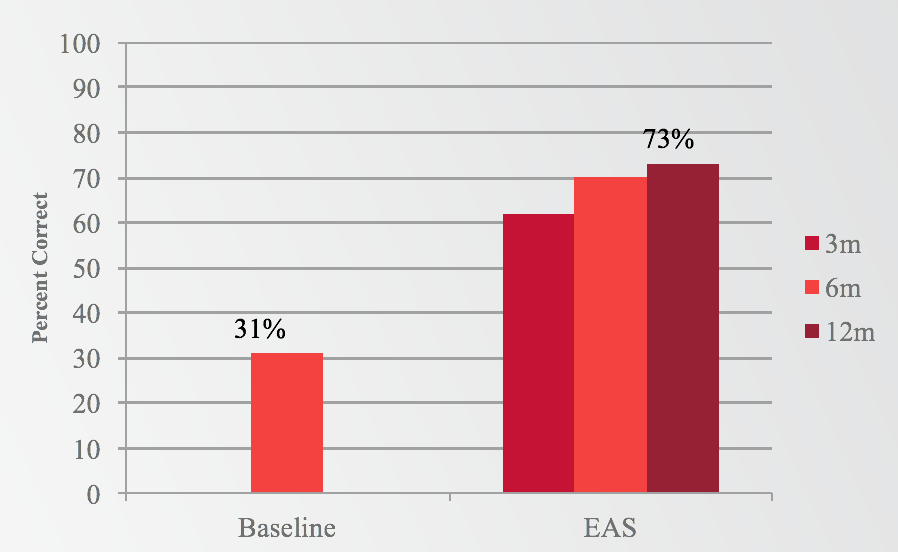
Figure 2. Results: Sentences in Noise (EAS).
If we look at the same question, comparing EAS to preoperative looking at CNC words in quiet, we see a very similar pattern (Figure 3). We have a 30% preoperative baseline with hearing aids, which increased to 67% with EAS at 12 months. Again, we saw a huge jump as early as three months, continuing to improve slightly out through 12 months.
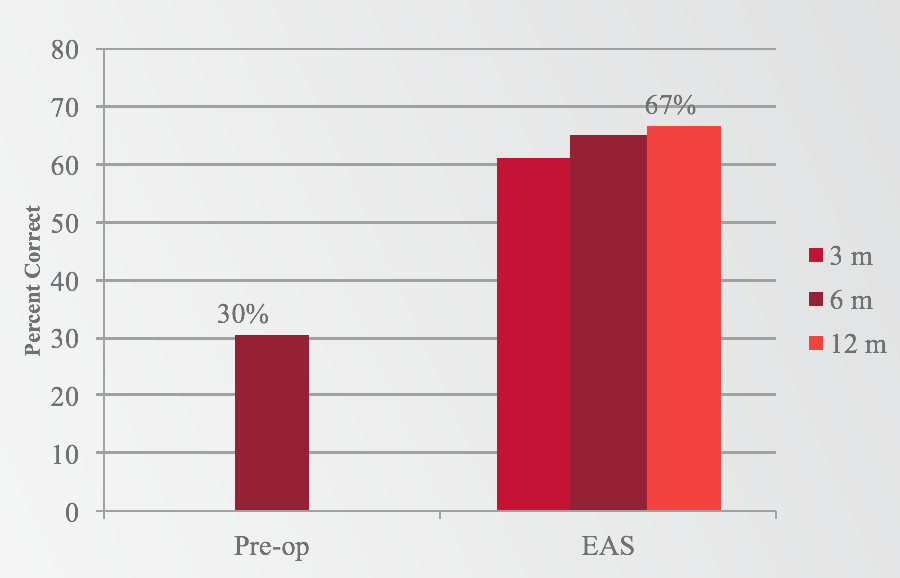
Figure 3. Results: Words in quiet (EAS).
The second question to be addressed was whether a subject who lost residual hearing would still perform better postoperatively than they did preoperatively with hearing aids. Subjects showed significant improvement in the cochlear implant alone condition at 12 months, going from 30% preoperatively to 48% at 12 months with electric stimulation only (Figure 4).
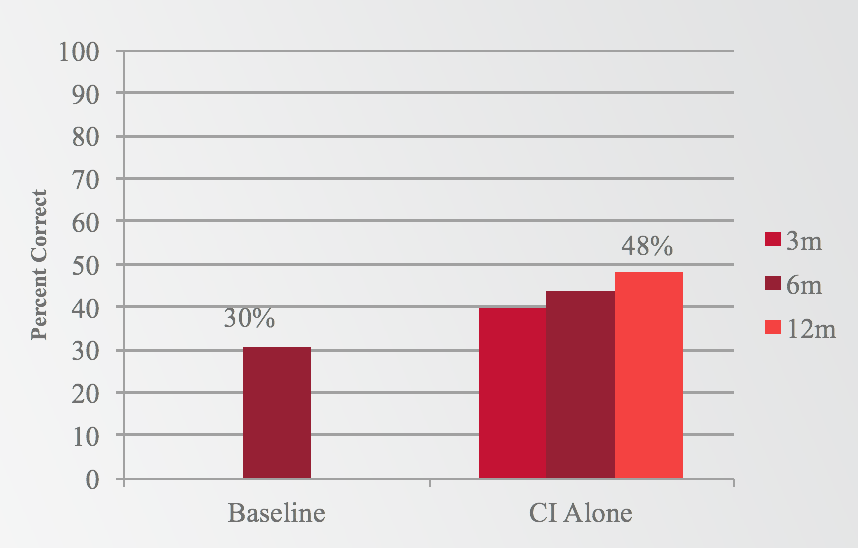
Figure 4. Results: Words in quiet (electric only).
You might be thinking that 48% seems a bit lower that what you would expect to see with your better performing cochlear implant subjects. Meg Dillon will expand on this further coming up shortly. In 2016, Dr. Dillon analyzed whether or not subjects would perform better if they listened to a familiar map, as opposed to a full frequency map that was unfamiliar. One caveat about the study design was that when subjects were tested in the cochlear implant alone condition, it was in a map that they were not used to listening. As such, those scores could be poorer than we would expect to see, because they were essentially tested acutely. Dr. Dillon's data suggests that in fact, if subjects listen to a map that they're familiar with, as in the truncated condition, there is a significant improvement, compared to the full frequency map with which they're unfamiliar. We could interpolate from this that perhaps scores would be a little bit more in line with what we would expect to see, had the subjects been familiar with that map.
When we look at the third question, comparing electric stimulation only to EAS, the results indicate improvement when adding acoustic stimulation, as opposed to listening to electric stimulation only (Figure 5). At all three intervals (three, six, and 12 months), you can see a significant improvement in the EAS condition as compared to the cochlear implant alone condition. Not only is the EAS condition better than the preoperative-aided condition, but in fact, the EAS condition is the best listening condition for these subjects. They're performing better with EAS than with the cochlear implant alone and better than preoperatively.
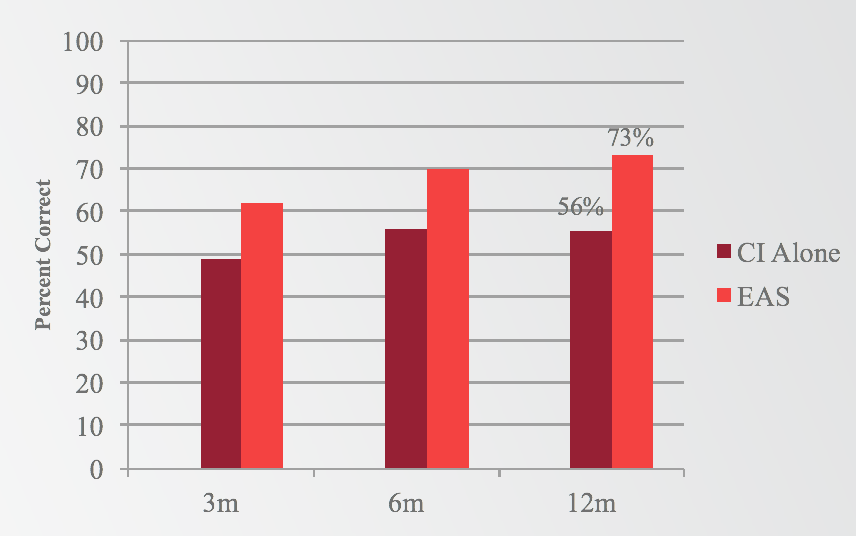
Figure 5. Results: Sentences in noise (electric v. EAS).
APHAB and HDSS
We also saw positive results reflected in the subjective questionnaires. On the APHAB, 90% of subjects reported benefit from EAS, and 92% of subjects reported improvement in hearing in background noise. Overall, subjects experienced a significant improvement of over 30 percentage points on the APHAB at the 12-month interval, compared to the preoperative interval. On the HDSS, 86% of subjects reported increased satisfaction with EAS, as compared to their preoperative hearing aids.
Hearing Sensitivity
We can assess hearing sensitivity in a couple of different ways. The first would be to look at the number of subjects who were able to be fit with the acoustic unit postoperatively. For our clinical trial, that meant that there needed to be low frequency thresholds that were better than 80 dB post-op. We found that 97% of the subjects in the clinical trial (71 of the 73 subjects), had enough hearing postoperatively that they were able to use the acoustic component.
Another way to look at hearing sensitivity includes analyzing the low-frequency pure-tone average in one of three ways:
- The average overall pure-tone shift in the low frequencies for the entire group
- The proportion of subjects experiencing a particular degree of PTA shift at 12 months
- The degree of low-frequency residual hearing loss subjects experienced post-implantation
It should be noted that our low-frequency pure-tone average included 250, 500, 750, and 1000 Hz. While you may see 125 Hz reflected in other research, we did not collect 125 Hz as part of our study.
If we first look at the group average low-frequency (LF) pure tone average (PTA) shift at 12 months, the average was 24 dB, again at 250, 500, 750 and 1000 Hz. Looking at the audiogram in Figure 6, it shows the average threshold at pre-op, as well as the average threshold at 12 months. That is for the entire group of 67 subjects who made it to the 12-month interval. That does include the two subjects who lost hearing immediately following surgery and were unable to be fit with the acoustic unit.
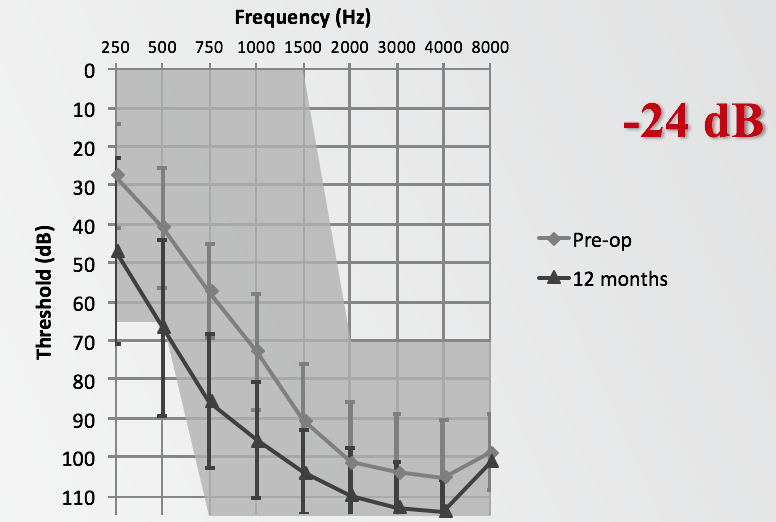
Figure 6. Group average LF-PTA shift at 12 months.
Of the 67 subjects who made it to the 12-month interval, 79% of them had less than 30 dB change in the low-frequencies. In the table in Figure 7, indicated by the bright red box, eight of the 67 subjects (12%) experienced less than 10 dB, 25 of them (37%) fell between 10 and 20 dB, and 20 subjects (30%) were between 20 and 30 dB, bringing the total to 79%.
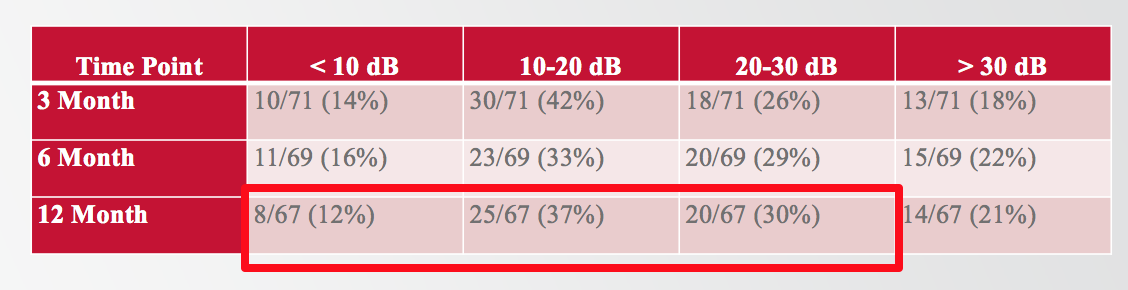
Figure 7. Proportion of subjects experiencing a particular degree of PTA shift at 12 months.
If we talk about the percentage of subjects with a particular degree of residual hearing postoperatively, 88% of the subjects in the clinical trial experienced residual hearing better than a profound degree (Figure 8). At 12 months, 88% ended up with low-frequency PTA in the mild to severe range, and only 12% of subjects experienced a profound hearing loss.
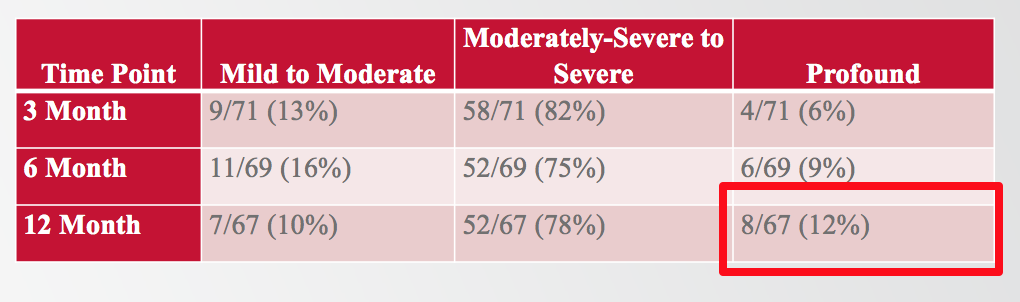
Figure 8. The degree of low-frequency residual hearing loss subjects experienced post-implantation.
There were two subjects who lost hearing immediately following surgery and were unable to use the acoustic unit (Figure 9). For one subject, preoperatively they were scoring 28% on CNCs, and 0% on CUNY sentences in noise. At 12 months, these scores improved significantly to 46% on CNC and 63% on CUNY sentences in noise. We saw similar results with the second subject, going from 26% to 74% on CNCs, and from 19% to 97% on CUNY sentences in noise. These results demonstrate that even if someone were to lose residual hearing in that worst-case scenario, we would still expect to see improvement in performance postoperatively.
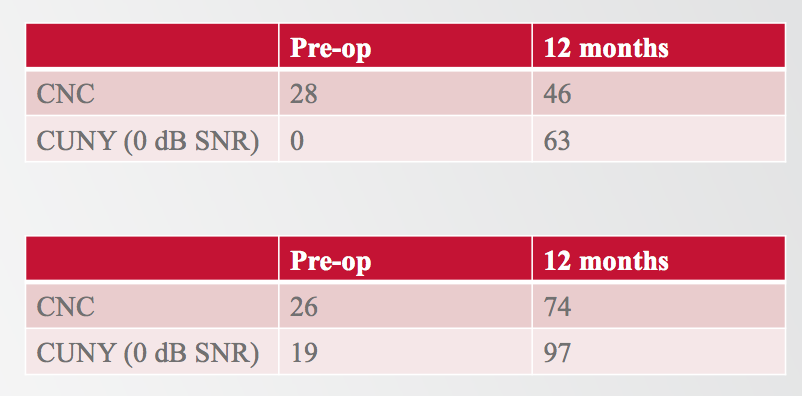
Figure 9. Two subjects could not use the acoustic unit.
MED-EL EAS vs. Cochlear Hybrid
Now, we will discuss the MED-EL electrical-acoustic stimulation clinical trial as compared to the cochlear hybrid study. There were 73 subjects implanted in the EAS study and 50 subjects implanted in the Hybrid study. The clinical trial for Hybrid used the L24 electrode and all subjects were implanted with a cochleostomy, whereas in the EAS study we had a majority of subjects implanted via Round Window and about a quarter implanted with a cochleostomy. For EAS, the insertion depths were 18- to 20-millimeters, compared to a 16-millimeter insertion depth for the Hybrid. With the EAS study, we followed our subjects out to 12 months, compared to six months for the Hybrid study.
In Figure 10, you can see the candidacy audiograms for both studies. They appear relatively similar, both with a normal-to-moderate low-frequency hearing loss, sloping to severe-to-profound in the high frequencies. One difference of note is that the cochlear Hybrid study collects 125 Hz, whereas with EAS we only measured down to 250 Hz.
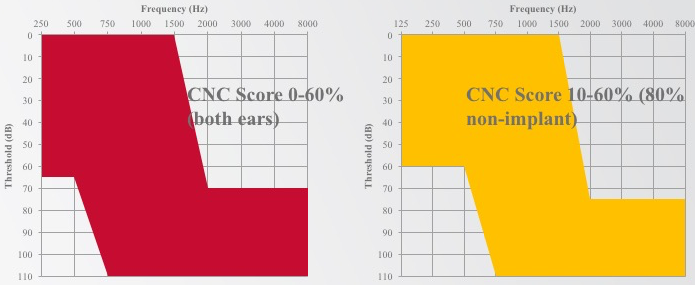
Figure 10. Candidacy audiograms.
When we take a look at CNC words in quiet, we find an extremely similar improvement overall. There is a 36% improvement for Hybrid and a 37% improvement for EAS. With sentences in noise, EAS subjects experienced to 42% percentage point improvement with variable SNR. In the end, 73% of subjects were tested at 0 dB, so the majority made it down to that 0 dB signal-to-noise ratio. For Hybrid, there was a 32-percentage point improvement.
The area where MED-EL stands out is with hearing sensitivity (Figure 11). If we take a look at the average low-frequency shift at 12 months (comparing 12 months for EAS to 12 months for cochlear Hybrid), we see an average of 24 dB from MED-EL and a 33.8 dB shift downward for the Hybrid subjects. It definitely appears that there is a difference in terms of the amount of low-frequency shift that is experienced by the group at 12 months.
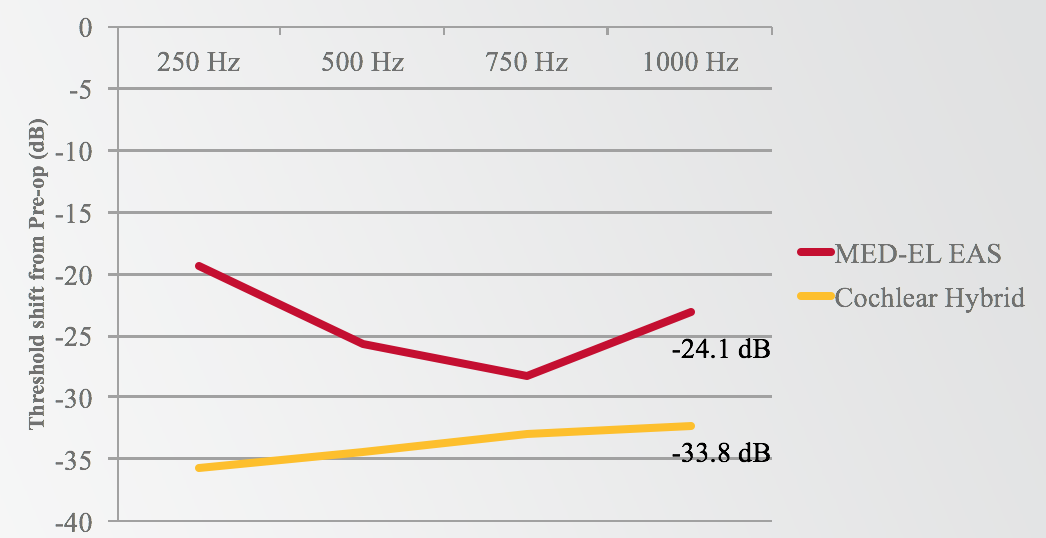
Figure 11. MED-EL EAS vs. Cochlear Hybrid: low-frequency shift at 12 months.
Comparing the preoperative hearing thresholds for both MED-EL and Cochlear to the 12-month thresholds for both groups, they are remarkably similar (Figure 12). On the graph, those two lines are almost right on top of each other. However, if you look at the post-op hearing at 12 months, there are better hearing thresholds in the MED-EL group than in the Cochlear group.
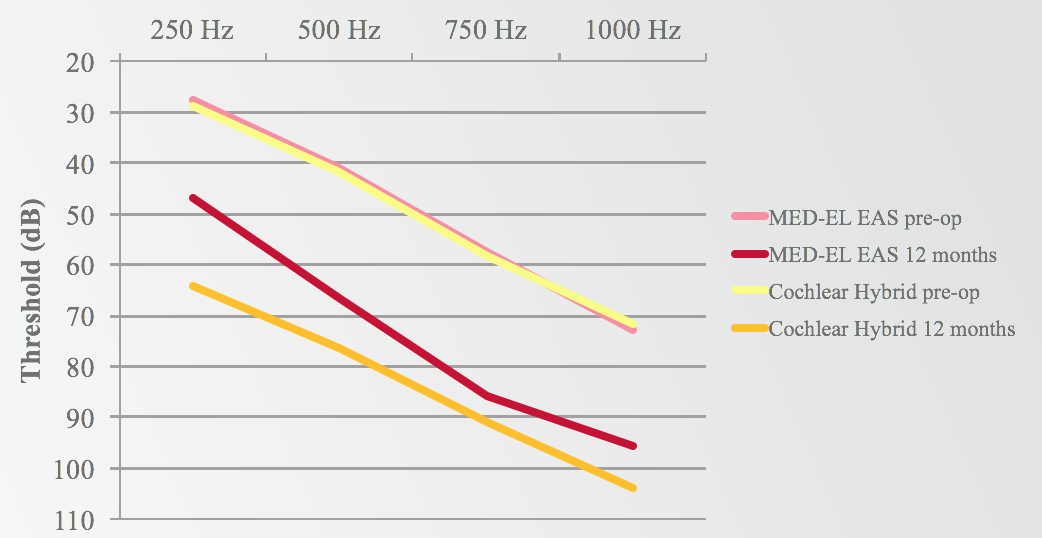
Figure 12. MED-EL EAS v. Cochlear Hybrid: low-frequency shift
Earlier, we stated that 97% of MED-EL subjects could use the acoustic component post-implantation. For Cochlear, that percentage was 66%. With MED-EL, 12% of subjects experienced a total or profound hearing loss reported at the time of submission. For Cochlear, 44% of their subjects experienced total or profound hearing loss at the time of submission. Finally, the proportion of subjects who experienced a particular degree of low-frequency PTA shift, 79% of MED-EL subjects experienced less than a 30 dB shift in the low-frequencies, while 59% of Cochlear subjects experienced a less than 30 dB shift.
Adverse Events
Another way that we can talk about the study outcomes is through adverse events. An adverse event (AE) is any unexpected medical occurrence in a patient or clinical investigation. For example, it could involve things like tympanograms being abnormal, a tinnitus increase after surgery, or temporary vertigo; issues that are commonly experienced with cochlear implants.
Figure 13 shows that in the MED-EL EAS clinical trial, there were 35 adverse events reported in 29 subjects (40%). In the Hybrid trial, 65 adverse events were reported in 34 subjects (68%). The most important adverse event that FDA wanted to have reported was profound or total hearing loss. For EAS, we only had eight of those cases reported, whereas Cochlear had 22 reported. In the EAS clinical trial, we collected adverse events for over eight years. Hybrid collected adverse event data for about four years prior to their submission.
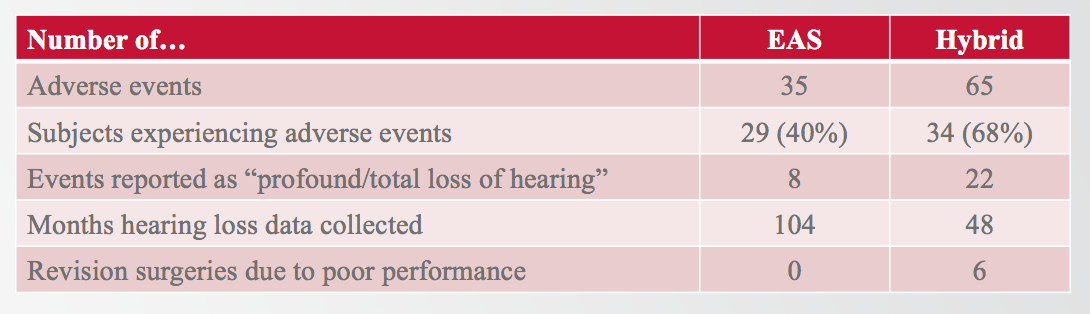
Figure 13. MED-EL EAS v. Cochlear Hybrid: adverse events
It is important to note that in the cochlear Hybrid trial, six subjects were explanted and then reimplanted due to poor performance with the implant. In the MED-EL EAS clinical trial, we had no subjects who required explantation and reimplantation due to poor performance. If you are curious about the sources of any of this information, I have included my references in the handout that accompanies this presentation.
Ten Years of Electric-Acoustic Stimulation Experience:
What We Know Now
Dr. Margaret Dillon: Our team at UNC (comprised of physicians, researchers and cochlear implant audiologists) participated in the electric acoustic stimulation cochlear implant trial starting in 2006. For this particular trial, we were working with adult subjects, however we did receive a compassionate use for a patient that was outside of that age limitation.
In the shaded region of Figure 14, you can see the unaided thresholds for patients that we were seeking as part of the candidacy criteria. Again, we needed people who had a symmetrical hearing loss in both ears. We were using the FlexEAS electrode, which is now known as the Flex24 array, and using the DUET processor, which is very similar to that older generation that we were using at the time.
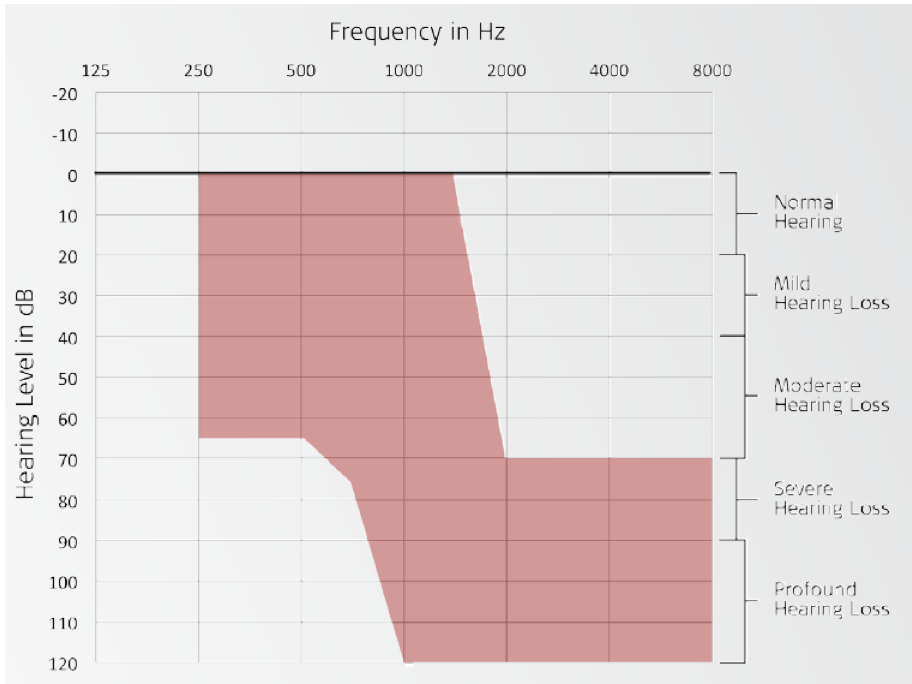
Figure 14. Unaided thresholds: candidacy criteria.
Our protocol was to assess any residual hearing at each interval, as well as to assess aided speech perception performance in quiet (CNC words) and in noise (CUNY sentences). In addition, we administered quality of life questionnaires to the patients. We did these measures at the pre-operative interval. We then saw the subjects one month after surgery for cochlear implant activations. We did not activate the acoustic portion at that time; we allowed them a chance to get used to electric stimulation. They came back one to two months later, at which time we activated the acoustic portion. This is when we considered them EAS. We followed the subjects three, six, and 12 months after the initial EAS activation.
UNC Cohort
We had 33 patients enrolled at our center, with a minimum age of 20.2 years and a maximum age of 76.6. For the clinical trial, the uppercut for age at implantation was 70 years. However, we had a patient that presented to our clinic in her late 70s, but yet an excellent candidate for this clinical trial. With the help of MED-EL, we submitted a compassionate use to the FDA for her enrollment in the clinical trial and we were able to follow her performance as well. Our average age at implantation was 55.8 years, which is very similar to what Dr. Racey reported as the average age of implantation in the large study cohort. One thing to consider is that this is a relatively young cohort as compared to most practices' average age for their adult population. Specifically, at UNC, our average age at implantation is 71 years of age.
With regard to residual hearing, we have plotted the low-frequency pure tone average, which was 250, 500, and 750 Hz (Figure 15). We documented the minimum, maximum and average at each of these intervals: pre-operative, initial CI activation, six months, 12 months, and two years (beyond the study protocol). In the last column, we have documented the change in relation to the previous interval. In other words, how much did the hearing change between the pre-operative stage to initial cochlear implant activation, and from the initial cochlear implant activation to the six-month interval, etc.
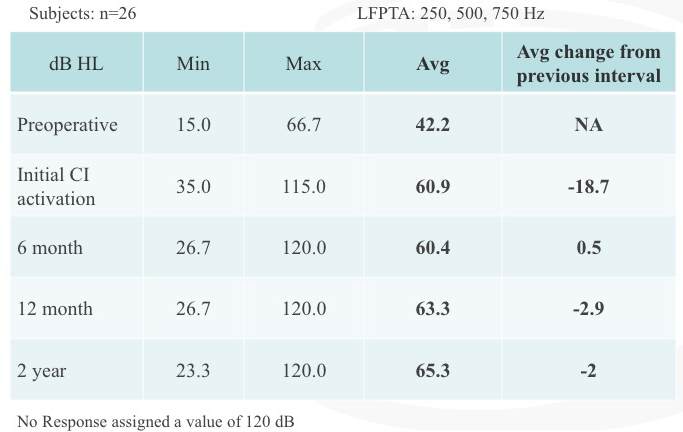
Figure 15. Residual hearing: low-frequency PTA.
When we measured residual hearing, it was always at the start of the appointment. At every interval, we would test residual hearing. If it was an interval after activation of the cochlear implant, then we would test speech perception performance, and then we would map the patient. It is noteworthy to point out that the biggest change in residual hearing occurred between the pre-operative stage and initial activation interval. At the six month, 12 month and two year intervals after CI activation, we measured small changes that were not considered to be significant.
Figure 16 shows our speech perception results for CUNY sentences that Adunka and colleagues reported back in 2013. As part of the trial, we tested patients in the hearing aid alone condition (blue), the cochlear implant alone condition (red), and in the combined condition (green). We would change the frequency filters for each condition so that subjects would be listening to an unfamiliar map.
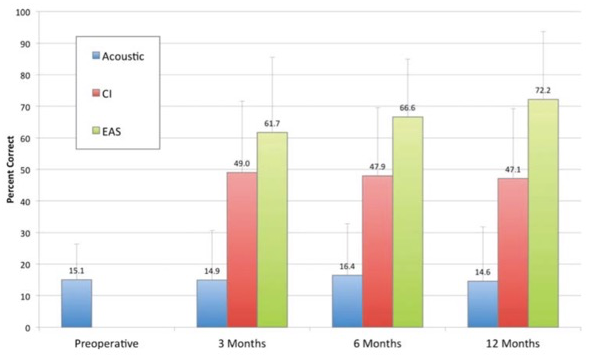
Figure 16. Speech perception (CUNY sentences).
First, if you look at the acoustic or the hearing aid alone condition over time, you don't see a change in speech perception performance. Next, we see a jump in speech perception performance with the cochlear implant alone, with a significant improvement occurring at that three-month interval. It was exciting to see how quickly they acclimated to this signal and improved in speech perception performance. Again, you can see that the combination of acoustic and electric stimulation (EAS) is the best condition over time, with subjects experiencing a significant improvement in speech perception performance, even within that early listening experience.
To obtain quality of life data, we used the APHAB. For this questionnaire, patients were asked to rank their level of difficulty in different tasks. When scoring the APHAB, we look at each of the following areas: ease of communication, reverberation, background noise, aversiveness and global (global takes into account everything except aversiveness). A lower value indicates perceived better performance (Figure 17). The blue bar represents what subjects reported preoperatively with conventional amplification. The light gray bar is how they felt they were doing at initial EAS, after one month of listening experience with their cochlear implant. In the bars with increasingly darker shades of gray are three months, six months, and 12 months of listening experience with EAS.
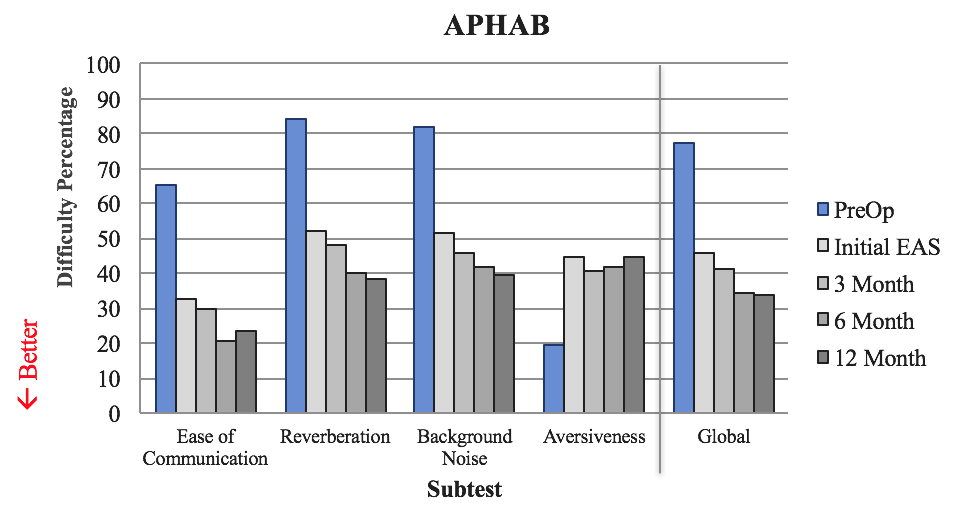
Figure 17. Quality of life: APHAB.
Subjects reported a significant improvement in ease of communication with this device, as compared to what they were experiencing with conventional amplification. We also see improvements on the reverberation scale, as well as in background noise. The primary focus is how subjects are doing in noise, because life is not quiet. It is promising to see that they are reporting perceived improvement in speech perception in background noise within that early period.
With the aversiveness subscale, we see a different trend. By definition, aversive means "avoidance of a noxious or punishing stimulus" (Merriam-Webster). Subjects are asked to rate statements such as, "The fire alarm is loud," or "If a fire truck passes by, that's an annoying sound." These sounds are annoying and obnoxious for normal hearers. Now that we have provided the full-frequency range to these patients that did not have them preoperatively, they are experiencing all the sounds that patients with normal hearing would. Therefore, we would expect them to indicate that they do not find the sound of the fire alarm or the fire truck siren pleasant in any way.
Beyond the Clinical Trial
We conducted a great deal of testing as part of the clinical trial. Since we have such a large group of patients and we have collected so much data, we decided that there is more to learn. We can use this information to figure out why these patients are so successful, and how we can better treat them. The first thing to consider is electric stimulation and residual hearing, and what relationship that might have when you're thinking about testing these patients. We also need to be considerate of the test conditions, as well as what speech perception tests we use. Finally, we will review some case studies from our center.
Charge and Residual Hearing
Earlier, we showed that our EAS recipients experienced a significant improvement in speech perception. We believe that postoperative benefits rely on the preservation of residual hearing. We think that's why these subjects are experiencing such a big difference in speech perception in noise: by adding this little bit of acoustic hearing to electric stimulation. Ultimately, there are variations with residual hearing over time, and we will examine several different cases.
First, let's take a look at a worst-case scenario (Figure 18). After cochlear implantation in the right ear, one of our patients experienced a significant change in residual hearing. We counsel these patients on being careful after surgery, and we discuss lifting restrictions within that initial period of recovery. I've conservatively counseled patients to try not to lift anything heavier than a gallon of milk, so they have a frame of reference to keep in mind. This particular patient felt very good a day or two after surgery and he did some yard work. He lifted a large rock and he said he instantly noticed a drop in his residual hearing. We think that he exerted himself, which moves the fluids in your body, and that influenced his residual hearing, especially since he reported a change in his hearing in the implanted ear.
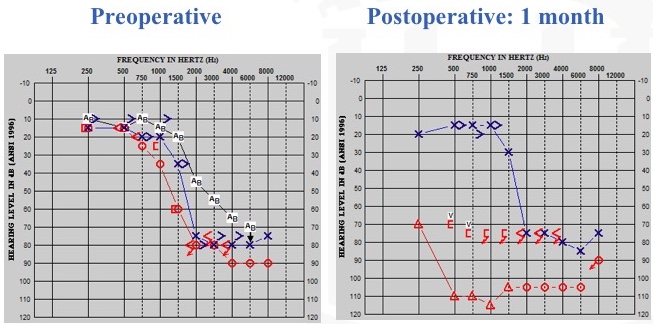
Figure 18. Residual hearing: worst-case scenario.
Next, we have a best-case scenario. With more flexible electrodes and with hearing preservation surgical approaches, this is becoming more common. On the left of Figure 19, you can see the patient's preoperative condition. On the right, you can see her one month post-operative condition. By looking at this audiogram, could you guess which ear we did? This patient's pre-op and post-op audiograms are mirror images of each other. When I tested this patient, I wondered if she had even undergone cochlear implantation yet, because she was healing so well from the surgery. As we followed up with her over time (over a three-year period), she was doing extremely well. For those of you who are curious, it was the right ear that we implanted.
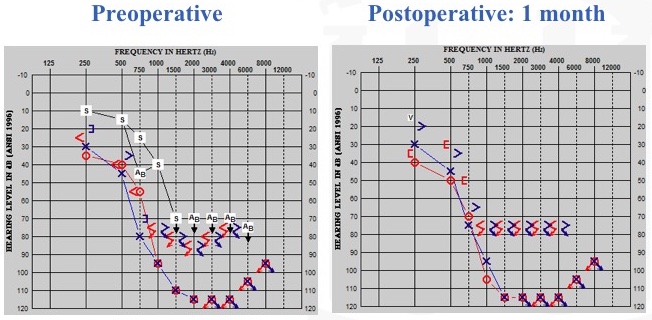
Figure 19. Residual hearing: best-case scenario (stable).
Potential Causes of Residual Hearing Loss
In between the worst and best cases, we also have cases of progressive loss over time. What is the difference between the patient that loses all hearing (whether rapidly or progressively) and the patient that maintains stable hearing for years after cochlear implantation? Some potential causes of residual hearing loss that have been presented include:
- Acoustic trauma from drilling the bony portion of the cochlea
- Mechanical damage from electrode insertion and associated damage of cochlear structures
- Disruption of the cochlear fluid homeostasis
- Infection
- Cochlear fibrosis
One question that has arisen is whether high-levels of electric stimulation could contribute to hearing loss in these patients. As an audiologist, that is concerning, since we are the ones who are responsible for the programming of these patients. Therefore, we decided to evaluate whether charge levels associated with electric stimulation influenced postoperative hearing preservation within that first year of listening experience, or first year of device use. We had a large number of subjects that we were able to study, all of whom had differences in residual hearing over time.
We looked at the low-frequency bone-conduction pure tone average. As illustrated in the audiogram in Figure 20, we sometimes saw this mysterious air bone gap that would occur. This particular patient was implanted in the right ear, and you can see bone-connection thresholds and air-conduction thresholds. This patient also presented with the type A tymp, which has been reported in other patient populations as well. As such, we wanted to control for that variability across patients, because not every patient presents with this air-bone gap. We agreed that the bone-conduction pure tone average was more appropriate, and of course, we would provide a masking in the contralateral ear when warranted.
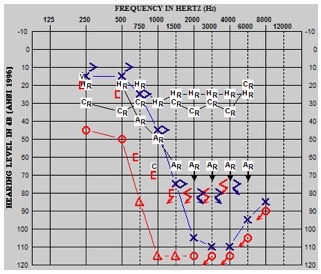
Figure 20. Low-frequency bone conduction pure tone average.
We calculated the charge for each of the electrodes using the CI studio clinical programming software, and the formula:
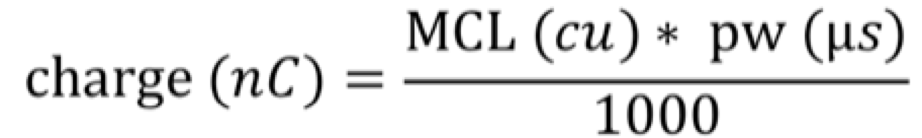
Everyone was programmed with the CIS coding strategy, so there was consistency across these patients. When you calculate the charge for each of these electrodes, instead of looking at each electrode individually, we grouped them, as follows:
- Apical electrodes
- E1
- Apical average
- E1, E2, E3
- Mid average
- E4, E5, E6
- Basal average
- E7, E8, E9
We had our apical electrodes. First, we looked at E1 by itself because that is the closest to the residual hearing. E1 is most apical and so it's the closest to those hear cells that we're wanting to keep active. Then we have our apical average which was E1, E2, and E3, a mid average and then a basal average. You can see that we end on E9. For this patient population, depending on the patient, some electrodes were left extra-cochlear in an attempt for a shallower insertion depth, and so it was not consistent that the patient had E10, E11, E12 within the cochlea itself.
Next, we did a Bivariate Pearson correlation looking at the changes in bone-conduction pure tone average between each of these intervals:
- Initial CI activation
- Initial EAS activation
- 3-month post-initial EAS activation
- 6-month post-initial EAS activation
- 12-month post-initial EAS activation
Results
Our results indicated that charge levels had little to no association with post-operative change in residual hearing in that low-frequency bone-conduction pure tone average within the first year of listening experience. The plot in Figure 21 shows one of the comparisons. Since E1 is the most apical, we thought if anything is going to change residual hearing, E1 would be a major player. We looked at the change in residual hearing at initial CI activation, between when we first turned on the cochlear implant and when they came back to have the acoustic portion activated. We can see the change in the bone-conduction pure tone average, as well as the associated charge on E1. There is no correlation between those two variables.
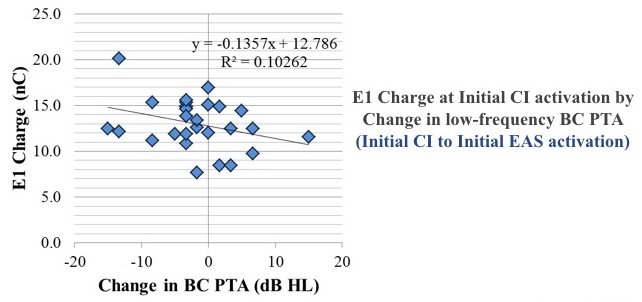
Figure 21. Results show no correlation between change in bone conduction pure tone average and E1 Charge at initial CI activation.
Test Conditions
For the multi-center EAS clinical trial, we tested in three conditions:
- Hearing aid alone
- CI alone (full-frequency map)
- Combined/EAS (truncated map)
When we would switch patients to the cochlear implant alone (full frequency), they would comment that they thought it sounded "weird," and that it didn't sound like what they expected the cochlear implant by itself would sound. We began to realize that with conventional cochlear implant patients, if their frequency filters change, it takes a while for them to acclimate to that new sound quality. We decided to test patients with that full-frequency map, because we want all of those speech frequencies represented by the cochlear implant; we didn't want to leave any out. Therefore, performance was underestimated, because we only had 750 to 8500 Hz represented. We did not have that low-frequency information represented. If these patients had lost all residual hearing, we would program them as we would our conventional cochlear implant candidate. We also tested them in their truncated maps. When programming EAS, we backed off those frequencies slightly to allow the acoustic component to present a low-frequency region, and then the cochlear implant can offer that mid- to high-frequency information.
For the multi-center trial, we used CNC words in quiet and CUNY sentences in steady noise. Since that time, our minimum speech test battery for testing conventional cochlear implant patients has changed. We still use the CNC words in quiet, but for the noise conditions, we are no longer testing in steady noise; we are now testing in babble conditions. AzBio is the 10-talker babble, and BKB-SIN is that more challenging four-talker babble.
We had three aims. First, we wanted to evaluate the contribution of the hearing aid (the acoustic component) to EAS in those babble conditions, since we didn't address those in the clinical trial. Second, we wanted to look at performance in the CI alone condition, and that full-frequency map that was unfamiliar to the patient, as well as the truncated map that was familiar to the patient. Our third aim was to evaluate performance differences when we added the contralateral ears. Many of these patients continue to wear their hearing aid in their contralateral ear, but when we were testing them, we were testing the ipsilateral condition only.
Figure 22 shows the plotting for percent correct using CNC words in quiet for the full-frequency cochlear implant condition, the truncated cochlear implant condition, EAS with a combined condition, and EAS plus that contralateral hearing aid. Each of the symbols represents one of the subjects that participated in the subsequent test. The lines represents average performance across those subjects. The benefit of each of these is you can see what the individual performance was over each of these conditions. If you wanted to follow the square, it's that same subject over each condition.
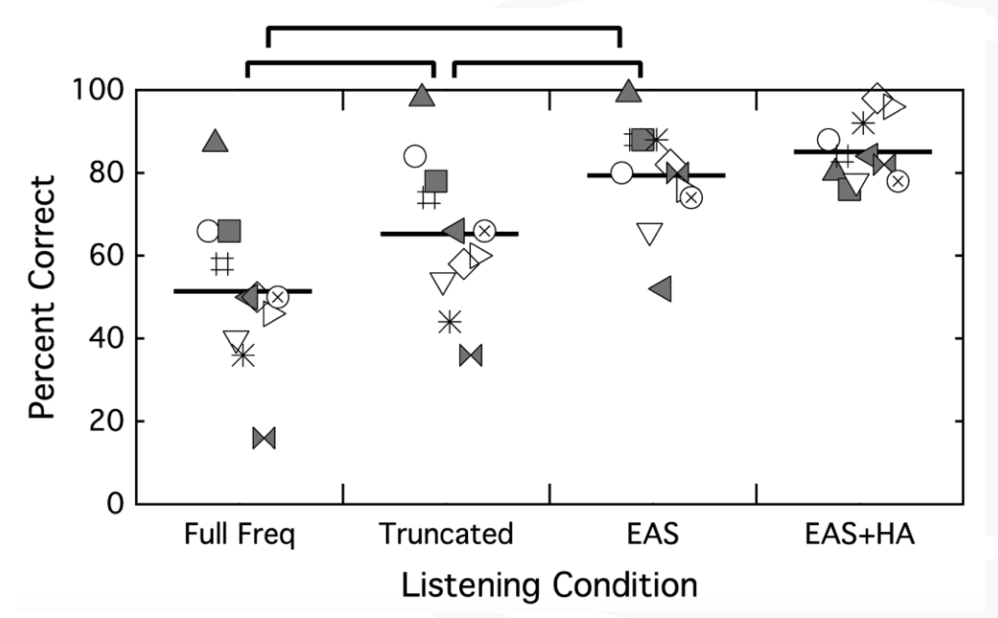
Figure 22. CNC words in quiet. Each symbol represents one of the participants; the horizontal line represents average performance across those subjects.
On CNC words in quiet, the first thing that we can see is there is a significant difference in performance between that full-frequency and the truncated map. Patients did better with the truncated, familiar cochlear implant condition than they did when you changed their frequency filters. Unsurprisingly, we also see that their better performance was in the EAS condition over each of the cochlear implant alone conditions. Not surprisingly, we did not see a difference between EAS and EAS plus the contralateral hearing aid, because now some of these patients are hitting the ceiling, so to speak.
The next thing that we looked at was CUNY sentences in steady noise (Figure 23). Again, we see a difference between that full-frequency condition and the truncated map, with better performance with the familiar map. The best performance was in that combined EAS condition over either cochlear implant alone condition. Additionally, we're at ceiling again with the EAS comparison to the EAS plus the contralateral ears.
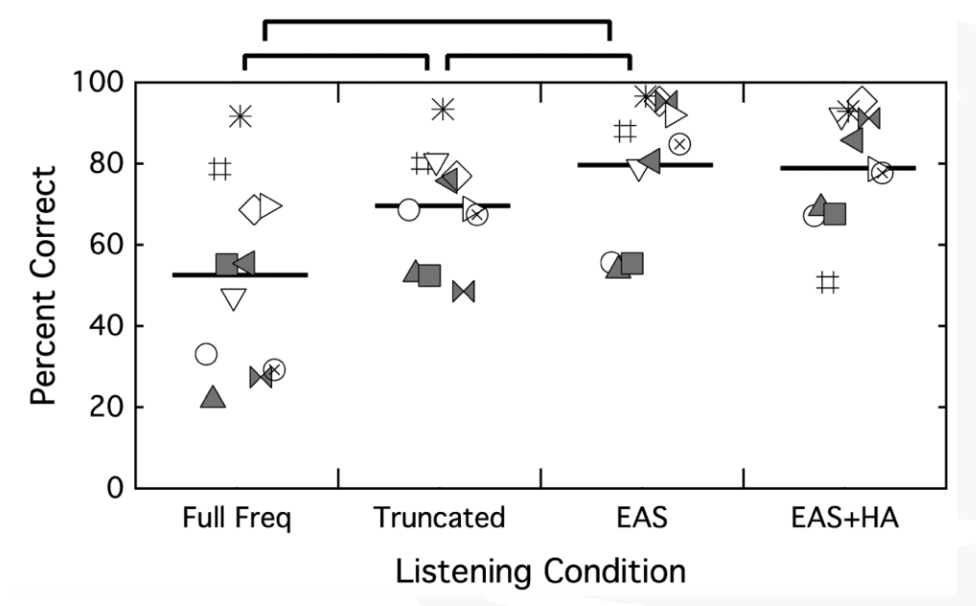
Figure 23. CUNY sentences in steady noise.
Finally, we looked at BKB-SIN (Figure 24). This is where we can see the difference between EAS and EAS plus the contralateral ear, with the better value being a lower value. Having acoustic hearing on both sides offers these patients better speech perception performance. One thing to note is that all of these conditions were present in speech front, noise front. As these patients start maxing out on these conditions, you have spatially separate the speech and the noise to see what these patients are able to do with bilateral acoustic hearing.
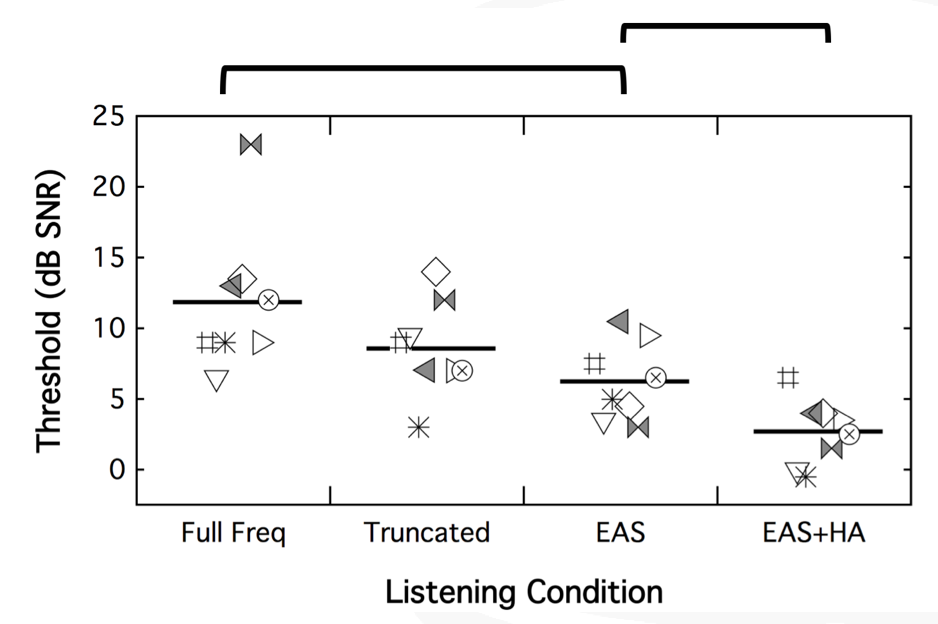
Figure 24. BKB-SIN.
Case Studies
Case A: Low-Frequency Hearing
When we assessed hearing for the clinical trial, we measured unaided thresholds from 250 to 8000 Hz. As part of our protocol, if a patient's hearing fell at 80 dB or poorer at 250 Hz, use of the acoustic component was discontinued. However, the fitting range of the acoustic component is 125 to 1800 Hz. For the low-frequency hearing, we felt a little silly that we weren't even measuring 125 Hz. Our cochlear implant team discussed the fact that for our conventional patients, we're not assessing 125 Hz.
We had one patient who said, “I think I'm hearing well with the acoustic component, even though you tell me I don't need it.” We decided to test him in both (Figure 25). We took the acoustic component off, had him tested in CI alone for CNC words in quiet (56%) and then CUNY sentences in noise (59%). When we added the acoustic component, we saw a huge jump in his speech perception performance, from 56% to 88% in quiet, and from 59% to 74% in noise. When we measured 125 Hz, we saw he was still within that range where he could benefit from the acoustic component. As a result, we began to think differently about that, and have now changed our protocol where we measure everyone from 125 to 8000 Hz. That little bit of acoustic hearing can have a big impact on speech perception in quiet, but especially in noise.
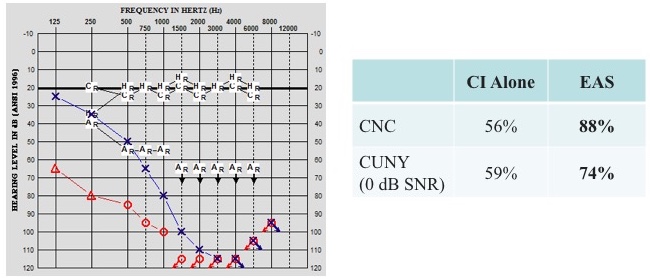
Figure 25. Case A: low-frequency hearing.
Case B: Long-Term Stability
A 33-year-old male presented to our clinic who had been fit with hearing aids at 24 years old. He was reporting difficulty hearing in meetings at work, as well as trouble hearing his wife at home. Preoperatively, he scored 26% on CNC words and 23% in CUNY sentences in noise.
He underwent cochlear implantation of the left ear, and we activated his cochlear implant about four weeks later. Figure 26 shows his audiograms before surgery and at 12 months postop. We had a shift in the way that we test patients, moving from paper to AudBase within that period of time.
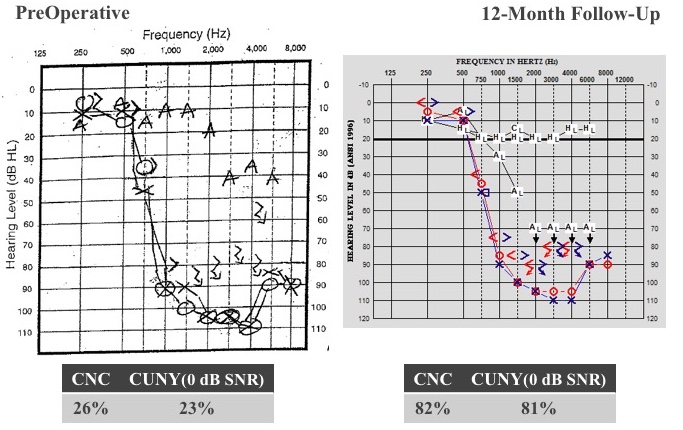
Figure 26. Case B: long-term stability.
If you look at the residual hearing thresholds, after 12 months of listening experience, we did not see a change in hearing. He still has that normal low-frequency hearing. He doesn't need the acoustic part of the device, because he is getting those low-frequencies normally and naturally. He is fit with cochlear implant alone and listening very well that way. Adding the cochlear implant portion to that normal low-frequency hearing, his CNC score jumped from 26% to 82%, and CUNY sentences in noise went from 23 to 81%. After two years, he was hitting the ceiling at 90% on CNC words, and 99% CUNY. There is no change in his residual hearing. It's a challenge to get him back in the clinic, because he's doing so well. We did convince him at the seven-year mark to come back. He was still hitting ceiling effects on his test measures, but then we got smart and started testing in babble. Now we're testing him in a more challenging condition, and he is achieving these results:
CNC | CUNY (0 dB SNR) | AzBio (5 dB SNR) | BKB-SIN |
92% | 82% | 91% | 3.5 dB |
Summary and Conclusion
Overall, our recipients are experiencing a significant improvement in speech perception and quality of life with EAS, as compared to conventional hearing aids. Furthermore, we did not find a relationship between charge levels and change in residual hearing, which is encouraging from an audiologist's perspective. We also found that the assessment of speech perception in babble as opposed to steady noise may better demonstrate the contribution of the acoustic component.
Listening experience may influence CI alone findings. In your clinic, when testing the CI alone condition, be cognizant of the fact that you may underestimate performance if you're changing frequency filters without allowing the patient's listening experience. Additionally, we know now that even small amounts of low-frequency residual hearing can offer a big improvement in speech perception in noise. As a result, we have changed our protocol to assess 125 Hz in all of our patients. Lastly, one of the benefits of having been able to participate in this study since 2006, we know that residual hearing can be maintained with long-term use.
Thank you again for attending and feel free to contact us with any questions.
Questions and Answers
What was the performance of these patients on AzBio relative to CUNY?
I did not plot AzBio here. For these patients, for this condition, using the CUNY sentences in steady noise, these patients are being tested at an SNR of +0, similar to what we were testing them in the clinical trial. For the clinical trial, we used a decision tree to determine where they should be tested. We did have one patient who was unable to get to the 0 DBS in our level that they were testing consistently throughout the study period at +5. When we were testing the subgroup of patients to look a little closer at performance, if we tested the AzBio +10, they maxed out. If we tested the AzBio +5, we were still hitting the ceiling effects, but we showed a little bit of variability with some getting 82%, but still you're at that upper end of the range. If we were testing in the AzBio +0, that's where we start to see more variability in performance. Again, EAS was the superior condition for these patients to be listening in over the CI-alone conditions, but I didn't have those scores plotted here.