Learning Objectives
- Participants will be able to describe the difference between music and speech in terms of dynamic range and frequency range.
- Participants will be able to explain why hearing aid processing is not always ideal for music.
- Participants will be able to describe the results of a clinical study which compares the performance of various premium hearing aids in terms of music sound quality.
Background
Some people cannot imagine life without music - it relaxes, inspires, and for many, completes their lives. Music has a different meaning for each person, and there are individual preferences, but most would agree that music listening should be enjoyable. This seemingly simple task easily can be undermined when hearing loss is present, as listening to just a limited part of the dynamics, or a reduced frequency range of our favorite music could significantly reduce the enjoyment of the experience. Moreover, in several cases, this problem cannot be fixed with modern hearing aids. The primary goal of the hearing instruments and the typical hearing aid fitting is to provide optimum speech intelligibility; the processing of other inputs is secondary. Over the years, it has been common to refer to the typical intensity/frequency range of average speech as “speech banana”. If we apply this reference to music, we have the “music watermelon”, as shown by the larger and more robust area in Figure 1. If hearing aids are optimized for the banana, they will not approach optimization for the range of the 'watermelon'. Therefore, it should not be expected that hearing aids programmed for speech understanding would also be suit preferences for listening to music.
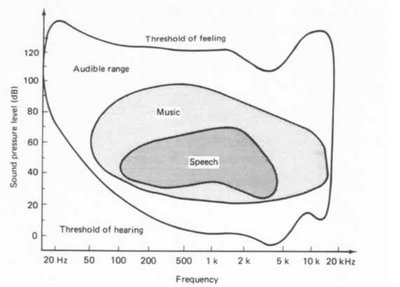
Figure 1. The frequency-intensity visualization of the human audible range, the most typical sounds of music and the most typical sounds of speech. We commonly refer to the “speech banana”; using the same analogy, by comparison the larger and more robust range for music could be referred to as a watermelon.
While preparing this paper, an Internet search was performed to see how the importance of music has changed in the last 14 years in the hearing aid industry. The Hearing Journal, a popular industry trade publication, was searched for the keywords “music” and “speech” for the time period 2001 - 2014. The number of hits, defined as the number of articles wherein the keywords appeared, were counted (Figure 2).
While as expected, “speech” is used as a key word more frequently than “music”, we can clearly see the growing trend of the music-related publications, and in parallel, a decreasing number of publications about “speech”. This might mean that modern hearing aids have reached an acceptably high level for speech understanding, so there are less and less new results published. On the other hand, the performance level of the hearing aids in non-speech related scenarios, such as music, has become increasingly important.
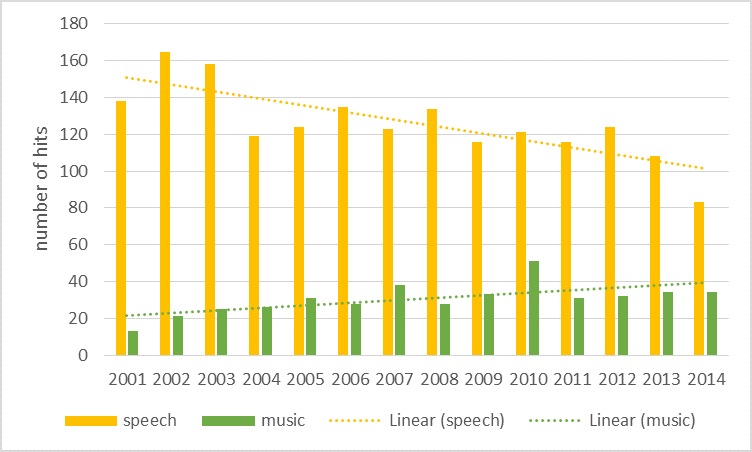
Figure 2. The number of articles containing the keywords "speech" (yellow bars) and "music" (green bars) published in the Hearing Journal from 2001-2014.
A similar message comes from the latest MarkeTrak study as well. Abrams and Kihm (2015) highlighted that the overall satisfaction level with hearing aids had increased from 74% (in 2008) to 81% (in 2014). They added, “Satisfaction with hearing aids is very highly correlated with satisfaction with sound quality”. Hearing aid wearers expressed that hearing aids improved the quality of their lives in many cases, but they could not always “align specific benefits with respective features, they simply know if a hearing aid sounds good/better and works well”. In other words, if hearing instruments improve quality of life, it does not exclusively mean that this relates to better speech understanding. Rather, it may relate to listening to a variety of things in the patient’s environment, which often includes music.
When we are talking about the sound quality of hearing aids, we know that it cannot be easily quantified. There are several individual aspects of sound quality, such as distortion, presence of feedback, etc. which can be measured, but the overall sound impression includes more than these measurable attributes. In our overall effort to improve the quality of life through amplification, we need to examine how the hearing aids perform in regards to their ability to represent the sound-scapes realistically, to allow for localization or identification of specific sound sources and how they perform in the case of music listening as well, as music is an important part of our lives.
In the past few decades, the level of music consumption has been continuously increasing. According to the Share of Ear study by Edison Research from 2014, Americans spend an average of four hours each day consuming audio. The most typical audio sources are radio (52.1%, AM/FM; 11.6%, Internet radio or online streaming) and listening to own music (20.3%, CD, digital sound files, etc.).
Music has not only a conscious, but also a subconscious impact on our lives. It has been clinically documented by Salimpoor and colleagues (2011) that our brain releases dopamine during anticipation and experience of our favorite music, a chemical associated with pleasure and reward. The quality of the perceived music can significantly influence the effect of music. For example, the enjoyment is reduced when we listen to our favorite music when it is too soft, or is a poor quality reproduction. But how do we describe the quality when we listen to music via a pair of hearing aids?
Based on the work of Gabrielsson and Sjogren (1979), a method was designed and evaluated by an independent laboratory (DELTA, SenseLab) to obtain the Basic Audio Quality of several modern hearing aids in reference to performance for music listening. Not an evaluation of specific hearing aid features, but rather, it is an overall evaluation of the sound quality of music played through several models of instruments, and then rated by experienced hearing aid wearers. In the following sections, this method is explained and the results are discussed.
Test Conditions
Five premium hearing aids (introduced to the market in the last 6-18 months) were selected from the top five hearing aid manufacturers, and tested by the DELTA SenseLab in Denmark. All hearing aids were programmed individually according to the hearing loss of the test subjects according to each manufacturer’s proprietary fitting algorithm. The Music program was then selected in the fitting software for each instrument. For the Siemens hearing instrument, the product also was tested in the “Universal” program (Table 1). In total, testing was therefore conducted for six different conditions with five different instruments.
| ID | Product | Launch date | Program |
| A | Siemens Carat 7bx binax | October 2014 | Universal |
| B | Siemens Carat 7bx binax | October 2014 | Music |
| C | Manufacturer "C" | March 2015 | Music |
| D | Manufacturer "D" | March 2014 | Music |
| E | Manufacturer "E" | March 2015 | Music |
| F | Manufacturer "F" | October 2014 | Music |
Table 1. All tested hearing aids had been introduced to the market 6-18 months before the test. Product A and B are both Siemens Carat 7bx binax hearing aids with two different program settings.
Twenty-five participants were recruited based on the following criteria:
- Experienced hearing aid users
- Hearing loss in the range of N2-N5 according to IEC 60118-15
- Symmetrical hearing loss (small deviations allowed)
- Reported interest in listening to music
The participants (11 males, 14 females) ranged in age from 49-87 years, with an average of 73.2 years (s.d.=8.6). All participants were experienced hearing aid users, used hearing aids on a daily basis, and had a strong interest in listening to music on an everyday basis.
It is important that the Basic Audio Quality test is not music style dependent, and therefore, different types of music were used for the reference. To minimize the effects of personal reactions to a given type of music, a total of eight different music style samples were used in this evaluation: string orchestra, pop music male, pop music female, symphony finale, organ concert, jazz, vocal solo and piano.
Each hearing aid was programmed for each individual, and each of the eight sound samples was then recorded. All hearing aids were recorded on a Brüel & Kjær Head and Torso Simulator (HATS) 4128C placed in the center of a calibrated ITU-R BS.1116-3 stereo loudspeaker setup in DELTA’s standardized listening room with a low background noise level below NR15 (Figure 3). For the comparative testing, the participants then listened to the appropriate sound recordings via a calibrated headphone. The five different products were ranked for every music style, based on the participants’ overall impression, and the relation of that product to the other hearing aids.
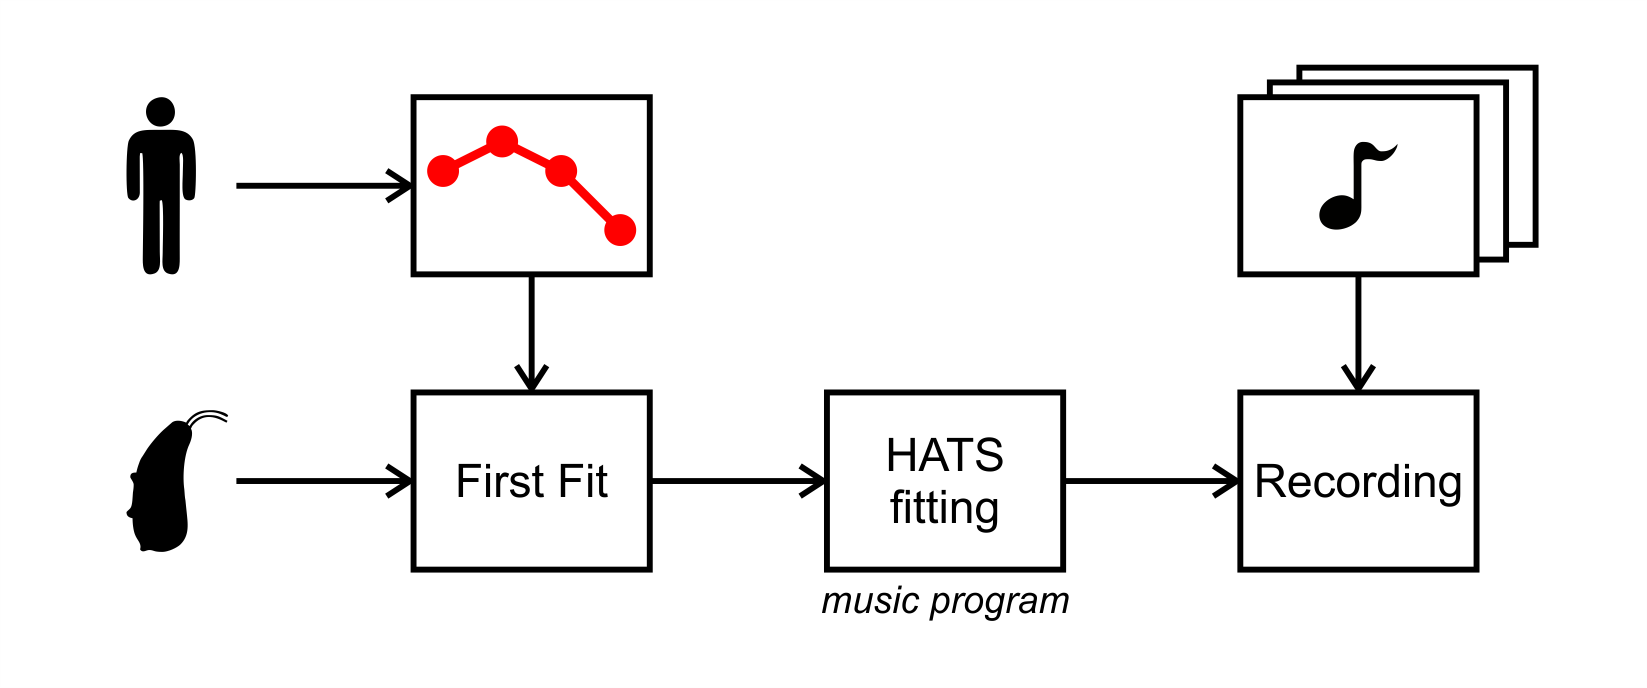
Figure 3. Overview of the preparation procedure. The hearing aid was programmed based on the hearing loss of the given test subject using each manufacturer’s proprietary fitting algorithm. The device was placed on a Head and Torso Simulator and sound recordings were made with each of the music samples. The procedure was repeated with every hearing aid (two different programs for the Siemens instruments).
Listening Tests
Stage 1 – Loudness alignment and familiarization
The hearing aid comparative ratings were based on the HATS recordings reproduced at a calibrated level over Sennheiser HD650 headphones. The first task for the participants was to loudness align all hearing aid recordings for each music sample. That is, they adjusted the volume of the recorded signal up or down until the music was at their most comfortable listening level, just as they would do if they were wearing the hearing aids. This procedure was chosen to minimize the effect of loudness differences between products on the perceptual evaluations. Through this stage, the subjects were familiarized with all the music samples as well as with the graphic user interface of the test software.
Stage 2 – Basic Audio Quality evaluation
The second stage of the comparative procedure was to evaluate “Basic Audio Quality” of the different hearing aids for all music samples. A multiple stimulus methodology was implemented and the ITU-R BS.1534-3 scale labels were used. The experimental protocol used double-blind randomization for both the music samples and the hearing aids. The loudness level for each hearing aid recording was automatically adjusted according to the level determined in Stage 1, and the amplification settings were individual for each test subject. For each music sample, the participants could freely switch as much as desired among all hearing aids and adjust or re-adjust the quality ratings until they pressed “Gem” (Save). A screenshot of the software user interface is shown on Figure 4.
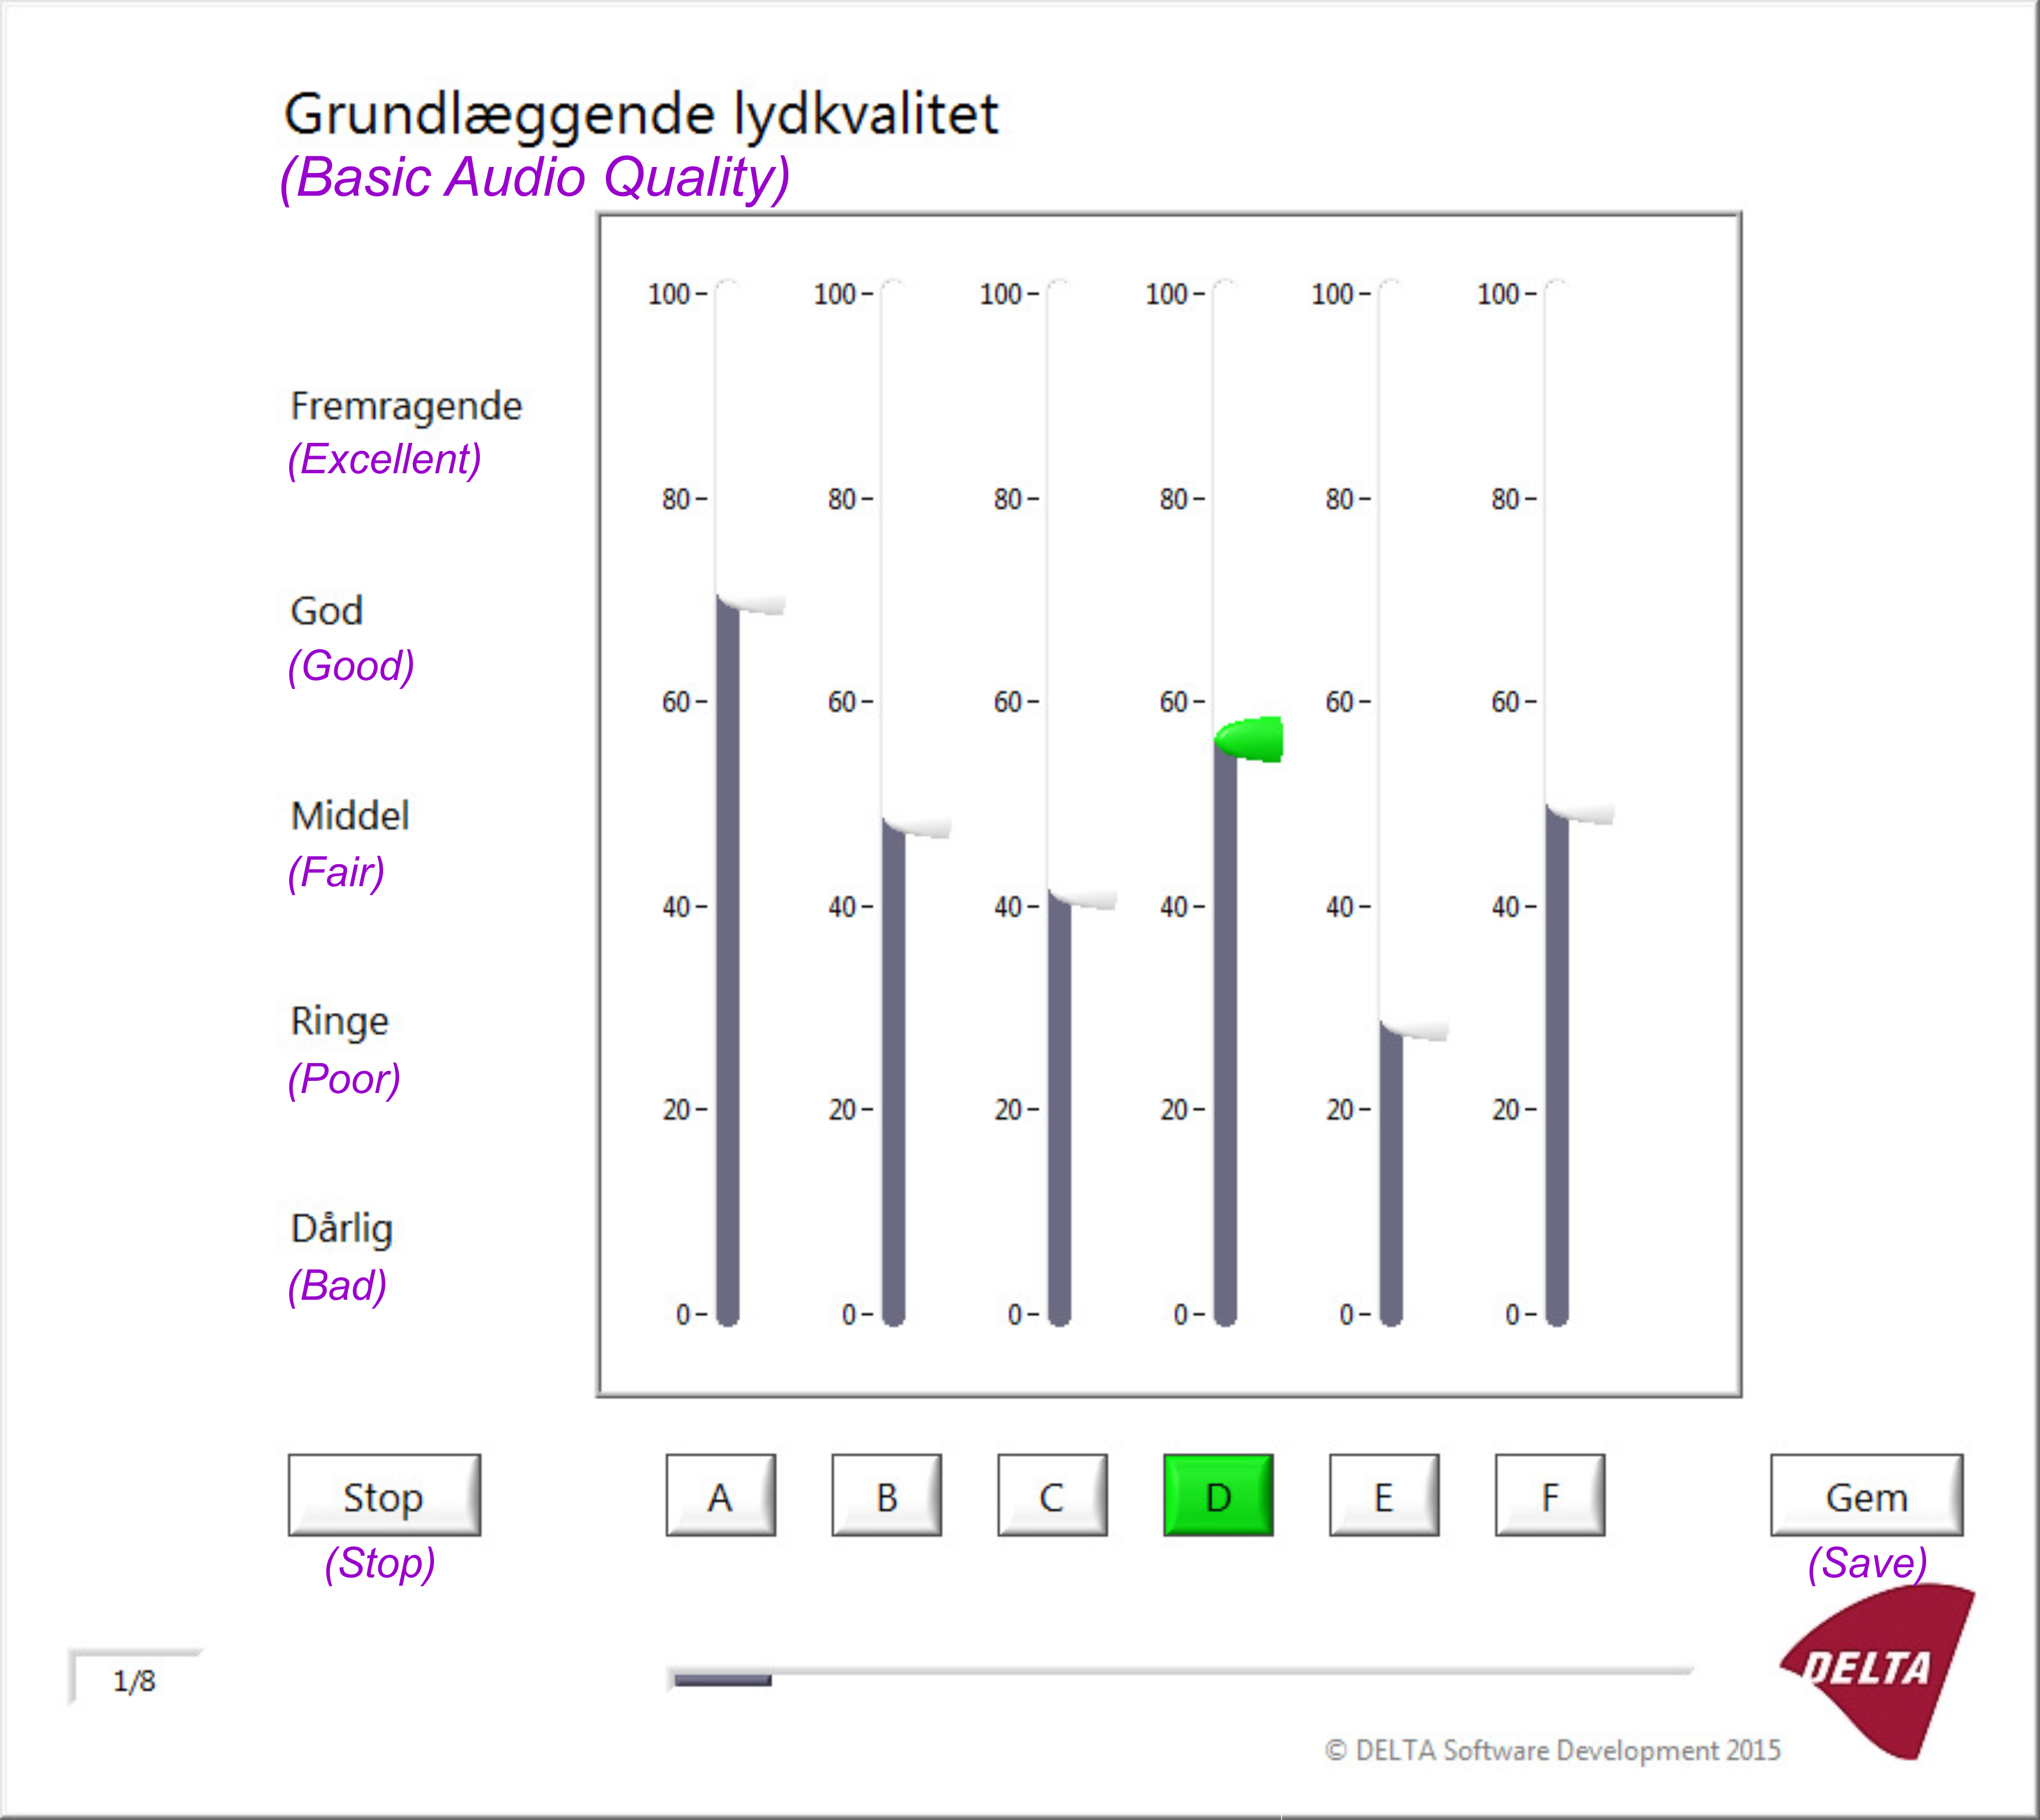
Figure 4. The graphic user interface of the Basic Audio Quality test software. Each music sample had the recordings with all hearing aid models; the test subject could easily switch between the recordings and set the ratings based on the comparisons.
The scale range was 0 to 100 where 100 correspond to the most excellent basic audio quality. The scale was labeled based on five major categories, as shown in Table 2.
| Scale range | Label |
| 80-100 | Excellent |
| 60-80 | Good |
| 40-60 | Fair |
| 20-40 | Poor |
| 0-20 | Bad |
There is no standard or objective scaling system for music quality of hearing aids, and music perception is always a subjective experience. Ensuring similar listening conditions for all hearing aids, using comparisons among premium-class hearing aids, and repeating the test with different music samples brought a common ground (i.e. objectivity) to the test. Using a 100 point scaling system makes sense only with experienced hearing aid users who have realistic expectations and interest regarding music listening.
Results
The mean and 95% confidence intervals of the six listening conditions for the five different hearing aids, averaged across the eight music samples, are shown in Figure 5.
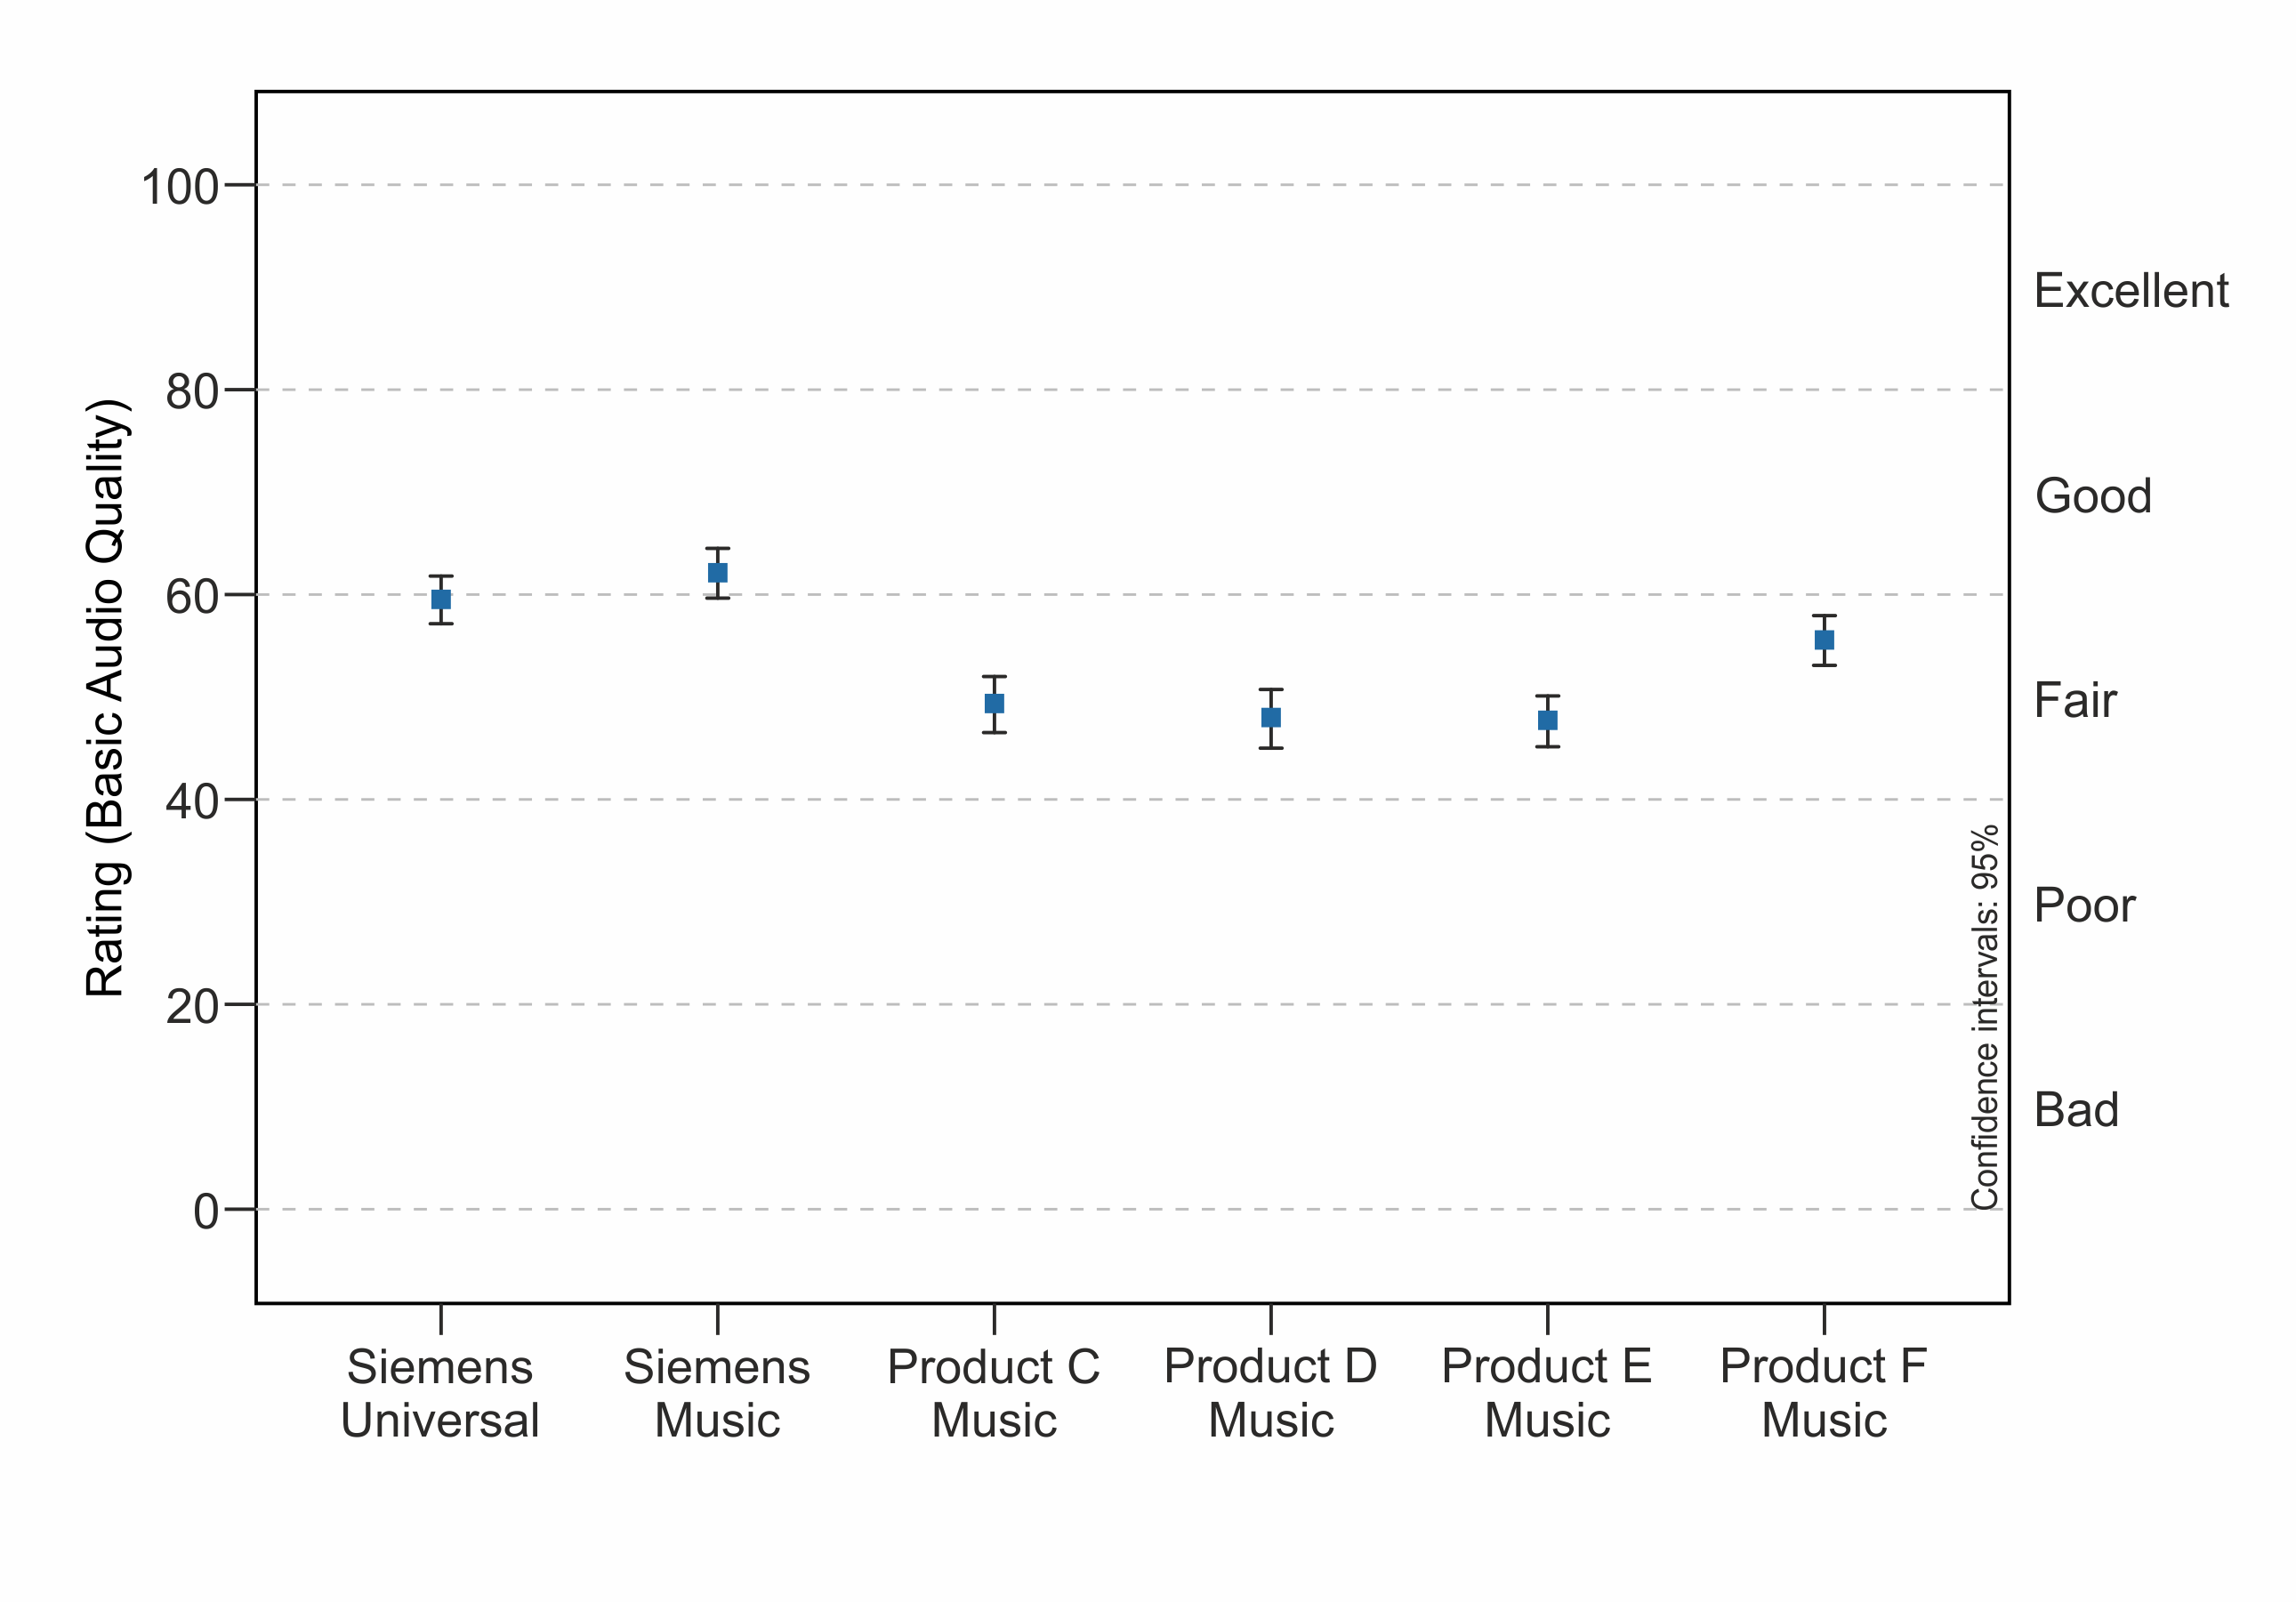
Figure 5. The mean and 95% confidence intervals of the Basic Audio Quality test for the six different products, averaged over the eight music samples.
Analysis of variance (ANOVA) for the basic audio quality evaluations was conducted, and the largest effect was found for the variable ‘Hearing aid’ (p<0.0001, F=42.9).
To test for significant differences between the hearing aids, a Tukey Honest Significant Difference (HSD) test was applied. A summary of the significant findings (p<.05) are as follows:
- Hearing Aid A: Better than C, D and E, same as B and F.
- Hearing Aid B: Better than C, D, E and F, same as A.
- Hearing Aid C: Same as D and E, worse than A, B and F.
- Hearing Aid D: Same as C and E, worse than A, B and F.
- Hearing Aid E: Same as C and D, worse than A, B and F.
- Hearing Aid F: Better than C, D and E, same as A, worse than B.
The ANOVA also revealed a significant effect for the variable ‘Participant’ (p<0.0001, F=13.4). That is, some participants may have given all or most of the sample ratings in the 60 to 70 point range, whereas other participants may have given the same samples ratings in the 40 to 50 point range, which is often seen in tests like this. The Sample effect (i.e. eight different music samples) was also significant (p<0.0001, F=6.41), indicating an overall variation in the rating of the samples, supporting why it is important to use different music samples in the Basic Audio Quality test, or in other research regarding quality judgments of music. For example, post-hoc analysis of this variable for each individual music sample revealed that for the 15 possible comparisons between products (e.g. A-B, A-C, A-D, etc.), a significant mean rating difference was present for 8 comparisons when the sample was Symphony Finale. On the hand, for both the Vocal Solo and the Piano samples, no significant rating differences were present between any of the 15 product comparisons.
Discussion
This method transfers a subjective music quality perception into an objective scaling, by utilizing the opinion of several participants (with an expressed appreciation of music) over different music samples, and comparing premium-class hearing aids. The analysis revealed that significant differences indeed exist in the music quality of the different products, with the two superior samples being the Siemens binax Music Program and the Siemens binax Universal Program. These two were not rated significantly different. While on the surface, one might assume that the Music Program would be rating higher, it is important to remember that in the Universal Program, when music is detected, the hearing aid will automatically switch to music-optimized settings, as it was described by Várallyay, Pape and Meyers (2014). Herbig, Barthel, and Branda (2014) showed an accuracy of 96% for this detection. Hence, while labeled differently, for most samples, the amplification characteristics were similar for these two instruments.
One thing that stands out in Figure 5 is that even the highly rated Siemens instruments only had a quality rating of around 60 points out of 100, and some instruments had mean ratings below 50 points. While the purpose of this study was to evaluate relative differences, not the absolute values, we were somewhat surprised that the mean absolute ratings were this low. Recall, however, that these participants were selected because they had a high appreciation for music.
Music for all ages
The love of music and a high level of music consumption are not only linked to the younger generations. For this reason, we were interested in the relationship between age and the ratings obtained for the different products. To examine this, we used 80 years of age as the cut-off, and what is shown in Figure 6 are the mean values for the participants over the age of 80 (n=19; 76%) and the participants under 80 years of age (n=6; 24%). As we might expect, the older individuals had a larger standard deviation in their ratings for all products, and overall across products, they rated the music samples lower. An intriguing trend, however, emerges when we examine this age effect as a function of product. Note that for products C, D, and E, the >80 year group’s ratings are 10 to 18 points below the <80 group. These differences were significant (p<.05) for both Hearing Aids C and E. Observe, however, for the two overall highest rated instruments, Hearing Aids A and B (the two Siemens products), the ratings are nearly the same for both groups. We interpret this to mean that if the amplified signal is already poorer in quality, this will only be magnified when the patient’s internal processing is reduced. On the other hand, if the hearing aid quality is high, it can withstand reduction in the patient’s processing ability.
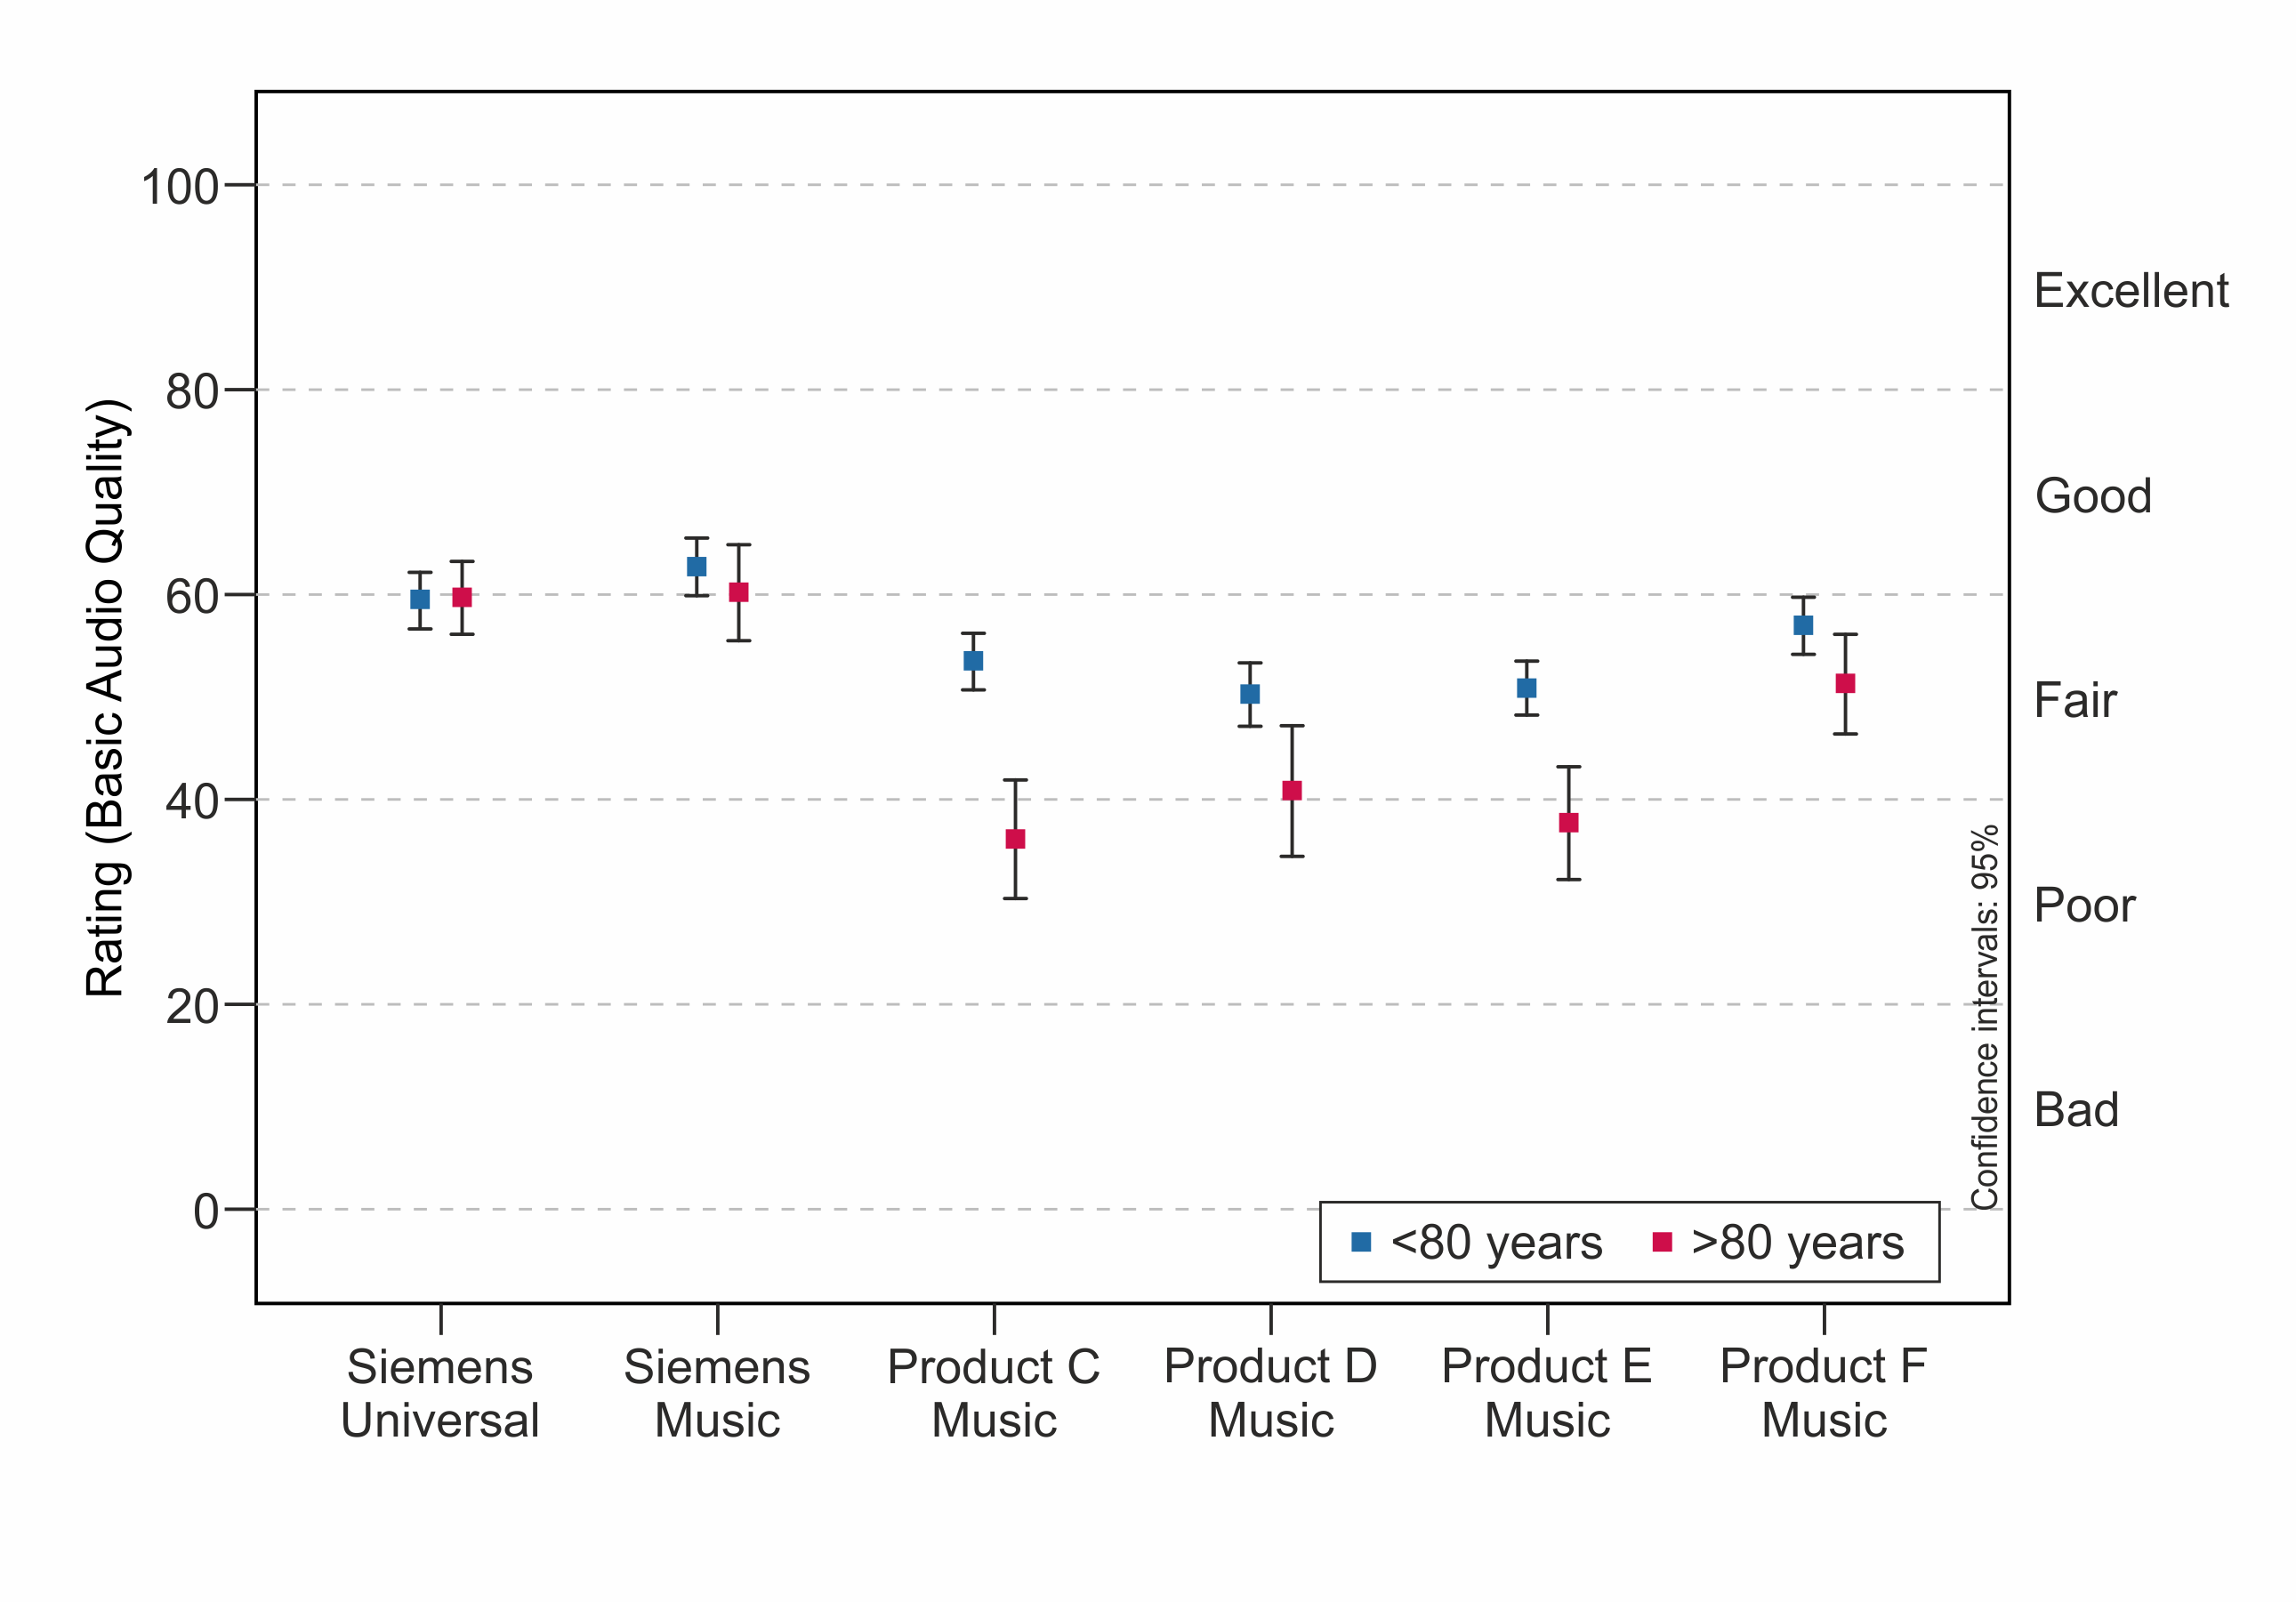
Figure 6. The distribution of the Basic Audio Quality ratings in two age groups (<80 and >80 years of age), based on the mean ratings for the eight different sound samples.
Conclusion
There is no doubt that for many people, music plays an important role. The quality of music has an impact on our musical experience and emotional reactions.
For individuals with hearing loss, the primary goal related to using hearing aids is to optimize speech understanding, and provide appropriate loudness for speech and other environmental sounds. The amplification also must provide high sound quality and provide sound comfort. However, the range of the most typical frequencies/intensities of human speech have a more limited area than music. It is perhaps not a realistic expectation to have a perfect music experience with hearing aids (i.e., the speech banana v. music watermelon analogy).
While the music listening experience might not yet be ideal, modern hearing instruments continue to provide more and more music optimized features and settings. The overall value of these features has not been systematically evaluated, which was the purpose of this research. The Basic Audio Quality test was accomplished by an independent laboratory.
Five different premium-class hearing aids from different manufacturers were evaluated using eight different music samples by 25 participants, all of whom reported a strong interest in music listening. The results revealed significant differences among products, with the highest rated product being the Siemens binax, programmed to either the Music or Universal Program. While several products showed a significant decrease in their ratings for older individuals, the Siemens product, for both programs, maintained an overall high rating. Performance for listening to music is something that needs to be taken into account when selecting hearing aids, and this research reveals that significant differences exist among products.
References
Abrams, H.B., & Kihm, J. (2015). An introduction to MarkeTrak IX: A new baseline for the hearing aid market. Hearing Review, 22(6), 16-21.
Gabrielsson, A., & Sjogren, H. (1979). Perceived sound quality of sound-reproducing systems. Journal of the Acoustical Society of America, 65(4), 1019-1033.
Herbig, R., Barthel, R., & Branda, E. (2014). A history of e2e wireless technology. Hearing Review, 21(2), 34-37.
Powers, T.A., & Froehlich, M. (2014). Clinical results with a new wireless binaural directional hearing system. Hearing Review, 21(11), 32-34.
Salimpoor, V.N., Benovoy, M., Larcher, K., Dagher A., & Zatorre, R.J. (2011). Anatomically distinct dopamine release during anticipation and experience of peak emotion to music. Nature Neuroscience, 14, 257-262.
Várallyay, G., Pape, S., & Meyers, C. (2015, June). Automatic steering: the director of the binax soundtrack. AudiologyOnline, Article 14353. Retrieved from www.audiologyonline.com
Citation
Várallyay, G., Legarth, S.V., & Ramirez, T. (2016, February). Music lovers and hearing aids. AudiologyOnline, Article 16478. Retrieved from https://www.audiologyonline.com.