
Learning Outcomes
After this course learners will be able to:
- Define individual factors of the person with hearing loss and their consequences to communication in noise.
- Describe the effects of signal to noise ratio (SNR) loss on effective communication for older adults with hearing loss.
- Describe the effects of peripheral loss on effective communication for older adults with hearing loss.
Introduction
Inquiring clinicians want to know: what accounts for individual differences in performance in noisy places of high social value and how can these individual differences be measured for in the clinic? As Part 2 demonstrates, many of these individual differences can be uncovered when the Quick SIN and SSQ-12 are included in a holistic approach to care and are used in the goal setting and hearing aid recommendation process. Recently, Appleton-Huber (2022) showed that speech understanding trumps sound quality in everyday listening situations, especially for older adults. This article (Part 2 of a three-part series) expands on her findings and demonstrates how and why clinicians can align the individual’s actual speech understanding performance in noise with their expectations.
“Grandpa says the diner is noisier than two skeletons dancing on a tin roof. I don’t know what his problem is, the rest of us hear just fine in there.” – Overheard in the parking lot outside Phoebe’s Diner, Austin, Texas
Given the pervasiveness of noisy bars, cafes and restaurants, which often exceed levels of 70 dBA, it is easy to believe most people avoid these situations because the noise levels make it nearly impossible to converse. A stroll by any popular late-night establishment on a weekend, however, suggests otherwise. People, usually with some effort and concentration, can carry on conversations in these noisy places, at least for a relatively short amount of time. The prevalence of these acoustically challenging social situations and their negative consequences was the focus of Part 1. Now, we turn our attention to the individual who is trying to participate in activities where the background noise is adverse. The focus in Part 2 is how clinicians can account for individual differences in their functional communication ability in background noise, and how that information can be used in the treatment planning and goal setting process – tasks that set hearing care professionals apart from OTC transactions.
It's important to remember that the human auditory system has the remarkable, innate capacity to attend to sounds of interest while simultaneously tuning out sounds of lesser importance. Further, when the sound of interest changes, the listener can automatically shift their attention to another sound. All of us, regardless of age, rely on this ability so much it is often taken for granted -- until we begin to lose it. As people age and as hearing loss worsens, this extraordinary ability often fades. Even as this ability fades as people age, it does vary significantly across individuals – and it can be accounted for with a couple of routine clinical measures. This is the focus of Part 2.
When communicating in acoustically challenging situations, we rely on a combination of top-down and bottom-up processing, which are shown schematically in Figure 1. Bottom-up processing is probably best described as the ability of the cochlea and auditory nerve to transmit sound to the brain; thus, it is input-driven and automatic. That is, you don’t have to think about it, it just happens. Bottom-up processing is affected by sensorineural hearing loss, which acts as a sort of filter, preventing many sounds, critical for understanding speech in the presence of noise, from finding their way to the brain.
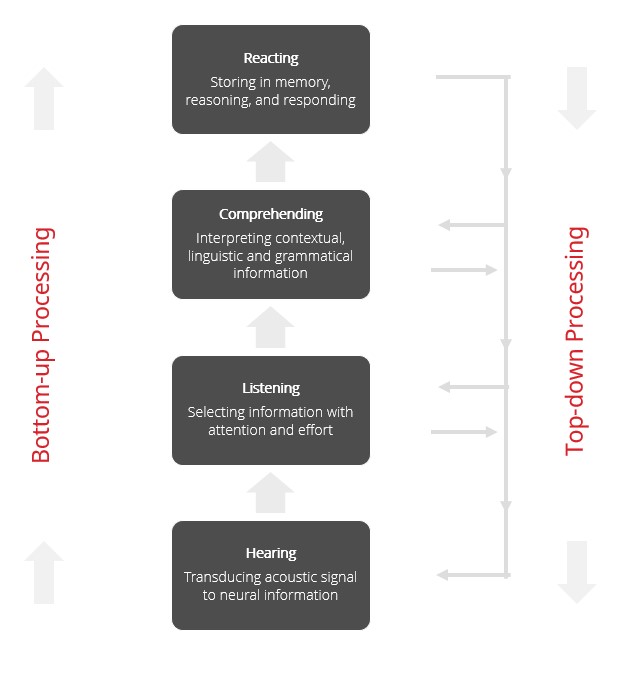
Figure 1. The key landmarks and attributes of top-down and bottom-up processing.
In contrast, top-down processing is slow and deliberate. This means top-down processing largely relies on the linguistic experience of the listener, using their auditory memory capacity and other executive functions to help make sense of the message. Because of this, top-down processing requires the listener to “think about” the situation to help make sense of the message – a task that requires effort. For a more detailed description of top-down and bottom-up processing, and how they work in combination, readers are encouraged to see Pichora-Fuller, Schneider & Daneman (1995) and Humes, Lee & Coughlin (2006).
Although the combination of top-down and bottom-up processing effectively explains how everyone communicates in acoustically challenging situations, older individuals with hearing loss experience significant compromises in both top-down and bottom-up processing. When a person acquires a peripheral hearing loss, it affects their bottom-up processing. In order to compensate for hearing loss, the listener with hearing loss must lean more heavily on their top-down processing to make sense of the message. This explains why someone with hearing loss is prone to fatigue when listening in noise, as their brain must work harder to make sense of the message -- much of which doesn’t get transmitted to the brain because of the damage to the peripheral hearing mechanism. On the other hand, one of the most consequential factors associated with aging is the effect it has on top-down processing. While there is significant individual variability, as a person ages, their auditory memory and other executive functions begin to wane.
Even though the synergistic effects of top-down and bottom-up processing are critically important to successful communication in noise, these two variables alone do not provide the complete picture of communication in acoustically challenging social situations. To get a more comprehensive view of all the factors associated with communication effectively in noisy places we turn to a model, created by Verena Uslar, a hearing scientist at Oldenburg University. Her holistic model, comprised of five factors, summarized in Figure 2, explains why communication in any acoustically challenging situations might fall short of a person’s expectations.
According to the model, communicating in noisy places is a continuously shifting equilibrium between fast, input-driven bottom-up processing and more effortful and slower, experience-driven top-down processing. As Figure 2 shows, communication in noise is a gauge in which different listener specific factors can shift the pivot point between success and failure at any given moment in time. Change one of the factors and the ability to understand the message improves or degrades, sometimes instantly -- a phenomenon illustrated by the smiling and frowning faces in Figure 2.
Notice first that individual factors like age and hearing loss are balanced with situation-specific factors such as signal-to-noise ratio of the listening situation, linguistic complexity of the sentences presented, and the contextual information provided during communicative interactions with other people. n To better understand the model, let’s examine each of the five contributing factors that shift the equilibrium between being able to participate in the conservation (smiling face) and feeling annoyed, frustrated, and embarrassed when parts of the conversation is missed (frowning face).
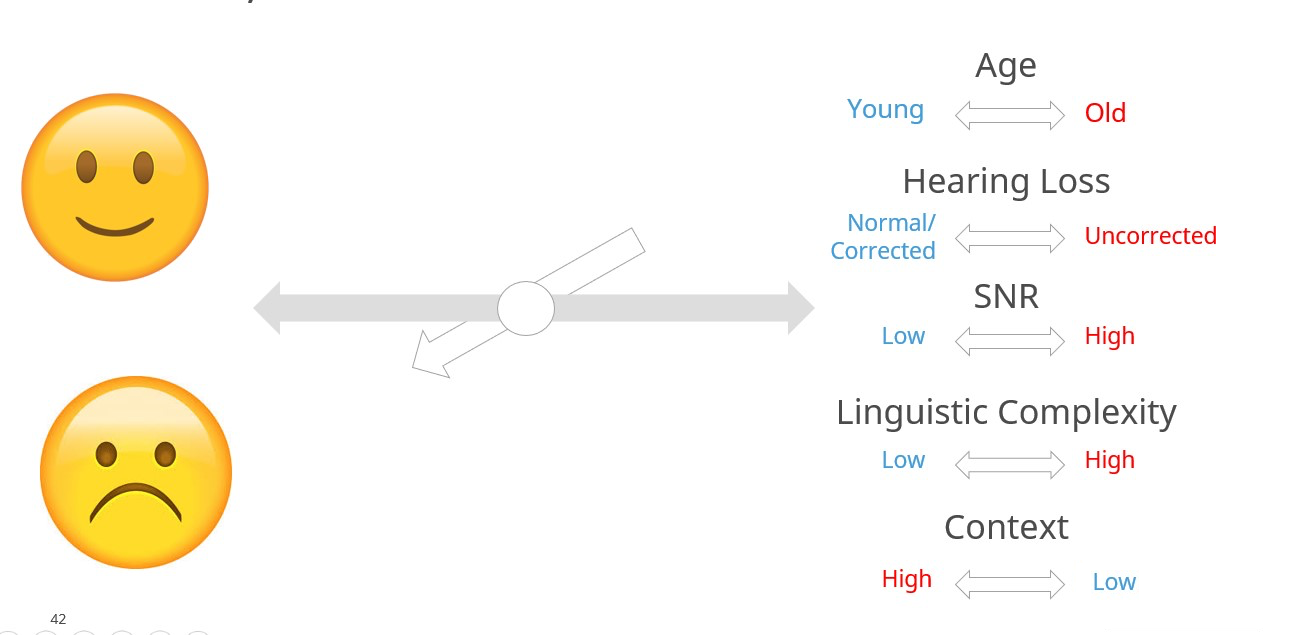
Figure 2. The five factors that contribute to the shifting equilibrium of successful communication in noise. Adapted from Uslar et al (2015). The words in blue denote favorable communication ability and words in red denote the factor results in unfavorable communication ability for the listener.
- Age: The combination of chronological age and cognitive age. Older individuals are more prone to the slowing of working memory, speed of comprehension and speed of verbal response, as all decline with increasing age.adults Adults over the age of about 80 are particularly vulnerable. (Uchida, et al 2019).
- Context: The listener’s ability to rely on her intuitive knowledge of language to fill in any blanks of the utterance that might be masked by the poor acoustics of the room. Low context refers to a relatively simple utterance in which the probability of filling in the blank is good, whereas high context refers to a more complex utterance when guessing is more likely to be wrong.
- Linguistic complexity: This factor refers to several characteristics of language such as familiarity of the talker’s voice, familiarity of topic and overall length of the utterances that shape the listener’s ability to follow the conversation in noise.
- Hearing Loss: Ranging from normal hearing thresholds (or corrected with amplification) to hearing loss (uncorrected with amplification), this factor refers to the fidelity of the incoming sounds that are effectively transmitted from the cochlea to the auditory cortex.
- Signal-to-Noise Ratio (SNR): As discussed in Part 1 of this article, this factor refers to the relationship between the level of talker(s) of interest and the level of the background noise. Favorable SNRs are generally 5 dB or higher, while adverse SNRs are generally lower than 5 dB.
Walk into any bar, restaurant, or café when it is busy and the ability to communicate successfully is determined by the complex interaction of these five factors. Note that linguistic complexity, context and age are factors unlikely to be managed or controlled by the clinician. None of these three factors can be directly corrected through use of amplification, however listeners can be taught to recognize when each of these three might present a problem, and properly fitted hearing aids give wearers a better chance of successfully understand speech in noise when these other factors are challenging. For example, all listeners can be educated on why it is okay to guess in order to fill in the blanks when part of the message in not heard, while older listeners should be advised that they are prone to getting more fatigued compared to middle aged adults when subjected to noisy crowds for an extended period.
Of the five factors contributing to success or failure during any listening situation, the two factors that clinicians can correct with properly fitted hearing aids are the negative impact of SNR, and of course, hearing loss. Let’s look more closely at these two factors: 1.) what factors hinder effective communication in noise? and 2.) how can clinicians account for and correct these factors with hearing aids?
The Impact of Peripheral Hearing Loss
Before examining the impact of peripheral hearing loss on communication in noise, it is helpful to discuss the acoustic range of speech signals. For example, take a speech signal of 65 dB SPL, a common level when listening in a quiet situation. It might be tempting to think this speech signal has a “flat” frequency response—that is, a level around 65 dB for all frequencies—which is a result of the conversion of SPL to HL when displayed on the audiogram. During person-to-person conversations, as discussed in Part 1, we are concerned with SPL, not HL, and the SPL spectrum of the speech signal is not flat. The speech spectrum shown in Figure 3 is that of the International Speech Test Signal (ISTS; overall level of 65 dB SPL) which has been shaped to represent the International Long-Term Average Speech Spectrum (ILTASS) (Holube, 2015).
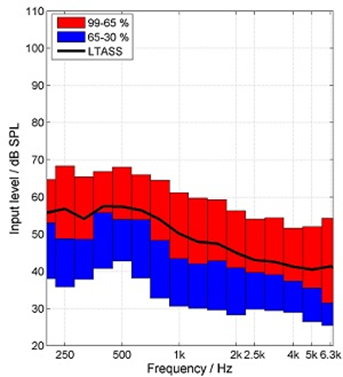
Figure 3. The International Speech Test Signal (ISTS; overall level of 65 dB SPL) which has been shaped to represent the Long-Term Average Speech Spectrum (LTASS). Thanks to Gus Mueller for creating this Figure.
Note that while the overall level for this measurement was 65 dB SPL, the greatest average output (LTASS) at any single frequency is 58 dB SPL (e.g. ~500 Hz), and in the higher frequencies (e.g., 2000-4000 Hz), the output is no more than 40-45 dB SPL. This clearly explains why it is so easy for background noise to mask out these high frequency components of speech, which are vitally important for speech understanding. Now, let’s look at the masking effects of background noise in combination with hearing loss.
It is reasonable to assume that when hearing loss is present, the harmful effects of background noise is more obvious. The one-two punch that background noise and hearing loss delivers to speech understanding perhaps best can be understood by the Speech Intelligibility Index (SII), more specifically the SII count-the-dot audiogram (Killion & Mueller, 2010). The 100 dots on this specially designed audiogram represents the “speech banana.” The number of audible dots are a simplified representation of the SII. The density of the dots is consistent with the importance function of that frequency for understanding speech (e.g., more dots in the 1500-3000 Hz region than in the lower frequencies).
Shown in the far-left panel of Figure 4 is the impact of a background noise, predominantly low-frequency, on speech audibility. The resulting SII is .65—this is adequate for nearly 100% understanding of words in sentences. In the middle panel, we see that a common mild-to-moderate downward-sloping hearing loss will reduce the SII to .56—this is still adequate to understand >90% of words in sentences. But in the far-right panel, we see the effects when this person with only a mild hearing loss is in background noise. The SII is now .26—a value that would result in only about 40-45% understandings of words in sentences, probably not good enough to follow a conversation.
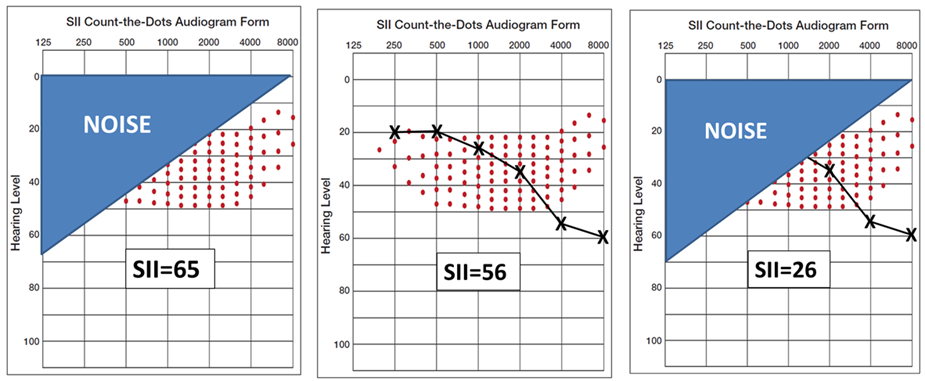
Figure 4. Example using the Count-the-Dots Audiogram of how hearing loss and background noise can combine to reduce the Speech Intelligibility Index (SII). Thanks to Gus Mueller for creating this Figure.
For individuals with hearing loss, the primary reason for their communication difficulties in background noise is lack of audibility. Therefore, throughout the rest of this article we will refer to peripheral hearing loss as audibility loss and we will contrast it to another condition, distortion loss. Many of the important speech cues (dots on the audiogram in Figure 4) are inaudible to the person with hearing loss. Several studies, including Humes (2007), suggest that when persons with uncorrected hearing loss listen at average conversational levels, upwards of 90% of their problem is explained by the fact that many speech cues are inaudible. Figure 5 further illustrates this challenge as it relates to average and loud levels of conversation. The three solid parallel lines in Panel A of Figure 5 labelled 60, 75, 90 dB SPL represent the long-term speech spectrum at those three respective levels. The dashed lines represent the average hearing thresholds for 60- 70- and 80-year-olds.
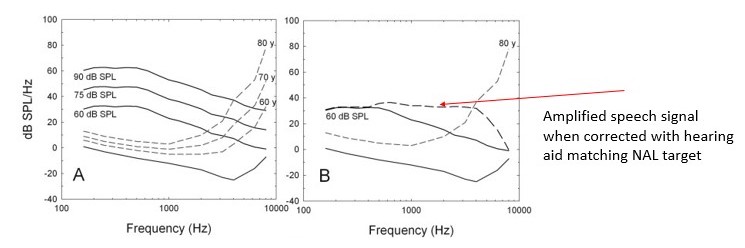
Figure 5. Panel A shows how progressively higher speech levels interact with hearing thresholds as a function of age. The dashed line in Panel B shows how a hearing aid set to match a NAL target restores audibility. Adapted from Humes 2007.
Panel B illustrates the advantages and limitations of using amplification to restore audibility. The horizontal dashed line in Panel B denotes the gain from the amplified speech signal Note that many of the missing speech cues, lost because of hearing loss, have been restored with amplification, but not 100% of them. As any busy clinician knows, you could easily adjust the gain of the hearing aid to restore all the missing speech cues. However, two problems are likely to occur: 1.) wearers are apt to report incoming sounds are too loud, and 2.) acoustic feedback may occur even with a hearing aid’s automatic feedback canceller is activated.
In the ideal world, simply restoring audibility with properly fitted hearing aids would enable persons with hearing loss to better use their bottom-up processing to communicate in noise. However, many individuals who, even when audibility is restored with hearing aids and better able to use their bottom-up processing, continue to struggle in background noise. What accounts for this poorer than expected performance in noise – even after hearing aids have been properly fitted?
The Impact of Distortion Loss
In 1978 Reiner Plomp first described that speech recognition performance in noise for individuals with hearing loss is driven by two factors: a.) the attenuation component of hearing loss, which we described with the count-the-dots audiogram, and a problem that is corrected with amplification by restoring audibility, and b.) the distortion component of hearing loss that cannot be corrected by restoring audibility with amplification.
Mead Killion in the 1990s wrote extensively about this distortion component of hearing loss. He labelled it Type II hearing loss or inner hair cell loss and contrasted it with Type I hearing loss which originates in the outer hair cells of the cochlea. Killion (1997) even showed that Type II hearing loss could be identified easily in the clinic with speech in noise testing, and that individuals with Type II inner hair cell damage needed to be fitted and counseled differently compared to those with Type I hearing loss. Even though it’s been written about extensively for more than 25 years, most clinicians still don’t take the time to identify patients who might have this distortion loss. We think that needs to change. The rest of this article describes how you can differentiate Type I audibility hearing loss from Type II distortional hearing loss in a clinically efficient way and once you’ve identified it, how to make sensible recommendations that improve communication in noisy social situations.
Accounting for Individual Performance Differences in Clinic
Spend a week in a busy clinic and you’ll quickly realize there is considerable individual variability of performance in noisy places. Take two persons with the same degree of threshold hearing loss or similar word recognition in quiet scores, and it is likely each person functions very differently in background noise. What accounts for that difference, and importantly, how do you accurately identify those performance differences across individuals in your clinic?
The simple answer is you do not rely on the pure tone audiogram or word recognition test as it is usually conducted to account for these functional communication differences. Of course, it is not enough to simply make an assertion without evidence, so let’s review the evidence supporting this claim.
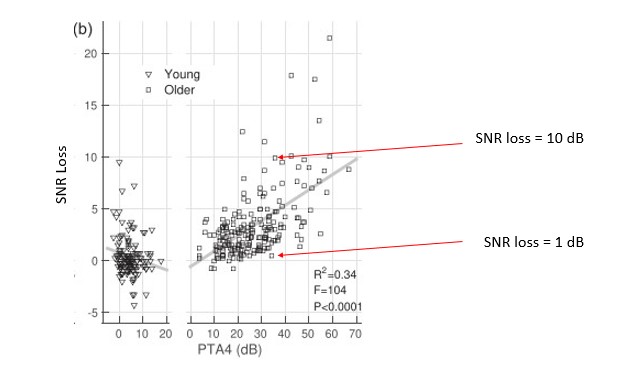
Figure 6. Signal to noise ratio (SNR) loss as a function of PTA4 for a group of younger and older listeners. Young listeners are shown on the left graph with triangles and older listeners are shown on the right graph with squares. Adapted from Ross, et al (2021).
Figure 6 illustrates the relatively weak relationship between functional communication ability in noise, as measured on the Quick SIN, and the degree of hearing loss on the audiogram. Ross, Dobri and Schumeann (2021) measured performance in noise using the Quick SIN on 354 individuals with self-reported normal hearing, ranging in age from 18 to 90 years. Their participant pool was divided into two groups, adults aged 59 and younger and adults 60 and older. Figure 6 shows the relationship between speech-in-noise (SNR) loss and the four-frequency pure tone average (PTA4). Although there is certainly a trend showing that SNR loss increases as the degree of threshold hearing loss worsens, note as the PTA4 increases (threshold hearing loss gets worse), especially for the older group, the variability across individuals broadens. It is of particular interest that for PTA4’s greater than 35dB HL, a group likely to be considered hearing aid candidates, the range of SNR loss scores varies from 0 dB to greater than 15 dB. For example, the two red arrows in Figure 6 designate the Quick SIN scores for two people with the same 35 dB PTA4 but with completely different degree of SNR loss. Even though these two individuals have essentially the same mild to moderate hearing loss on the audiogram, their functional communication ability, as measured by the Quick SIN, is likely to be quite different.
This variability in SNR loss scores as a function of degree of hearing loss is further illustrated in Figure 7. Davidson, Marrone and Souza (2022) examined the relationship between SNR loss (measured bilaterally with the Quick SIN) and high frequency pure tone average (HFPTA) for the better of the participants’ two ears. They analyzed results from 107 adults between the ages of 60 and 93 years that obtained hearing aids from community clinics. Their analysis showed a relatively strong correlation between PTA and SNR loss, however, like Ross et al (2021) as the degree of hearing loss increases, the variability in SNR loss considerably broadens. Take, for example, a relatively ordinary degree of hearing loss seen in the clinic, 60 dB HFPTA. As the red arrows in Figure 7 suggest, it is common to see SNR loss scores range between <5 dB and >15 dB. An indication that pure tone thresholds do not reflect functional communication ability.
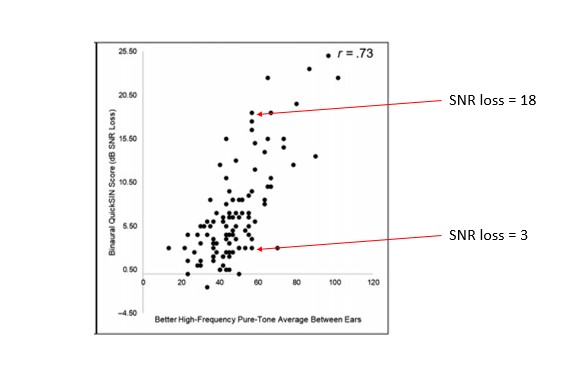
Figure 7. The relationship between SNR loss as measured on the Quick SIN and two different calculations of pure tone average. Adapted from Davidson et al 2022.
The same trend holds true for another commonly conducted diagnostic test, word recognition in quiet. Although traditional word recognition testing using the NU-6, when conducted properly, has diagnostic value (Mueller & Hornsby, 2020), it tends to be a relatively poor indicator of functional communication ability in noise.
Perhaps the largest study that compared speech-recognition-in-quiet to speech-recognition-in-noise comes from Wilson (2011) which was conducted on 3430 veterans (6% had normal hearing). He found that of the 3291 veterans evaluated with the words-in-noise (WIN) test for both ears, only 7% exhibited normal performance (50% correct point of ≤6 dB SNR). Interestingly, but not surprisingly, 50% of these individuals had speech-in-quiet scores (NU-6) of 90% or better.
Unpublished data from Fitzgerald (2022) shows a similar trend: some individuals with “excellent” (92% to 100%) or “good” (92% to 80%) scores on the popular NU-6 word list in quiet have a significant deficit on the QuickSIN. Together, these findings suggest word recognition testing is quiet is a poor indicator of functional communication ability in acoustically challenging social situations. Fortunately, there is a test, one that has been available for more than 20 years, which provides invaluable insights on individual performance in noise.
What Is SNR Loss?
Recall from Part 1 that an individual’s ability to understand speech in challenging listening situations is largely dependent on the intensity level of the background noise and the intensity level of the talker of interest. As reviewed in Part 1, the intensity level of the talker is dependent on the intensity level of the background noise. That is, talkers tend to raise the level of their voice to accommodate increases in the surrounding background noise, as Table 2 in Part 1 showed. These two values, when combined, provide us with the signal-to-noise ratio (SNR) of the listening situations. Let’s further that discussion by examining the SNR value required for the person to carry on a conversation with nominal effort in a noisy place.
Since we now know functional communication ability in acoustically challenging situations is not readily indicated from the pure tone audiogram or word recognitive in quiet testing, it is important that we have some meaningful way to quantify this ability. Fortunately, with sentence-length speech in noise testing, in which the signal-to-noise ratio of the words or sentences is adaptive within the test, we can obtain an accurate measurement of when communication breaks down in noise.
Signal-to-noise ratio (SNR) loss is a measurement of how much louder a speech signal needs to be above the background noise for the listener to understand speech. SNR loss describes the signal-to-noise ratio of the listening situation at which 50% of the words in the sentences are intelligible to the listener. For example, if a listener’s SNR loss is 8 dB, it means that another person talking to them across the table must raise their voice 8 dB above the noise to be intelligible to the listener, relative to a normal hearing person. Or similarly, the noise must be reduced by 8 dB, relative to a normal hearing person, for the listener to understand the conversation.
To fully appreciate the SNR loss measurement, it is helpful to revisit the performance/intensity (PI) function. Recall the PI function is the relationship between speech recognition probably and the average speech amplitude (Boothroyd, 2008). Figure 8 is an example of what the PI function looks like for someone with normal hearing. Additionally, Figure 8 shows how the normal PI function changes depending on the type of speech signal used. Note that for a closed set of digits that slope is extremely steep, while for an open set of single words, because there is no contextual information, the slope is much flatter. Note also that red circle around the IEEE sentences. This is the speech signal used in the Quick SIN; thus, the blue dotted line represents the normal PI function for that test. Since the 50% mark on IEEE sentences occurs at 2 dB SNR for young, normal hearing adults, that serves as our baseline score on the Quick SIN – a topic we cover next.
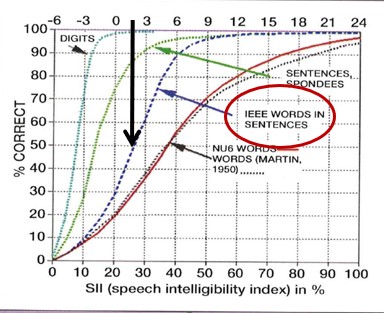
Figure 8. Normal PI Function for various types of speech signals. The black arrow designates the SNR where 50% correct mark for IEEE sentences is obtained.
Although numerous speech intelligibility in noise tests, using either single words or sentences, could be conducted in the clinic, the Quick SIN is probably the most prudent choice for several reasons. One, the Quick SIN has been validated (Killion, et al 2004) so we know that the test reliably measures what it is supposed to measure, speech intelligibility performance in noise. Two, the test is readily available on most computer-based audiometers or on older audiometers a compact disc version can be used. Three, because it uses a method in which the SNR is varied throughout the test, rather than fixed, the test is rarely too easy. (One of the biggest drawbacks of speech in noise tests that use a fixed SNR method is the test often runs into ceiling effects.) Four, the test can be conducted in a matter of three to five minutes as part of a routine hearing assessment under earphones. Five, because the test uses multi-talker babble as the background noise and presents sentences at a “loud but okay” MCL it is a realistic simulation of the cocktail party problem – a ubiquitous challenge encountered by most patients. For all these reasons, the Quick SIN is a great way to evaluate how persons with hearing loss perform in noise compared to those with normal hearing.
Objective Assessment: The Quick SIN
As the name implies, the test takes less than five minutes to conduct in most cases and can be completed during a routine hearing assessment through a pair of standard clinic earphones. Additionally, the Quick SIN uses six different prerecorded signal-to- noise ratios (+25 to 0) and six sentences per list with only one sentence at each level of the SNR levels. It uses a female talker with four competing talkers which provides informational masking and makes the Quick SIN reflective of real world listening in a crowded social situation. Finally, the test is easy to administer and easy to score. Figure 9 is a sample from List 1 of the Quick SIN. Note the number of words correctly repeated are recorded for each sentence. The clinician simply adds up the number of correct words and subtracts that number from 25.5 to obtain the SNR Loss score.
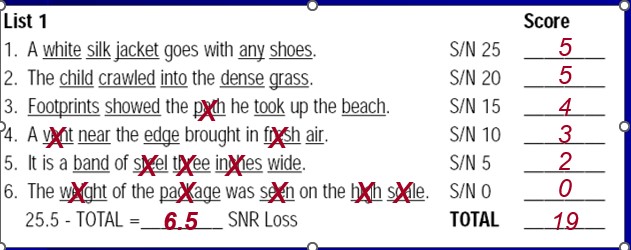
Figure 9. A sample score sheet from List 1 of the Quick SIN.
In the example shown in Figure 9, an SNR loss of 6.5 dB indicates that the listener needs the speech to be 6.5 louder than the background noise to carry on a conversation. In other words, this listener needs a 4 dB more favorable SNR compared to an individual with a normal SNR loss condition of 2.
Here are a few more tidbits about the Quick SIN that are good to know as you put it into routine clinical use:
- Each patient should get 1-2 practice sentences at a +20 or +25 SNR.
- Patients should be instructed the test simulates demanding listening environments and provides insights on how they perform in these conditions.
- Patients should be encouraged to guess.
- While it is perfectly okay to conduct the test binaurally, we believe it is helpful to obtain separate ear information. For example, patients with one “bad” ear on the Quick SIN would be counseled differently than someone with a “good” score in each ear.
- The Quick SIN is like a Swiss Army Knife – it has several uses. We discuss the primary application of the Quick SIN in this paper: unaided, under earphones at a “loud but okay” level. But the test also can be completed in the soundfield at a lower intensity level (50 dB HL) to demonstrate the ill-effects of peripheral hearing loss on speech intelligibility in noise, and the benefits of amplification for restoring audibility of soft speech. It even has sentences with high frequency filtering that look for cochlear dead zones.
- Given its sentence length, the Quick SIN taxes auditory memory, much like noisy situations in the real world do for some listeners. One could even argue that the Quick SIN is a handy screening tool for central auditory processing when scores are dramatically worse than expected (Atcherson, et al, 2015).
- In our opinion, because you are immersing the patient in a simulated acoustically challenging listening situation, the Quick SIN is an effective way to objectively assess functional communication ability in noise. Given the prevalence of “hearing in noise” complaints, the Quick SIN should be completed on every patient seen in your practice for a hearing aid evaluation.
- For more details on speech-in-noise testing using the QuickSIN, such as critical difference values and words list to avoid, see Mueller (2016).
Current Clinical Standards – The What
The Audiology Practice Standards Organization (APSO) was formed recently by a group of clinical experts, dedicated to the growth of the profession through the provision of evidence-based standards. Standards are created through a collaborative process, posted on the APSO website and free for all to download. We believe APSO standard, S2.1 Hearing Aid Fitting for Adult & Geriatric Patients, aligns with the use of the Quick SIN in the clinic, as well as some of our other recommendations outlined in this tutorial. Specially, these two sections of the S2.1 standard are directly related to the assessment of functional communication ability.
- A needs assessment is conducted in determining candidacy and in making individualized amplification recommendations. A needs assessment includes audiologic, physical, communication, listening, self-assessment, and other pertinent factors affecting patient outcomes.
- Pre-fitting testing includes assessment of speech recognition in noise, unless clinically inappropriate, and frequency-specific loudness discomfort levels. Other validated measures of auditory and non-auditory abilities are considered, as appropriate for the individual patient.
Importantly, standards inform clinicians about what they should be doing with patients. We have decided to take these standards one step further by providing some guidance on how they can be conducted when assessing the functional communication in noise capabilities of adults with hearing loss. The next section describes a process in which Quick SIN results can be used to address patient complaints, establish more precise patient expectations, and even select the best hearing aid technology.
Layering Solutions – The How
“So, you’re telling me there’s a chance……” – Lloyd Christmas, Dumb and Dumber
Perhaps the best reason to conduct unaided Quick SIN testing on every patient, and one that is likely to separate outstanding in-person clinical care from over the counter “care,” is that you are testing someone in a way that is directly related to their chief complaint: an inability to hear in background noise. The simple act of testing in conditions that reflect real-world problems shows patients you understand their condition and why they are seeking help from a professional.
A second reason is related to selecting the best technology and counseling patients about their expectations. We outline this approach in Table 1. Basically, as the SNR loss gets worse, the more technology, counseling support and accessories are applied (or layered) to the problem.
Degree of SNR Loss | Minimal Treatment Recommendations | Estimated Prevalence* |
|---|---|---|
0-2 dB (normal) |
| 10% |
3-6 dB (mild) | Add ….
|
45% |
7-12 dB (moderate) | Add….
| 33% |
>12 dB (severe) | Add ….
|
12% |
Table 1. A layering approach to hearing aid selection based on the SNR loss of the individual. This approach was used clinical by the first author and is based on his experience. *Based on the Quick SIN scores of 205 adult hearing aid candidates. Data collected by first author from 2002-2004 in a dispensing practice. Average age = 72.5
It should go without saying, of course, that every patient, even those with a normal 0-2 SNR loss, are likely to benefit from noise reduction technology. After all, virtually every prescription hearing aid on the market today has digital noise reduction and some type of directional microphone technology. In theory, at least, these patients would experience remarkable improvements in SNR in adverse listening conditions, mainly from the use of directional microphone technology. Moreover, just about every amplification device on the market today, including several PSAPs have some type of noise reduction algorithm, designed to reduce steady-state noise. So yes, all patients are likely to have, at a minimum, basic noise reduction algorithms on their hearing aids. The larger point we are trying to make is that patients with a normal score on the unaided Quick SIN may perform just fine in noise by simply optimizing audibility and allowing their brain to separate the speech from the noise, as occurs for young, healthy adults with excellent hearing. Soon, with the advent of self-fitting devices sold OTC, patients with a normal score on the Quick SIN perhaps could be good candidates for this new device category.
In contrast, individuals with larger unaided SNR loss deficits, not only need a more extensive array of noise reduction technology available to them, these wearers must be counseled and educated differently, as outlined in Table 1.
Here is another strategy that reflects how this “layered solution” approach might work: Let’s say you have a patient with a normal Quick SIN score of 2 dB. This patient might benefit from a hearing device with low compression thresholds, zero delay and no distortion. Essentially a hearing aid that sends clean, undistorted amplified sounds to the brain. While another patient with moderate SNR loss, say a score of 10 dB, might benefit from a more aggressive approach to lowering the signal-to-noise ratio that uses bilateral beamforming and other processing schemes to maximally improve the SNR. The role of the audiologist is to choose the philosophical approach to improving communication in noise that addresses each of these Quick SIN scores most effectively.
Subjective Assessment: The SSQ-12
While the Quick SIN provides helpful objective information about the functional communication status of the individual, an objective SNR loss score often does not give us much insight into the individual’s own perception of the problem. As most clinicians know, there is often a gap or disconnect between the results of a standardized test conducted in the booth and how the patient views the problem. For example, think of the occasions when you obtained a poor score one of your basic hearing assessment tests, say word recognition in quiet, and the patient says with considerable surprise, “I think I understand words clearly.”
Researchers have studied these inconsistencies in objective test measures, obtained in your soundbooth, and how the patient judges their own ability in real world listening conditions. They have found that some individuals tend to over-estimate their ability to hear in noise, while others tend to under-estimate it. Several years ago, Saunders and Forsline (2004) developed a procedure using the Hearing in Noise test (HINT) to find a patient’s Performance-Perceptual Discrepancy (PPDIS). The PPDIS is the difference between the performance and perceptual speech reception threshold in noise scores. It essentially measures the extent to which listeners might "misjudge" their ability to hear in noise. By comparing an objective measure from the HINT to a subjective measure in which the patient tells you when their communication ability breaks down as the SNR on the test changes, the clinician conducts a performance-perceptual test (PPT).
More recently, perhaps because the HINT is rarely used in clinical practice, Ou and Wetmore (2020) developed a version of the PPT that uses the Quick SIN. Similar to the version developed by Saunders and Forsline (2004), the PPT using the Quick SIN identifies patients who are over-estimating or under-estimating their ability to hear in noise. Gaby Saunders has even developed some useful counseling tools you can use for patients who might be under-estimating or over-estimating their ability. While we encourage motivated clinicians to use the Quick SIN version of the PPT, it does double the amount of time spent conducting speech in noise testing – something many clinicians do not have.
Given these time constraints, there are other approaches to gathering subjective patient information that are probably more efficient. Additionally, other listening variables such as sound quality, localization, ease of communication, concentration ability, listening effort and ability to actively participate in conversations, which are not directly assessed with the Quick SIN, can be readily obtained with the use of a validated self-report.
Validated self-reports or questionnaires are a proven method of gathering this subjective information about individual performance in noise. Of course, there are several validated questionnaires that can be used to complete this task, including the International Outcome Inventory for Hearing Aids (IOI-HA), the Client-Oriented Scale of Improvement (COSI) and several versions of the Hearing Handicap Inventory (HHI). All of them use some type of quantifiable scale (e.g., 0 to 10) that measures several domains of the individual’s perception of their functional communication ability or quality of life.
One self-report, we think, that complements the Quick SIN is the SSQ-12 (Noble et al 2013). The Speech, Spatial, Quality Questionnaire (SSQ-12) is a validated, easy to administer and easy to score questionnaire that assesses several important variables associated with performance in acoustically challenging situations. The SSQ-12 is a shortened version of the original Speech, Spatial and Qualities of Hearing scale (SSQ) designed by Gatehouse and Noble (2004) to be used as a complement to objective measures of hearing ability.
The SSQ-12 focuses on several facets of listening in acoustically challenging situations. This makes it a useful complement to the Quick SIN during the assessment process. Table 2 lists each of the questions on the SSQ-12, along with the specific subscale associated with each item. Although the SSQ-12 is intended to be completed during an in-person appointment, the creators of it suggest the test/retest reliability of the SSQ-12 is good when it emailed to a patient, allowing it to be completed prior to an appointment with the clinician.
SSQ-12 Question | Aspect of Performance in Acoustically Challenging Situations | Mean Score for older adults with normal hearing (Banh, Singh and Picora-Fuller, 2012) |
1. You are talking with one other person and there is a TV on in the same room. Without turning the TV down, can you follow what the person you’re talking to says? | Speech in presence of noise |
7.8 |
2. You are listening to someone talking to you, while at the same time trying to follow the news on TV. Can you follow what both people are saying? | Listening to multiple speech streams |
6.7
|
3. You are in conversation with one person in a room where there are many other people talking. Can you follow what the person you are talking to is saying? | Speech in presence of speech |
5.5 |
4. You are in a group of about five people in a busy restaurant. You can see everyone else in the group. Can you follow the conversation? | Speech in the presence of noise |
7.1 |
5.You are with a group and the conversation switches from one person to another. Can you easily follow the conversation without missing the start of what each new speaker is saying? | Listening to multiple speech streams |
7.1 |
6. You are outside. A dog barks loudly. Can you tell immediately where it is, without having to look? | Localization |
7.6 |
7. Can you tell how far away a bus or a truck is, from the sound | Distance and movement |
6.9 |
8. Can you tell from the sound whether a bus or truck is coming towards you or going away? | Distance and movement |
7.3 |
9. When you hear more than one sound at a time, do you have the impression that it seems like a single jumbled sound? | Segregation of sounds in listening environment |
7.3 |
10. When you listen to music, can you make out which instruments are playing? | Identification of sounds |
8.0 |
11. Do everyday sounds that you can hear easily seem clear to you (not blurred)? | Sound quality and naturalness |
9.0 |
12. Do you have to concentrate very much when listening to someone or something? | Listening effort |
7.3 |
Table 2. The SSQ12 questions and corresponding subscales and mean score for older adults with normal or near normal hearing. Note the SSQ-12 uses a 0 to 10 scale. Adapted from Noble, et al 2013.
How to Use the SSQ-12
The preferred way, of course, to administer the SSQ-12 is during an in-person hearing assessment appointment. For example, the patient could be given the SSQ-12 upon check-in at the front desk to complete prior to their appointment with the clinician. After the initial hearing assessment, including the Quick SIN, is completed, the results of the SSQ-12 and Quick SIN scores could be used to develop individualized goals and treatment plans. Beyond subjective information of patient perception that is discussed during the initial assessment appointment, the SSQ-12 can be used as an outcome measure. Figure 10, which is question 12 on the questionnaire, illustrates one approach to scoring the SSQ-12. Note the 0-10 scale. The “U” corresponds to the patient’s rating in the unaided or pre-treatment condition, while the “A” corresponds to the aided or post-treatment condition. Note also there is another version, the SSQ-12-Benefit (B), which directly asks about the perception with hearing aids vs. previous unaided condition.
During the initial assessment, after the patient has completed the SSQ-12, the clinician could review each response to the twelve questions and target the areas that are the most challenging for that individual. Generally, if the absolute value of the pre-treatment scores is six or lower, that subscale can be targeted for improvement through treatment (Banh, Singh, & Pichora-Fuller, 2012). Additionally, when scoring in the aided or post-treatment condition, clinicians should be looking for increases in scores, which are indications of relative benefit associated with communication in acoustically challenging situations.
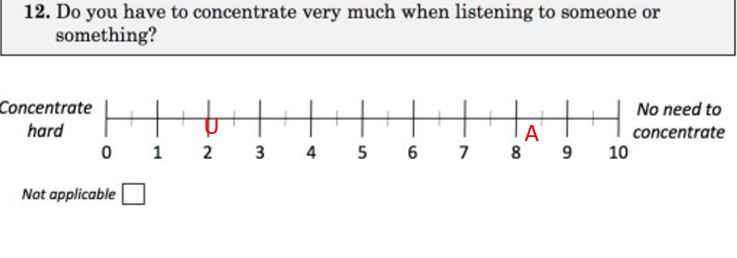
Figure 10. One of the SSQ-12 questions showing an example of how it can be scored pre and post treatment. U = unaided, A = aided
Additionally, the means scores for older adults with normal or near normal hearing are shown in Table 1 for each question on the SSQ-12. Note that for nine of the 12 questions the mean score is around a 7. These mean scores serve as a benchmark for hearing aid wearers, who should be reminded that on the SSQ-12, their aided scores should be on par with these published mean scores.
Final Thoughts on the Second “P,” Person
- Based on a recent review article by Davidson et al (2021), compared to other components of a standard battery of audiometric tests, results of speech-in-noise tests had the highest associations to hearing aid satisfaction. As stated by the authors, “this suggests a greater role for assessment of speech-in-noise perception in auditory rehabilitation. This is an important finding for clinical practice, given that audibility was not a significant factor in predicting satisfaction.” Simply stated, even when audibility has been optimized with amplification, speech-in-noise performance can be the difference between success and failure in noisy listening places. Along those lines, it is helpful to share with patients that as they age (and the longer they forego treatment) the worse their performance in noise is likely to be.
- Even though individual outcomes vary, in general, the greater the individual’s SNR loss the more technology and counseling is needed to remediate the problem. Knowing the patient’s unaided SNR loss scores is an avenue toward a more candid and forthright conversation about the use of special features (remote microphones), expectations and outcomes.
- Although the Quick SIN is an effective measure of speech intelligibility performance in background noise, it is not intended to provide a complete picture of communication ability in acoustically challenging situations. In addition to a comprehensive needs assessment, clinicians are encouraged to use the SSQ-12 to quantify self-perceptions of various aspects of listening in these situations. By combining the results of the Quick SIN and SSQ-12 during the functional communication assessment, clinicians obtain a more holistic view of communication abilities in the places where person with hearing loss seek the most improvements with treatment – acoustically challenging social situations.
- We think that perhaps the most effective use of pre-treatment results on the Quick SIN and SSQ-12 is when their combined results are used to have a forthright, candid and more specific conversation with patients about their expectations. This point is illustrated in the 4-box matrix in Table 2. Note in Table 2 four different counseling approaches, listed A-D, that can be applied to each patient in a targeted way. Using the results from the SSQ-12 and Quick in this mannerfosters a deeper understanding of what each patient needs to do to find success and benefit in their most highly valued noisy listening situations.
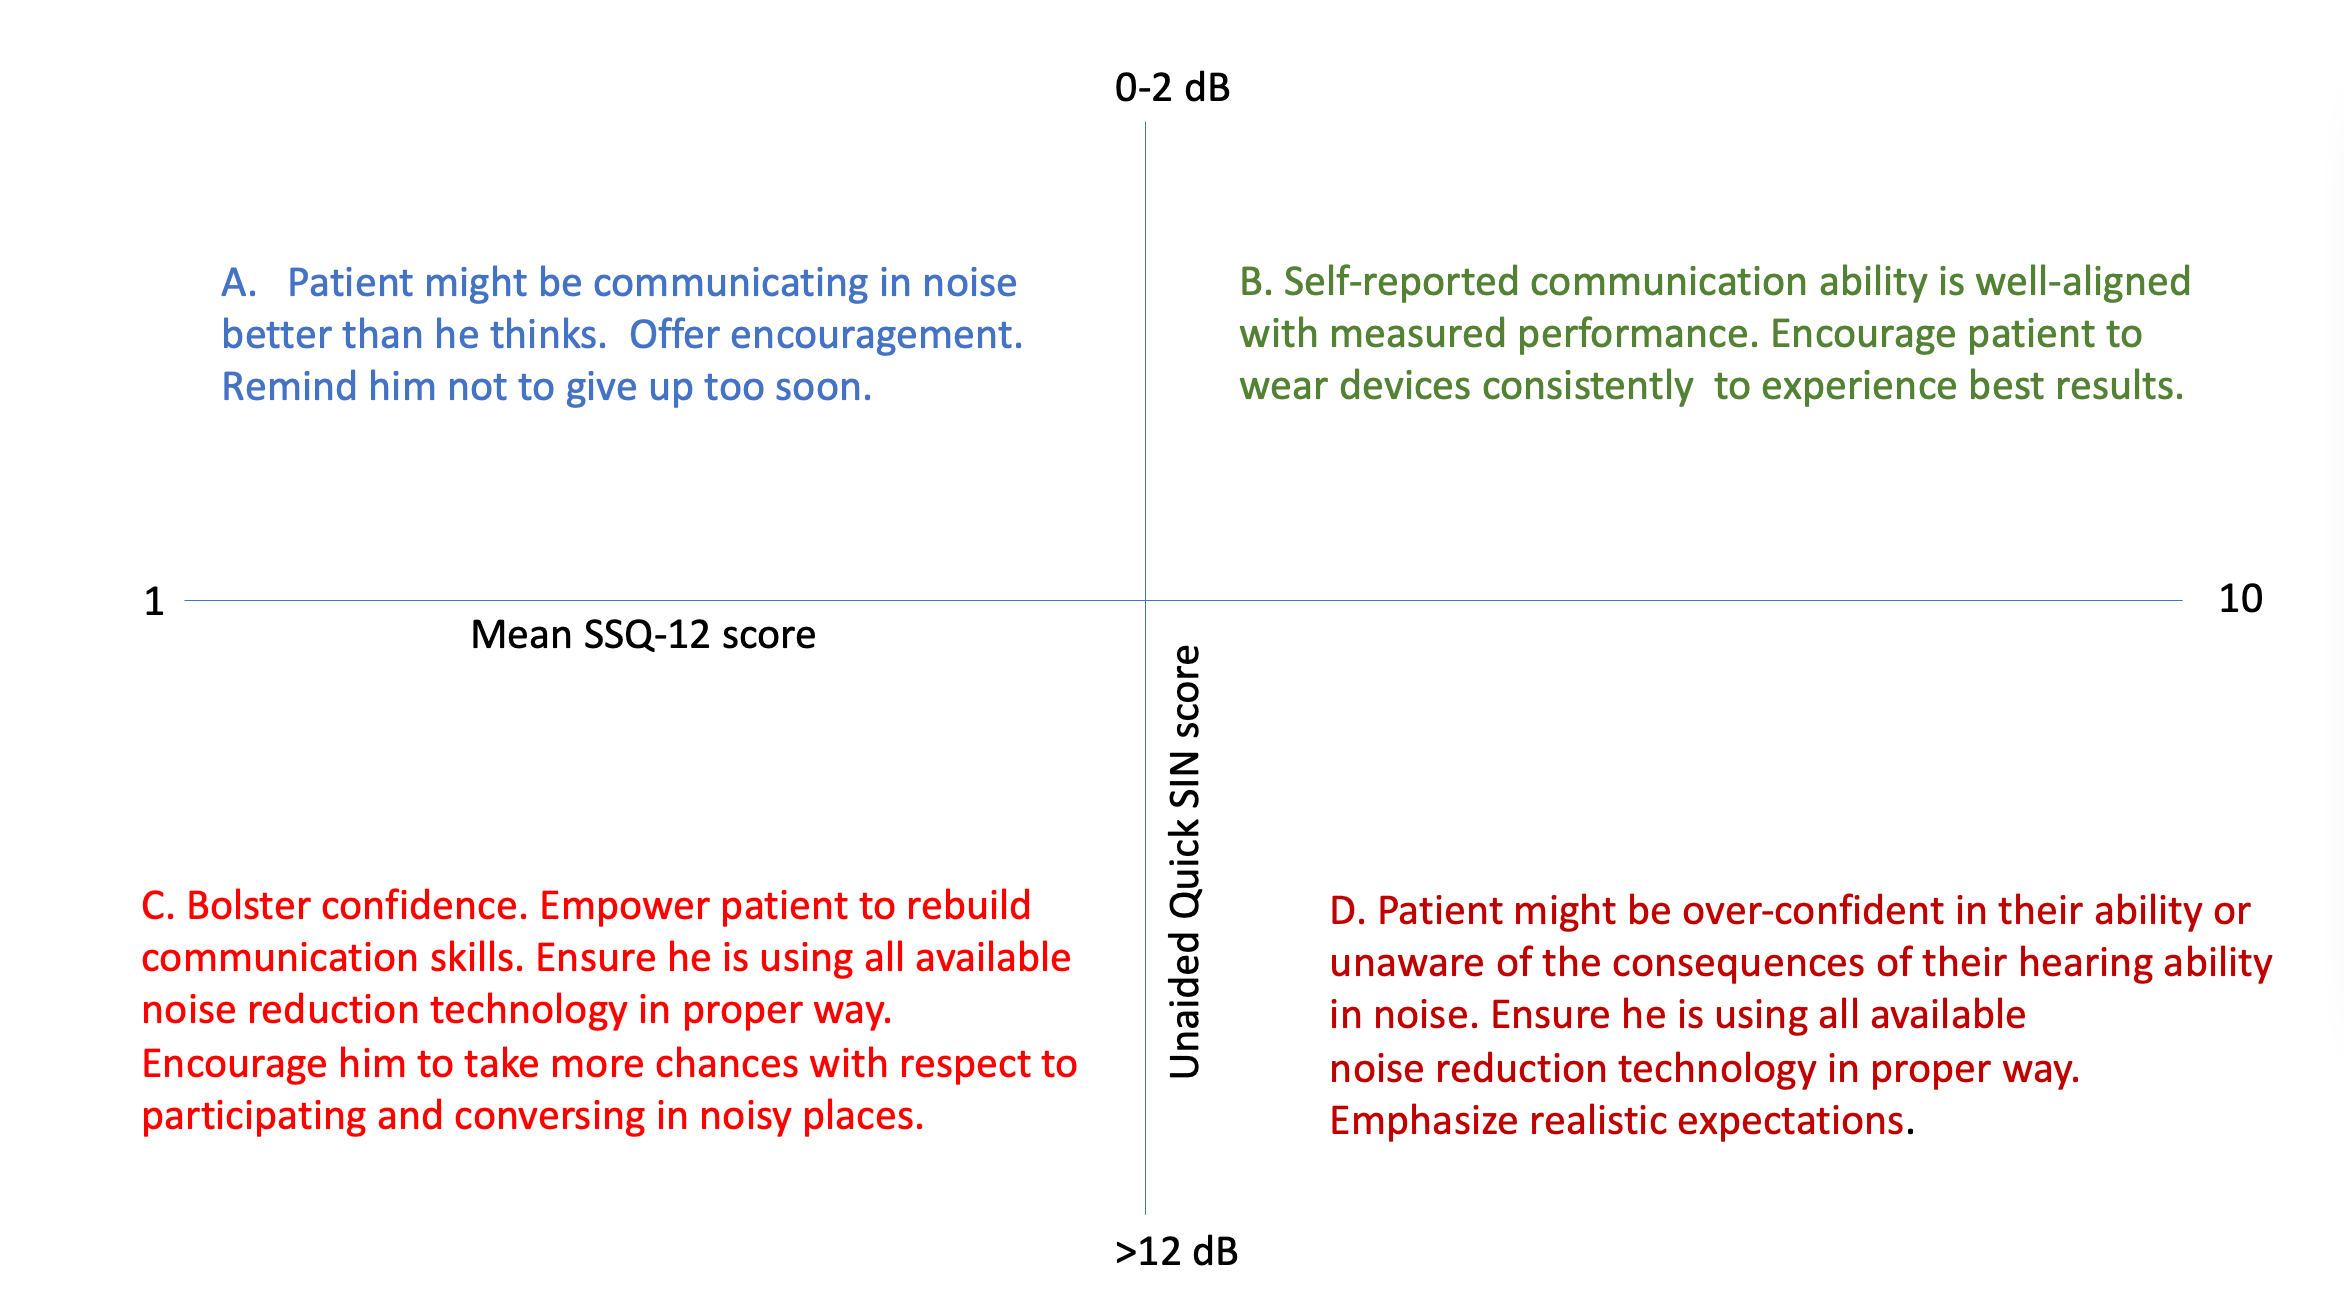
Table 3. Table 3. A four-quadrant matrix summarizing how the SSQ-12 and Quick SIN are used to counsel patients. This concept is based on Saunders & Forsline (2006).
What About the Gray Areas?
Astute readers will notice there is a large gray area on both the Quick SIN and SSQ-12 scores summarized in Table 3. Of course, many patients have middling scores that fall somewhere in between how we classify “good” and “poor.” The gray areas are where your ability to provide comprehensive and holistic patient-centered care comes into play. Your ability to navigate the grays areas is why many individuals will continue to pay for individualized solutions – even in the face of good over-the-counter hearing aid options. In our opinion, the Quick SIN and SSQ-12 scores in the unaided condition don’t really predict real world aided benefit – there is simply too much individual variability to do that. Instead, these scores help target specific treatment goals and temper realistic expectations.
Finally, it must be said that while careful and deliberate use of tools like the Quick SIN (or any other adaptable SNR test) and the SSQ-12 (or any other validated scale that quantifies functional communication ability in acoustically challenging places) is an essential part of upholding patient-centered clinical standards, as the primary role of the audiologist is to keep people socially active, mentally sharp and connected to people at home and in the workplace. Therefore, the approaches outlined here should be viewed as a means to this end.
In the third and final installment in this series, the authors address the role of the audiologist in optimizing hearing aid performance by following several evidence-based fitting and fine-tuning principles.
References
Appleton, J. (2022). What is important to your hearing aid clients… and are they satisfied? Hearing Review. 29(6), 10-16.
Atcherson, S. R., Nagaraj, N. K., Kennett, S. E., & Levisee, M. (2015). Overview of Central Auditory Processing Deficits in Older Adults. Seminars in hearing, 36(3), 150–161.
Banh, J., Singh, G., & Pichora-Fuller, M. K. (2012). Age affects responses on the Speech, Spatial, and Qualities of Hearing Scale (SSQ) by adults with minimal audiometric loss. Journal of the American Academy of Audiology, 23(2), 81–140.
Davidson, A., Marrone, N., Wong, B., & Musiek, F. (2021). Predicting Hearing Aid Satisfaction in Adults: A Systematic Review of Speech-in-noise Tests and Other Behavioral Measures. Ear and hearing, 42(6), 1485–1498.
Gatehouse, S., & Noble, W. (2004). The speech, spatial and qualities of hearing scale (SSQ). Internal Journal of Audiology, 43(1), 85-99.
Holube, I. (2015). 20Q: getting to know the ISTS. AudiologyOnline, Article 13295. Retrieved from https://www.audiologyonline.com.
Humes, L. E., Lee, J. H., & Coughlin, M. P. (2006). Auditory measures of selective and divided attention in young and older adults using single-talker competition. Journal of the Acoustical Society of America, 120, 2926–2937.
Killion, Mead C. (1997). The SIN report: Circuits haven't solved the hearing-in-noise problem. The Hearing Journal, 50(10) 30-34.
Killion, M. C., Niquette, P. A., Gudmundsen, G. I., Revit, L. J., & Banerjee, S. (2004). Development of a quick speech-in-noise test for measuring signal-to-noise ratio loss in normal-hearing and hearing-impaired listeners. The Journal of the Acoustical Society of America, 116(4 Pt 1), 2395–2405.
Killion, M. C., & Mueller, H. G. (2010). The new count-the-dot audiogram. Hearing Journal, 63(1), 10-15.
Mueller, H. G. (2016). Signia Expert Series: Speech-in-noise testing for selection and fitting of hearing aids: worth the effort? AudiologyOnline, Article 18336. Retrieved from https://www.audiologyonline.com
Mueller, H. G., & Hornsby, B. W. Y. (2020). 20Q: Word recognition testing - let's just agree to do it right! AudiologyOnline, Article 26478. Retrieved from https://www.audiologyonline.com
Noble, W., Jensen, N. S., Naylor, G., Bhullar, N., & Akeroyd, M. A. (2013). A short form of the Speech, Spatial and Qualities of Hearing scale suitable for clinical use: the SSQ12. International journal of audiology, 52(6), 409–412.
Ou, H., & Wetmore, M. (2020). Development of a Revised Performance-Perceptual Test Using Quick Speech in Noise Test Material and Its Norms. Journal of the American Academy of Audiology, 31(3), 176–184.
Pichora-Fuller, M. K., Schneider, B., & Daneman, M. (1995). How young and old listeners listen to and remember speech in noise. Journal of the Acoustical Society of America, 97, 593–608.
Plomp, R. (1978). Auditory handicap of hearing impairment and the limited benefit of hearing aids. The Journal of the Acoustical Society of America, 63(2), 533–549.
Ross, B., Dobri, S., & Schumann, A. (2021). Psychometric function for speech-in-noise tests accounts for word-recognition deficits in older listeners. The Journal of the Acoustical Society of America, 149(4), 2337.
Saunders, G. H., & Forsline, A. (2006). The Performance-Perceptual Test (PPT) and its relationship to aided reported handicap and hearing aid satisfaction. Ear and hearing, 27(3), 229–242.
Uchida, Y., Sugiura, S., Nishita, Y., Saji, N., Sone, M., & Ueda, H. (2019). Age-related hearing loss and cognitive decline - The potential mechanisms linking the two. Auris, nasus, larynx, 46(1), 1–9.
Uslar, V. N., Brand, T., & Kollmeier, B. (2015). Modeling the balance between bottom-up and top-down processing in speech intelligibility tests. J Acoust Soc Am, 137, 2235
Wilson, R. H. (2011). Clinical Experience with the Words-in-Noise Test on 3430 Veterans: Comparisons with Pure-Tone Thresholds and Word Recognition in Quiet. J Am Acad Audiol, 22(7), 405-423.
Citation
Taylor, B. & Jensen, N. (2022). Optimizing patient benefit in acoustically challenging social situations, part 2: person. AudiologyOnline, Article 28390. Retrieved from https://www.audiologyonline.com