
A recorded webinar is available, Research QuickTakes Volume 7: Clinical Tips From Recent Hearing Aid Research.
Learning Outcomes
After this course learners will be able to:
- Describe three pre-fittiing considerations recently described in the literature.
- Describe the importance of pre-fitting SIN testing and the protocol for the QuickSIN.
- Describe considerations related to compression release time and the potential limitations of the default music program.
- Describe considerations related to instant-fit eartips, and how “listening in” can be helpful during the fitting process.
- Describe the clinical utility of the REOR as part of verification, and how the SII can be used in grading the hearing aid fitting.
7.1: Pre-Fitting Considerations
Did you know...that over 400 articles are published each year related to hearing aid technology, selection, fitting and verification of hearing aids. So much to read—so little time! But we can help. In this Volume 7 of Research QuickTakes, we take a close look at what has been published over the past few years, and collect a grouping of articles that have direct clinical application—something that you maybe even can implement on Monday Morning!
We’ll start off in this issue (7.1), talking about some considerations that need to be made surrounding patient candidacy and the determination of the potential benefit from hearing aids.
MarkeTrak 2022 Data on Hearing Aid Adoption
There is no better place to obtain an understanding of hearing aid adoption rates than the MarkeTrak surveys. In case you’re not aware, as of 2022, the MarkeTrak surveys are no longer designated with a number, e.g., “VIII” or “9,” but rather by the year that the survey was conducted. This is a welcome change, as knowing the year of data collection is important when conducting comparative observations and historical reports. It’s also important to note that MarkeTrak 2022, was summarized in several articles published in Seminars in Hearing (all articles are open-access), making the data easy to find, and maybe even use in our patient counseling.
One of these articles relates to the latest MarkeTrak findings for hearing aid adoption (Jorgenson and Barnett, 2022). Their findings show that slightly more (11.3%) of those who identify as male report having some level of hearing loss, compared with 9.1% of females. HCPs report that their hearing aid patients are more male than female, however, the MarkeTrak 2022 data reveal that female respondents with hearing loss report similar adoption rates as males (42% vs. 43%).
To no one’s surprise, as people age, the percentage who report hearing loss increases. The recent data found: <10% for those younger than 65 years, 21% for those 65 to 74 years, 34% of those 75 to 84 years of age, and 56% of those 85 years of age or older. The age-related trends of hearing device adoption rates show a somewhat unique U-shaped curve, as shown in Figure 1.
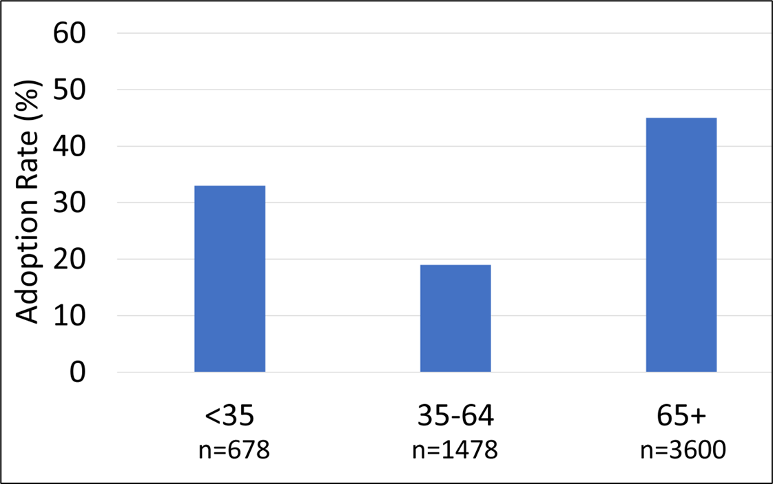
Figure 1. Distribution of hearing aid adoption rates (in percent) for three different age groups: <35, 35-64, and 65+ years of age (Adapted from Jorgensen, 2022).
Notice that adoption rates are ~14% higher for the <35 age group, than for the 35-64 age range. It’s logical that adoption is greatest for the 65+ group, as we know that they have more hearing loss, but why is the younger group higher than the middle aged? One could speculate that the “stigma” of looking old isn’t present for this age group, as it might be for the older respondents. There also may be a greater awareness of hearing loss due to earlier testing and education in this area. Another factor is the degree of hearing loss for the younger group (See Figure 2). Notice that a greater proportion report that they have a profound hearing loss.
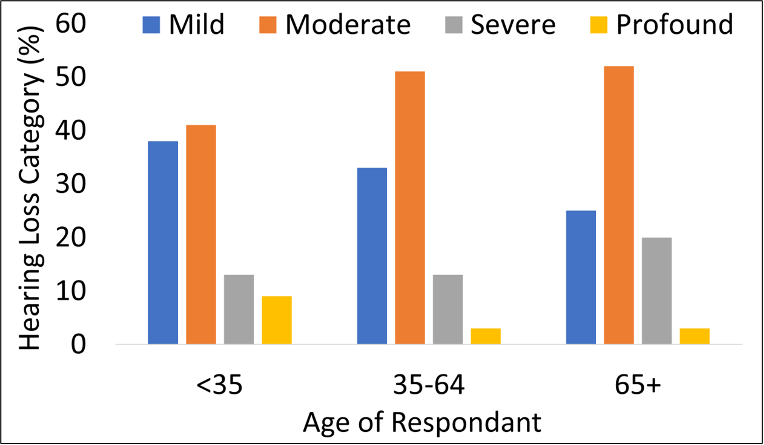
Figure 2. Degree of reported hearing loss (in %) as a function of three different age groups: <35, 35-64, and 65+ (Adapted from Jorgensen, 2022).
Significant Others at the Appointment
Regarding the topic of hearing aid adoption rates, it’s important to consider if the patient attended the fitting consultation appointment by themselves, or with a significant other. Previous research has shown that when there is a significant other in attendance at audiology appointments, there are greater odds of hearing aid adoption, and also, increased satisfaction with hearing aids. But . . . Is there an association between the type of significant other in attendance at appointments and hearing aid adoption? This was the question asked in the research by Ellis et al, 2022.
The study sample consisted of adult patients from a chain of private clinics in the UK who either attended their audiology appointment with a significant other (n = 10,015) or alone (n = 37,152). Six “significant other” types were identified and classified: Partner (n = 6,608), Parent (n = 76), Child (n = 2,577), Sibling (n = 208), Friend (n = 518) and Caregiver (n = 28). The hearing aid adoption finding agreed with previous research, in that having a significant other present, increased the adoption rate (by ~6 to 12%). Additionally, they report that indeed, the type of significant other does matter. Adoption was ~6% greater when the significant other was a child (we assume this refers to adult children). Consequently, this study tells us that having a significant other attend an appointment is beneficial to the hearing aid selection process, and as an added bonus, whenever possible, the most effective significant other is the adult child of the person with hearing loss.
What is Normal Hearing?
A general time-honored belief of hearing aid dispensing is that you don’t fit hearing aids to someone with normal hearing, a pretty obvious pre-fitting consideration. If you want to go by this rule, and you are using the audiogram as the metric, it’s of course important to know exactly what is normal hearing—and it appears that not everyone agrees on these values. If you simply go to “audiogram” at our old friend Wikipedia, you’ll see one audiogram that shows 0-20 dB as “normal”, but another that shows 0-25! But wait . . . it gets worse . . . if you go to Google images, you’ll find an audiogram from one of our professional organizations, the ASHA, showing that the soft components of average speech are 35 dB HL. The Hearing Industry Association uses 20 dB HL for normal hearing, although if we move a little north, the Canadian Hearing Industry Association uses 15 dB HL.
So, what is the correct value? Some of you older readers might remember when 25 dB was a common cut-off, although it’s difficult to find the supporting data for the use of this value. Certainly, the value should be equal to or better than the level of the soft components of average speech, which when converted to the HL audiogram, have been shown to be 20 dB or better (see review by Mueller et al, 2014).
A few years back, audiologist Chris Spankovich (2020) wrote a summary article on this topic, first reviewing data from decades ago, but then building a reasonable case for why 15 dB should be the cut-off for normal hearing. He starts off by assuming that reference zero is a well-estimated guess of the lowest detectable sound a human adult with presumed normal hearing sensitivity can hear. He then goes on to state that of course, we expect variability around the average level and need to accept some variance in our measurements—two standard deviations (SDs) often are used for this purpose. The variance for pure-tone audiometry is approximately a 5 dB SD. Applying 15 dB (3 SDs) is a conservative cutoff, which would account for 99.7 percent of the variance. Spankovich (2020) adds that this value also is in line with what we consider a clinically significant change in hearing, or a significant threshold shift.
In line with this reasoning, the past 20 years or so it has become common for many forward-thinking audiology groups and organizations to adopt the 15 dB HL cut-off, usually then referring to the 15-24 dB range as “minimal” or “slight,” a category with less hearing loss than “mild,” which begins at 25 dB HL.
Our definition of what pure-tone thresholds suggest is normal hearing is intertwined with listening to what patients tell us about their hearing ability. For example, Edwards (2023) recently reported that one of the largest hearing healthcare providers in Australia had noted that over 20% of the people who come to their centers for assistance are found to have PTAs less than 25 dB HL. The disconnect between the audiogram and the patient’s self-perceived handicap, of course, is not breaking news. Going back to 1990, Gates et al. found, based on a large demographic study, that ~20% of people who reported that they had a hearing loss actually had a “normal” audiogram. Clearly, we need to consider both the audiogram and the patient’s self-assessment of their hearing ability when determining hearing aid candidacy.
A Look at Patient Self-Report
One self-report scale that has been used for decades is the HHIE/A. We provided some pre-fitting step-by-step guidance regarding the use of this scale in QuickTakes 6.4 (Taylor and Mueller, 2023), but here is a brief review. While the 25-item scale usually is used in research, for clinical purposes, the 10-item version is sufficient, and an example is shown in Figure 3. Four points are given for a “yes” answer, 2 points for a “sometimes”, and 0 points for a “no.” The recommended scoring is as follows: 0-8: No significant perception of hearing handicap; 10-22: Mild to moderate perception of a hearing handicap; >22: Perception of a severe hearing handicap.
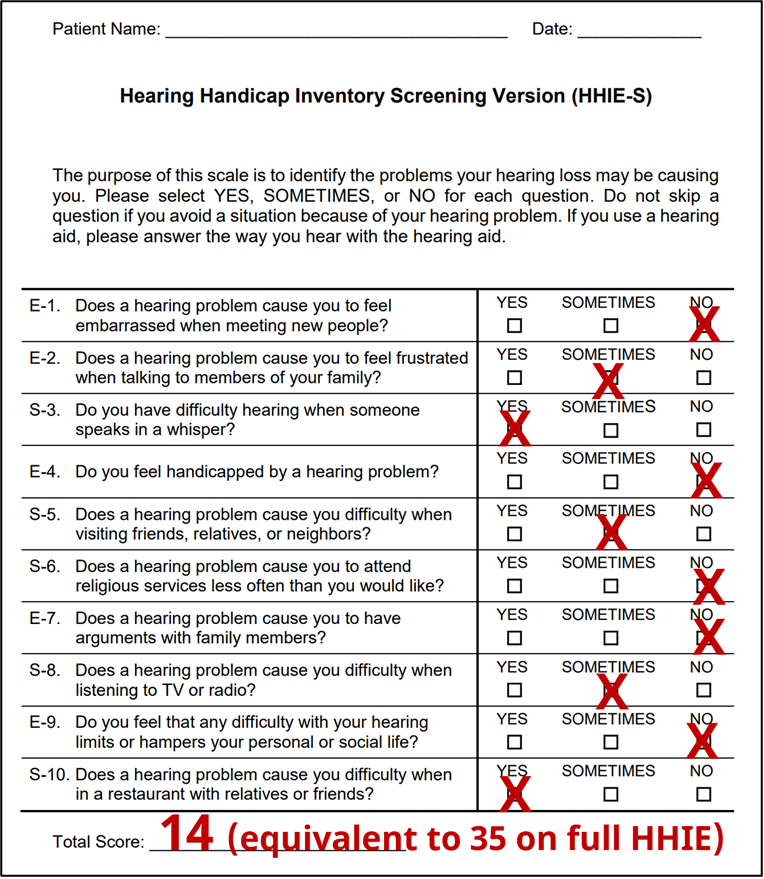
Figure 3. Example of completed HHIE-S form. The resulting score of “14” would place this patient is the “mild-to-moderate” perception of a handicap.
We specifically mention the HHIE/A scale, as it has been used in considerable research related to hearing aid candidacy, and success with hearing aids (See Mueller et al, 2014 for review). Recently much of this research has been conducted by audiologist Larry Humes. In many of his comparisons, Humes has used the hearing loss classification system of the World Heath Organization (WHO), which are shown in Table 1 for six different categories (note: only the PTA of the best ear is considered).
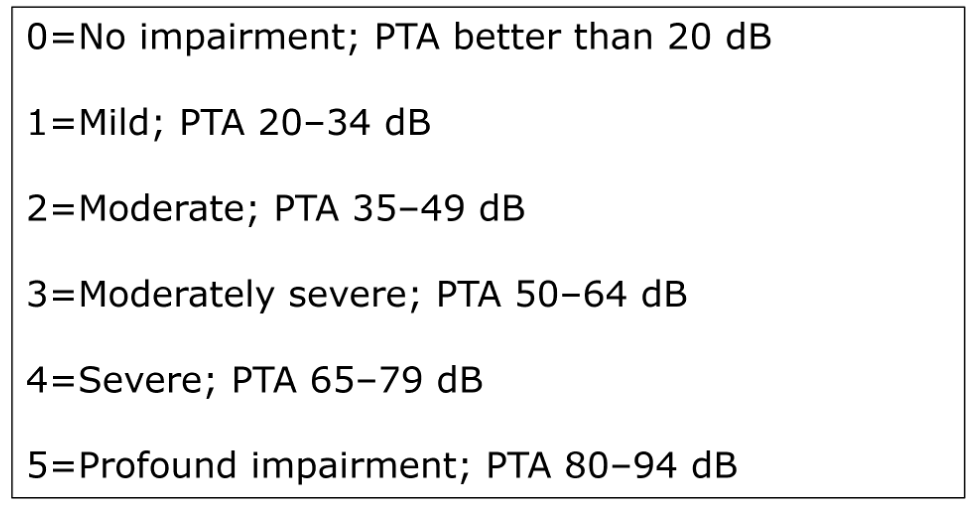
Table 1. The World Health Organization (WHO) categorization of hearing loss. This is based on the best ear PTA of thesholds at 500, 1000, 2000 and 4000 Hz.
As we review the Humes research, it’s important to consider that in some cases, what the WHO definition identifies as “normal hearing” would not be thought of as normal for most HCPs when counseling a patient regarding the use of hearing aids. For example, a patient could have best-ear thresholds of 5 dB at 500 and 1000 Hz, 30 dB at 2000 Hz and 35 dB at 4000 Hz (PTA of 18.7 dB) and still be considered “normal.”
With that said, it nonetheless is important to look at the findings from Humes (2020), shown in Figure 4. These are data from 194 individuals, fitted bilaterally and verified to NAL-NL2 targets, who then used their hearing aids in the real world for several weeks.
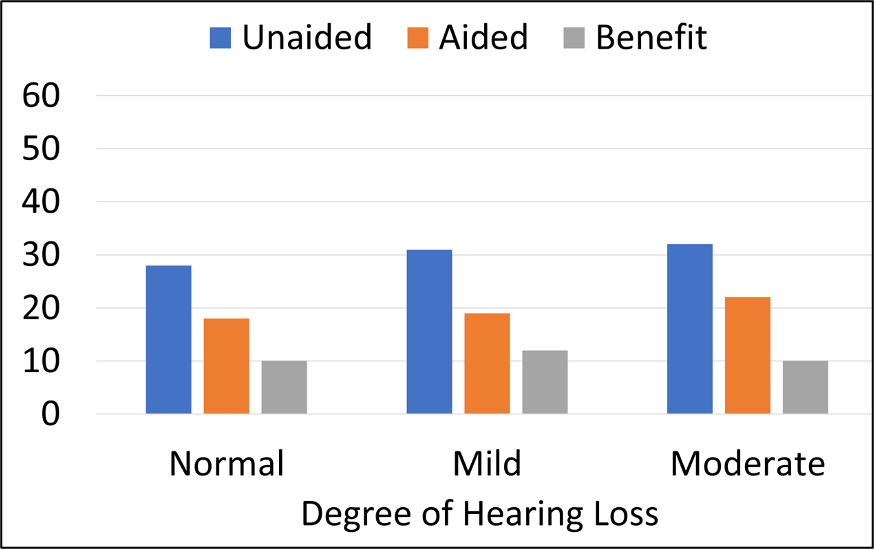
Figure 4. Three groups of participants with different degrees of hearing loss based on the WHO classification. Results shown for the HHIE/A (25-item scale) mean scores for unaided, aided, and the amount of benefit (adapted from Humes, 2020).
For the unaided HHIE scores (blue bars), observe that all three hearing loss groups (based on PTAs) reported perceived hearing difficulties (HHIE/A) to be about the same, with mean HHIE-Total scores ranging from ~27 to 32 (25-item version; this would correspond to ~11-13 scores for the 10-item scale shown in Figure 3). Most importantly, there were no significant differences in mean HHIE benefit among the three groups (see grey bars). Otherwise stated, the individuals with better ear PTAs (<20 dB) had the same perceived benefit from hearing aid use as those with PTAs of 35-49 dB. At the end of the clinical trial, nearly 80% of those in the “normal hearing” group purchased their hearing aids. This research suggests that patients with PTAs in the normal range, who are motivated to try hearing aids, are good candidates for them.
Do Hearing Aids Really Work?
A final area of pre-fitting considerations that we’ll discuss in this QuickTakes segment surrounds the counseling that is conducted at the time the patient is making decisions regarding the purchase of hearing aids. We certainly want to discuss the use of hearing aids in a very positive light—sometimes, however, we might ask ourselves if we are making the use of hearing aids sound better than it really is? And then there also are expectations, which sometimes need to be tempered. As we discussed in QuickTakes v6.4 (Taylor and Mueller, 2023), one technique is to use the items that the patient has selected on the COSI, and then have the patient rate how much benefit they expect to obtain for each item after a few weeks of hearing aid use. During this counseling, what is helpful is to have some real data to show the patient, just to add credibility to what is sometimes viewed by the patient as a sales pitch. Those data are available in most every MarkeTrak survey, including the MarkeTrak 2022 report which we discussed earlier—we are referring to an article by Picou (2022), based on data from this survey.
Historically, questions regarding satisfaction used in MarkeTrak surveys related directly to different listening situations, and were, more or less, focused on hearing and understanding. In recent years, these surveys have included more general questions regarding such things as “quality of life.” It is interesting, therefore, to examine if the quality-of-life ratings have improved over the past ~7 years. The results are very encouraging. Figure 5 displays the percent of patients from three different MarkeTrak surveys (2015-2022), who reported that the use of hearing aids “regularly” improves their quality of life.
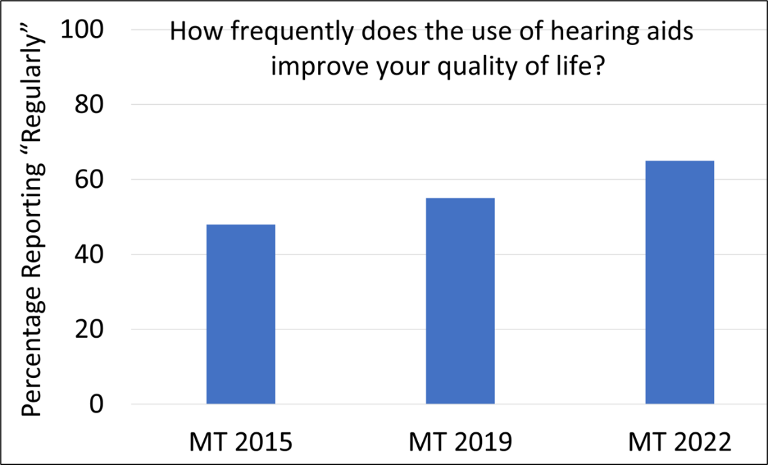
Figure 5. Percent of patients from three different MarkeTrak surveys spanning 7 years (2015-2022) who report that the use of hearing aids “regularly” improves their quality (adapted from Picou, 2022).
Observe that in just the short span of 7 years, the rating of “regularly” has gone from 48% to 64%. Curious minds might ask: “Has hearing aid technology really changed that much in this short time frame?” While features such directional technology, noise reduction and automatic feedback suppress have stayed pretty much the same, the MarkeTrak survey revealed that we have seen significant changes in the areas of rechargeable hearing aids, wireless streaming, television streamers, companion microphones, and downloadable apps for smartphones.
Picou (2022) reports that among those with the ability to adjust their hearing aids using a smart phone app, the most common changes were adjusting the hearing aid volume (50% of respondents), followed by reducing the volume of sounds on the phone during a streamed call (42%), streaming audio or music directly to the hearing aid (37%), and changing programs for different listening environments (35%). She adds that 59% of the hearing aid owners who have apps, use them regularly (at least weekly). We often hear comments from HCPs regarding the high volume of complaints related to using the smartphone apps, but the MarkeTrak 2022 survey showed a relatively high satisfaction rate of 83%. It’s reasonable to assume that at least in part, these convenience features are driving the “quality of life” improvements.
Other data from the MarkeTrak 2022 survey which are very helpful for patient counseling are the comparisons of satisfaction for different listening situations, between hearing aid owners, and individuals with hearing loss who are non-owners. These comparisons are shown in Figure 6.
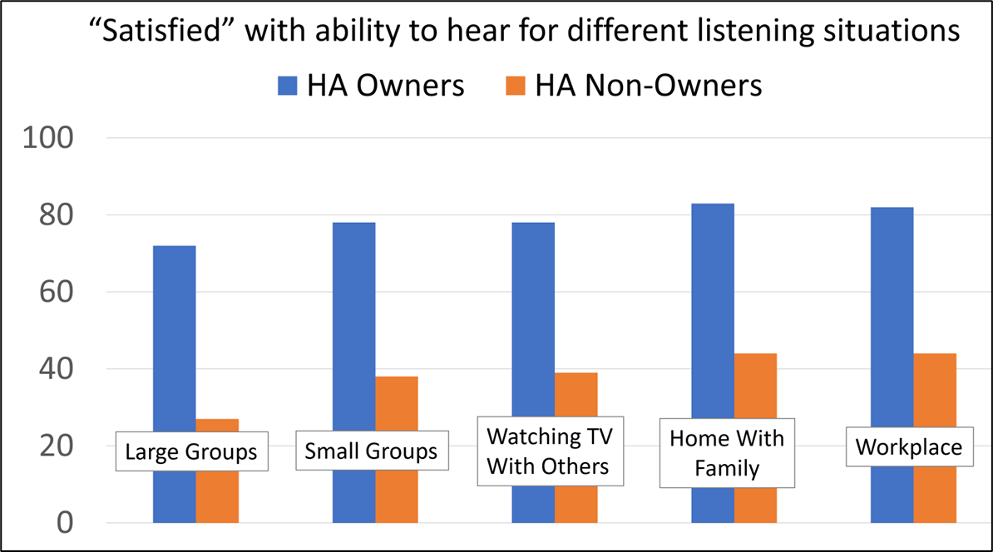
Figure 6. Satisfaction (percent of respondents) with ability to hear in different listening situations for owners of hearing aids vs. individuals with admitted hearing loss who do not own hearing aids (adapted from Picou, 2022).
The data shown in Figure 6 are from 1,061 hearing aid owners, and 1,840 hard of hearing non-owners. Note the large differences in hearing satisfaction for all categories—a difference of 40% or more in most cases. What also is important to point out, is that satisfaction for the hearing aid owner’s is at or near 80% for situations that commonly are thought of as “difficult.” This is near the satisfaction rate for individuals with normal hearing, that has been shown in other research.
Summary
There are many pre-fitting issues that need to be considered. Adoption rates always are an interesting topic, especially following the official introduction of OTC hearing aids. Hand in hand with adoption is the issue of when is a hearing loss considered a hearing loss? As we discussed, for such a relatively basic concept, there does not appear to be a consensus. Intertwined with our thoughts about pure-tone thresholds are the reports from our patients, which research has shown is a consideration that cannot be neglected—pre-fitting self-assessment scales need to be used more frequently. Finally, as shown in MarkeTrak 2022, it’s encouraging to step back and look at all the favorable things our patients who are using hearing aids are telling us, and pass this good news on to our prospective users.
Volume 7.2 Pre-Fitting Testing
We’re still taking about “pre-fitting” but this next section is devoted to those articles that directly related to the testing that can be conducted prior to the hearing aid fitting. As we have reviewed is other Volumes of QuickTakes, pre-fitting testing is critical to the overall success of the fitting; from a technology, programming and counseling standpoint. Although various pre-fitting measures are part of hearing aid fitting guidelines and standards (e.g., the APSO standard, see Mueller 2021 for review), there are still some HCPs, unfortunately, who consider air and bone conduction, and basic speech recognition, the extent of the “pre-fitting test battery.” This of course is far from Best Practice, and so before we begin reviewing some key articles, it might be helpful to review the many uses of pre-fitting measures, which can be frequency specific, speech audiometry or self-assessment scales
Potential uses of hearing aid pre-fitting measures.
- Determine the patient’s perceived hearing loss, degree of handicap and motivation to use hearing aids.
- Quantify hearing problems, and help guide hearing aid fitting decisions; assist in determining candidacy.
- Impact decisions regarding hearing aid technology and assistive listening devices, e.g., help identify those who might need additional help from an assistive listening device, or referral for cochlear implant evaluation.
- Provide information that is helpful for programming the hearing aids (e.g., aggressiveness of features, MPO selection, cochlear dead regions, etc).
- Useful for counseling regarding the provision of realistic expectations, listening strategies, and predicting benefit and satisfaction.
Systematic Review Findings
A good starting point for our examination of the literature is to fall back on a large systematic review of articles related to pre-fitting testing that recently was published by Davidson et al (2021). They specifically set out to answer the question: "Are behavioral pre-fitting measures using speech and nonspeech materials related to hearing aid satisfaction among adults?" They examined six different types of behavioral pre-fitting measures: speech recognition in quiet, speech recognition in noise (% correct), reception thresholds for speech-in-noise (e.g., SNR-50), speech-based subjective ratings, dichotic speech tests, and tests using nonspeech material. The authors initially identified 1342 articles; after all inclusion criteria was applied, only 21 studies remained. The tests that showed potential for clinical application due to significant correlations with satisfaction were all speech-in-noise tests, and included the QuickSIN, the synthetic sentence identification (SSI), the hearing in noise test (HINT), and the acceptable noise level (ANL) test. Important for our discussion here, the pre-tests that were not significantly correlated with satisfaction were pure-tone thresholds and speech recognition in quiet.
Speech-in-Noise (SIN) Testing
As revealed by the systematic review we just discussed, SIN testing is one of the most important pre-fitting measures. This of course, is not breaking news, as this testing was recommended back in 1970 by noted Northwestern audiologists Ray Carhart and Tom Tillman, and by many other authors since. A review article on this topic was just published, covering some recent research in this area (Mueller et al, 2023). One of the issues discussed by these authors is the apparent reluctance of HCPs to include routine SIN testing as part of the standard diagnostic protocol. They cite the work of researchers such as Wilson (2011), who point out, that if an HCP has the choice to conduct either word recognition in noise or word recognition in quiet, the choice clearly would be SIN testing. This notion was supported by the recent work of Fitzgerald et al (2023). Based on data collected from 1000s of patients at their Stanford clinics, using the QuickSIN, these authors suggested that SIN measures should be the default test of speech perception in routine audiometric testing, and that word recognition in quiet only be performed when it is likely to be suboptimal (based on QuickSIN cut-off scores).
Given that the QuickSIN is the most commonly used SIN test, Mueller et al (2023) review some key procedural issues that are important to ensure the accuracy of the measure. We mentioned most of these back in QuickTakes 6.2 (Taylor and Mueller, 2023), but they are worth repeating:
- For earphone testing, use a presentation level of 70 dB HL if PTA is 45 dB or better. If PTA is >45 dB, conduct testing at “loud, but okay” level (just below the LDL).
- Conduct the testing monaurally, always using two lists/ear.
- Use critical difference charts to determine when significant differences exist (see QuickTakes 6.2 for chart).
- Only 7 of the first 12 lists are equivalent for both patients with normal hearing and hard-of-hearing. Only use lists: 1, 2, 6, 8, 10, 11, 12.
If indeed you are using the QuickSIN routinely, or are planning on implementing its use soon, there were two other articles published regarding this test in the past year that are of interest. They only indirectly relate to the fitting of hearing aids, but do add some thought about referral practices, and certainly fall into the “good-to-know” category.
The first article relates to whether the QuickSIN can be considered a test of APD? That wasn’t the design of the test, but . . . the 4-talker babble of the QuickSIN has considerable informational masking. A recent study from the University of Pittsburgh (Cancel et al, 2023) reported on 47 patients with normal or near-normal hearing who underwent assessment for APD because of complaints of hearing loss and/or problems understanding speech in background noise. The authors report that the QuickSIN had a sensitivity (hit rate) of 77%, and a specificity rating of 78% (i.e., false alarm rate of 22%) for this group of patients.
A second article that was just published relates to the use of QuickSIN findings as a screening tool for retro-cochlear pathology. Again, the QuickSIN wasn’t designed for this purpose, but there may be limited use. In a publication from the Stanford University researchers that we mentioned earlier, they reported some intriguing data related to 73 individuals with confirmed vestibular schwannomas (Qian et al, 2023). Receiver operating characteristic curve analysis showed that the right versus left ear asymmetry observed for the QuickSIN score was more sensitive and specific for detecting vestibular schwannomas than the pure-tone average asymmetry or the word-recognition-in-quiet asymmetry. So, while not great, QuickSIN findings could be better than what audiometrically is typically used in some clinics.
SIN Testing: Can it Predict Bilateral vs. Unilateral Candidates?
One of the pre-fitting decisions that must be made for most patients is whether they should be fitted with one or two hearing aids. Logic suggests that if the patient has an aidable hearing loss in both ears, then a bilateral arrangement would be the starting point of the fitting process, although it’s not always that simple.
For you younger readers, we’ll briefly review the history of bilateral vs. unilateral fitting. As recent as the 1970s, it was common belief among audiologists that most adult patients could “do just fine” with only one hearing aid, and that is what was commonly recommended (audiologists could not ethically sell hearing aids until 1977). It was not until ~1990 that the bilateral/unilateral distribution was 50/50. As shown in Figure 7, there was a consistent growth of bilateral fitting until 2015—since that time the split has stayed around 85%/15% in favor of bilateral. Given the number of people with only a unilateral hearing loss, the bilateral preference probably will not go much higher.
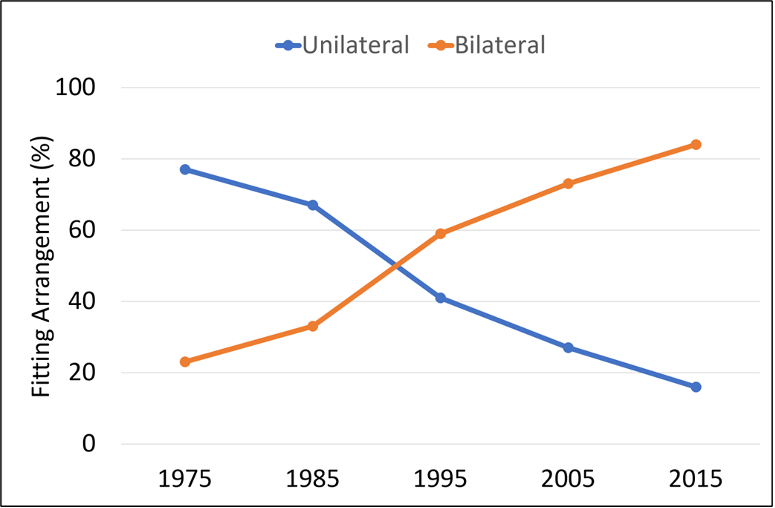
Figure 7. Distribution (in percent) of bilateral vs. unilateral fittings over a 40-year period (1975-2015).
While not common, there are patients who audiometrically would appear to be good candidates for bilateral hearing aid use, however, they prefer a unilateral fitting. There are several reasons why this might happen, but what we’ll discuss here, is a study that examined if this could be predicted by a pre-fitting SIN test (Glyde et al, 2021). As part of a larger battery, the modified version of the Listening in Spatialized Noise–Sentences (LiSN-S) test was administered. The LiSN-S is a test of sentence understanding in a competing speech signal. The speech stimuli are synthesized with head-related transfer functions to create a three-dimensional auditory environment over headphones. The LiSN-S has four subtests, which include measures in regard to where the competing talkers come from, and whether the competing talkers are the same person, or different people than the target talker—this makes it possible to detect the presence of spatial processing disorders.
Sixty-eight participants, fitted bilaterally, were instructed to alternate between unilateral and bilateral hearing aid use over fourteen weeks post-fitting. Results revealed that 78% of participants expressed an overall preference for bilateral hearing aid use, and that the LiSN-S bilateral advantage sub-test outcomes significantly correlated with overall wearing preference. The authors conclude, however, that the accuracy of the predictor was too low to warrant routine implementation of this test prior to hearing aid fittings. We should mention, that even when a SIN test might suggest binaural interference (bilateral performance significantly below unilateral), there may be other reasons to still proceed with bilateral amplification due to the known advantages: elimination of the head shadow effect, binaural summation, improved localization and sound quality.
More SIN Testing: The Acceptable Noise Level (ANL) Test
The ANL test generated considerable discussion following the publication of an article in 2006 (Nabalek, et al), indicated that the ANL had an accuracy of ~85% in predicting success or failure with hearing aids. While this high predictive rate had not been shown in subsequent studies, the ANL is a pre-fitting test that HCPs might conduct routinely, or at the least, keep in their back pocket for special patients.
To review, the ANL is a simple test to conduct, with no special equipment needed. Continuous discourse is presented to patients via earphones, and using a careful bracketing procedure, their MCL is obtained. Next, with the continuing discourse still running, multitalker babble is introduced, and this noise is raised to the point where the patient says that they can “just barely put up with it” while still understanding the continuous discourse. The “put-up-with-it” noise level is then subtracted from the MCL for speech, which is the ANL (it’s not really a level, but rather an SNR). Because of masking effects, even for someone who is not at all bothered by noise, it’s unlikely the ANL will be a negative number. Average ANLs for individuals with normal hearing, and also hearing loss, tend to be ~0-5 dB—the smaller the ANL the better, as this suggests that the person is not bothered by background noise. There is no correlation between the ANL and the person’s SIN score (Mueller et al, 2014).
With this background, we can move on to a recent study related to the ANL test (Hausladen et al, 2022). The authors conducted SIN testing for individuals fitted with both premier and basic technology, to determine if test scores could predict and/or justify a given technology level. The SIN tests conducted were the QuickSIN, the HINT and the ANL. While subjective results showed significantly improved satisfaction for speech in a large group and overall preference when using premium technology, laboratory perception results did not reveal significant differences between technology level on the HINT or the QuickSIN. The ANL, however, was significantly improved for the premium devices. This is a similar finding to previous research by Plyler et al, 2021. We should point out, that while significant, the ANL improvement for the premium model hearing aids was only 2.9 dB; an SNR that would just barely be noticeable for most hearing aid users (McShefferty et al, 2015).
Self-Assessment Inventories—A Way to Help Determine Technology Level?
Since we’ve been talking about methods that might help determine the appropriate level of technology for given patient, it is only fitting that we mention a publication from just a few months ago, that addresses this very issue. Before we get to the study itself, we need to mention that it is connected to research by the same research group that we have discussed in previous Research QuickTakes (Saleh et al, 2022), In general, research regarding patient-specific “appropriate level of technology” has tended to show little difference between the basic and premier products. It was pointed out, however, by Saleh et al (2022), through the use of concept mapping, that there were features and attributes that showed some separation among hearing aid users. These authors have taken these earlier findings as a starting point for developing a new pre-fitting self-assessment scale (Saleh et al, 2023).
This new scale is named the Hearing Aid Attribute and Feature Importance Evaluation or HAFIE. Data was collected from 218 adult participants with a self-reported hearing loss. It has 28-items and measures patient importance ratings for different hearing aid attributes and features. They have also created a shortened version of the HAFIE, consisting of 16-items that might be of better use in the clinic. Both the long and short versions of the HAFIE have eight sections falling into three subscales: “Advanced connectivity & streaming”, “Physical attributes & usability”, and “Sound quality & intelligibility”.
The questions on the inventory are answered using a 5-point importance scale going from 0=Not at all to 4=Very Important. A few examples of the questions from the different subscales are below:
- Using my smartphone I can make the hearing aid focus on speech from a certain direction.
- The hearing aid has a program to use when I am listening to live music
- The hearing aid settings can be changed by the audiologist without me needing to visit the clinic.
- The hearing aid makes speech sound clear and of high quality.
- The hearing aid makes my own voice sound natural.
- The hearing aid allows direct music streaming from my phone into my ears.
The questions from each section are scored, with the notion that the results will be helpful in assisting the patient in deciding the most appropriate technology level.
Loudness Discomfort Level Measures
The final area of pre-fitting testing that we’ll address in this section of QuickTakes is the pre-fitting measurement of loudness discomfort levels. This of course, is a procedure that is part of the APSO standard (Mueller et al, 2021) and something that we’ve detailed in a previous issue—see QuickTakes 6.3 (Taylor and Mueller, 2023). An article related to this measurement that we have selected to discuss reveals the negative consequences that might occur when the setting of MPO is left in the hands of the fitting software, rather than the HCP (Mueller et al, 2021).
Shown in Figure 8 are the MPO measurements for the premier hearing aids of the six leading manufacturers. Using a standard audiogram going from 30-35 dB in the low frequencies to 60-70 dB in the high frequencies, all hearing aids were programmed to each manufacturer’s NAL-NL2, which showed a “match-to-target” in the fitting software.
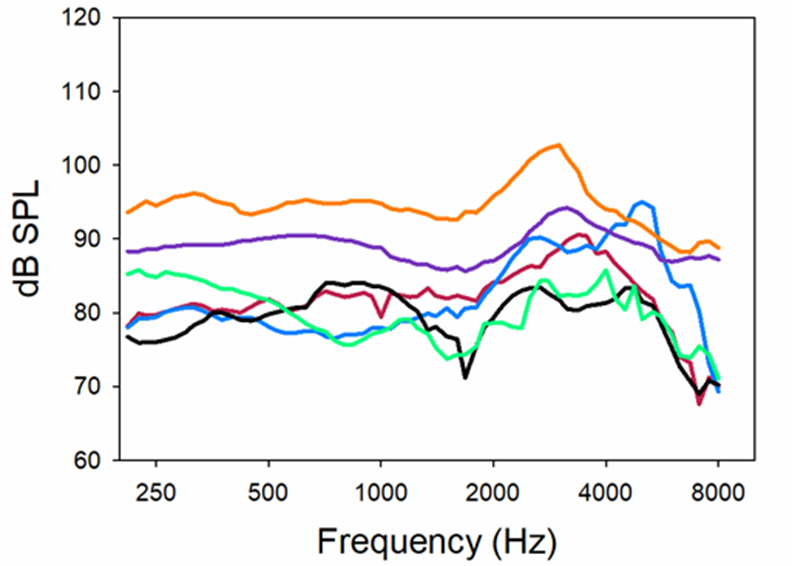
Figure 8. Resulting MPO when premier hearing aids were fitted to the six different manufacturer’s NAL-NL2. All products programmed for a hearing loss going from ~30-35 dB in low frequencies to ~65-70 dB in highs. Predicted NAL-NL2 LDLs for this hearing loss are 100-105 dB (Adapted from Mueller et al, 2021).
As shown in Figure 8, except for the top output curve, all products limited the maximum output considerably more than necessary. Consider that someone with this hearing loss would be expected to have LDLs ~100-105—20-25 dB greater than where the output is limited for some of the products. This programming mistake will significantly reduce the dynamic range, disturbing loudness restoration and unnecessarily distorting speech and music. In some cases, MPOs this low also will make the SNR worse (when speech is above the noise) and consequently have a negative effect on speech understanding. These findings clearly support the need to conduct frequency-specific LDLs, and use these values to program the hearing aids correctly, ignoring the settings suggested by the fitting software.
Summary
In this section we have addressed many areas of pre-fitting testing. Unfortunately, some of these, such as SIN and LDL testing, often are overlooked in the routine hearing aid fitting process—maybe because of perceived time constraints. What is often true, however, is that the use of these measures, including the pre-fitting self-assessment scales, to fine-tune the fitting and enhance counseling, will result in a more efficient and effective overall fitting process, and actually are “time-saving.” And, there clearly are data to show that enhanced benefit and satisfaction will result.
Volume 7.3: Signal Processing and Features
So far we have been discussing some recent research surrounding pre-fitting considerations (v7.1) and also specific pre-fitting testing (v7.2) that might be conducted before hearing aid selection. In this section, we’ll specifically examine some recent research regarding hearing aid technology, and maybe even have a flashback to a couple related articles from the past.
Readers Beware
Before reviewing a few recent articles on hearing aid technology, we thought we’d first discuss something one must remember when reading articles on this topic; we’ll sum it up by saying “proceed with caution.” As most of you know, we have what are called “peer-reviewed” audiology journals which publish this type of research—examples would be Journal of the American Academy of Audiology, Ear and Hearing, and International Journal of Audiology, just to name a few. Articles in these journals have been carefully reviewed by experts in the area, and nearly always revised, sometimes more than once, before their publication is approved. Many articles submitted to these journals simply are rejected.
A large percent of articles regarding hearing aid technology, however, are published in journals that are only loosely peer reviewed, or not seriously reviewed for content at all—taking a “let-the-reader-decide” attitude to the information provided. As a result of this approach, some articles published in these journals are excellent, and would easily meet peer-review standards. But on the other hand, there also are some that have serious flaws. And of course, today we also have what are called “white papers,” which often appear to be a journal article, but simply are published by a company or manufacturer without any reviewing outside of the organization. Our point here, is that when making important decisions regarding what technology is best for our patients, it’s important to make this decision based on evidence that is supported by rigorous peer-reviewed research.
Here are some (slightly edited) examples of recently published hearing aid technology articles from journals that are not peer-reviewed, illustrating why reading between the lines is important.
- #1. Article headline states that with the new premier product ABC, 85% of hearing aid users prefer this product to a comparative model. Now you might think that this was Manufacturer A’s premier product compared to that of Manufacturer B. Not so. Actually, this was Manufacturers A’s new premier product compared to their previous premier product. Current users of the old premier product were given a pair of the new products to use for a month, and then do the rating. This obvious design bias and very predictable outcome reminds us of research from Bentler et al, going back to 2003. These researchers had participants conduct real-world comparisons of hearing aids labeled “digital” to hearing aids that were labeled “conventional.” Nearly 100% preferred the hearing aids labeled “digital”—what the participants didn’t know was that in the two different trials they were comparing the very same conventional hearing aids! This clearly shows the effect of labeling; this study is from over 20 years ago, digital technology was still novel and considered a “big deal” by many people.
- #2. Article headline states laboratory speech-in-noise testing reveals that the new signal processing of their new premier hearing aid improves speech understanding (the measured SNR) for 95% of users, compared to the processing of their previous premier hearing aid. Sounds good, but of course we need to ask what did they use for individual “critical differences,” e.g., when is a difference really a difference? We know, for example, for a speech-in-noise test like the QuickSIN (using two lists) the value would need to be a change in the measured SNR of 2.7 dB (two lists administered). Turns out—in this study, they used any measurable difference, many only ~1 dB. As we’ve talked about in previous QuickTakes, for individuals with hearing loss, research has shown that the just-noticeable-difference (jnd) for a speech-in-noise SNR is around 3 dB (McShefferty et al, 2015).
- #3. Article headline states laboratory speech-in-noise testing reveals that the new signal processing of their new premier hearing aid improves speech understanding by 100% when compared to their previous premier hearing aid. 100%? Sounds good. When we dig into the article, however, we see that the group mean for the “old” technology was an SNR of ~1.0 dB, and with the new technology, the group mean improved to SNR ~0.0 dB. Yes, to help you with the math, going from 1 dB SNR to 0 dB SNR (a 1 dB improvement) is indeed 100% smaller (in this case better). Oh, but have you heard, jnd’s for SNR change are around 3 dB?
Just a few examples of what to watch out for. Never fear, the articles we are citing in this paper indeed have been peer-reviewed (and again by us).
Compression Time Constants—Do They Matter?
Prior to the late 1980s, there was not too much talk about compression attack and release times, as many hearing aids only had output compression, and those that did have AGCi, had relatively high kneepoints. And then, along came wide dynamic range compression (WDRC), with kneepoints of 40-50 dB SPL or even lower, and hearing aids were “in compression” most of the time, and in many cases, going “in and out” of compression—the compression release time now had a much more significant influence on signal processing and sound quality. From the onset, there were some manufacturers who believed in a short time constant for WDRC release, e.g., 100 msec or faster, and others who favored a longer release, e.g., 2 seconds or longer, and yet others who were somewhere in-between. Each manufacturer had a “story,” or perhaps even research findings, supporting their rationale. In some cases, the release time was programmable, meaning that the HCP needed to decide what release time was best for what patient. Harvey Dillon did a good job in summarizing what we did and did not know in his 1996 Ear and Hearing article, appropriately titled: Compression? Yes, but for low or high frequencies, for low or high intensities, and with what response times?
So here we are, nearly 30 years past Harvey’s article, and you rarely hear much about compression—at meetings, from articles, conversations with HCPs or even literature from manufacturers. When was the last time you heard one of your favorite hearing aid manufacturer reps talk about the philosophy behind their WDRC release times in one of their presentations? Our best guess is that many HCPs fitting hearing aids don’t know the typical kneepoints, ratios or release times of their favorite hearing aid models. Does this mean that after years of research, we have all the answers? We don’t think so, but we do have a review article by Windle et al that was just published in 2023, that summarizes some of their general thoughts.
The focus of the review was on patients with age-related hearing loss, as the authors state that they believe that it is important to recognize that these patients have a combination of peripheral and central, auditory and cognitive decline, and that they should not be treated as “standard.” They suggest that a primary concern for HCPs is to avoid hearing aid settings that introduce distortion to speech envelope cues, and that the primary cause of these distortions is the speed and range of change to hearing aid amplification—which takes us to our topic of “compression.”
Based on their review of ~200 articles on the topic, they proposed a pragmatic approach to hearing aid programming for older adults (over 55 years of age) that could be implemented within typical current fitting appointments. Here is a brief summary, with our editing, of some of their recommendations that relate directly to compression:
- Slow-acting compression should be considered as the default setting for older adults and should be employed in noisy environments for all hearing aid users.
- There is no good reason that hearing aids should default to fast-acting compression for older adults.
- If fast-acting compression is used, the compression ratio should be reduced to levels that avoid distortion, a value as low as 1.5.
- Because of differences in individual preferences, the HCP could provide both slow-acting and fast-acting compression in separate hearing aid programs, and the patient could be involved in choosing the best solution.
- Because compression speed and compression ratio are primary determinants of the degree of distortion, there is a need for hearing aid manufacturers to publish compression speeds as part of their standard product information and provide products that allow clinicians to change compression speed.
Notice that one of the recommendations is to provide older patients the option of listening to different compression speeds in the real world. This of course, only can be implemented if your favorite manufacturer makes this possible in the software. Signia employs adaptive compression, which tends to be slower acting. Adaptive compression is slower acting in situations with any background noise and automatically switches to fast-acting for quiet speech. It’s important to note that Signia does not state a specific release time, but rather uses the terms syllabic and adaptive. The term syllabic originally was coined to mean a release time no longer than a syllable, e.g., ~150 msec or faster. Adaptive, also called dual, is compression that bases the release time on the duration of the input signal. Hence, it is nearly always a slow release. It does, appropriately so, have a fast release when a loud abrupt input occurs, hence the term “adaptive.” A screenshot of how Signia displays compression speed in the Connexx software is shown in Figure 9; the default compression speed settings for a mild sloping to moderate-severe hearing loss. Note the adaptive compression box is checked. For most patients, this default setting should be just fine.
For the same hearing loss, Figure 10 shows how a second dedicated program can be added by the hearing care professional so that the “older” wearer can compare compression speeds – an approach recommended in the new Windle et al (2024) guidelines.
It should also be noted that this change in compression speeds (adding a second dedicated program with slower compression speeds like in Figure 10) must be done manually in the software by the HCP, and only occurs when either the NAL-NL2 or DSL5.0 fitting approaches are selected in the software. The HCP can access these targets by changing the Fitting Formula, located under the First Fit tab.
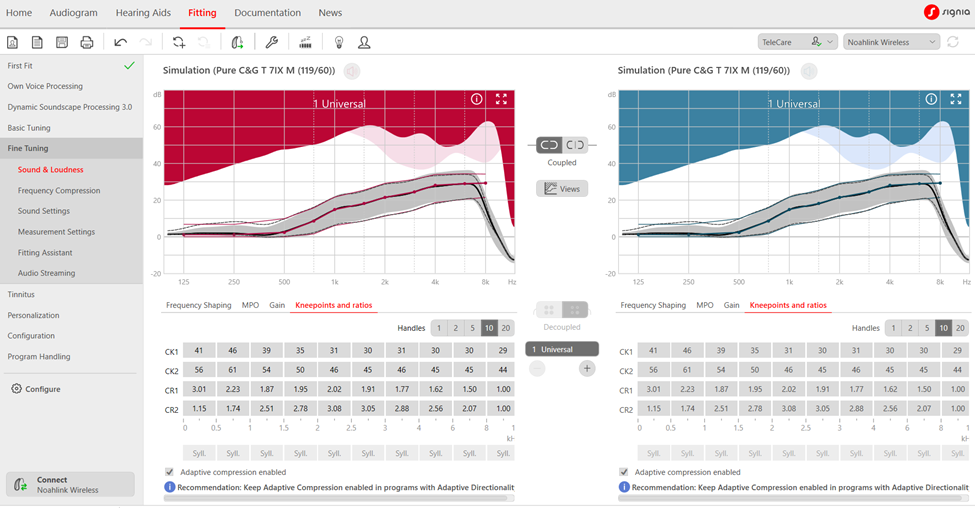
Figure 9. Default compression parameters for mild sloping to moderate-severe hearing loss. Not the adaptive compression enabled box is automatically checked.
Figure 10. Dual or slow-acting compression settings for a dedicated Program 2 per the Windle et al (2024) fitting guidelines. Note the adaptive compression box in no longer checked and speeds are “dual” rather than “syllabic.”
The option of having the patient conduct comparisons of slow vs. fast release times reminds us of a well-designed Robyn Cox study on this topic (Cox and Zu, 2010)—yes, it’s from a few years back, but still meaningful. As reviewed by Windle et al (2023) there is a general belief that when cognitive decline is present, it is even more important that slow-acting compression is employed as the default. Pitfalls of some of the studies that have led to this conclusion, however, are that that a) they did not use real hearing aids, b) the compression ratios were not what are commonly used, c) conclusions were based only on laboratory results, and d) some studies were sponsored by a hearing aid company, which could have influenced the design of the study. By contrast, the independent Cox and Zu (2010) research used real hearing aids programmed to the NAL, and the participants used these hearing aids in the real-world before making judgments of preference. The subjects received three different cognitive tests, and a composite cognition score was assigned, ranging from +6 (best) to -6 (highest level of cognitive decline). A summary of the patient preferences after the field test are shown in Figure 11.
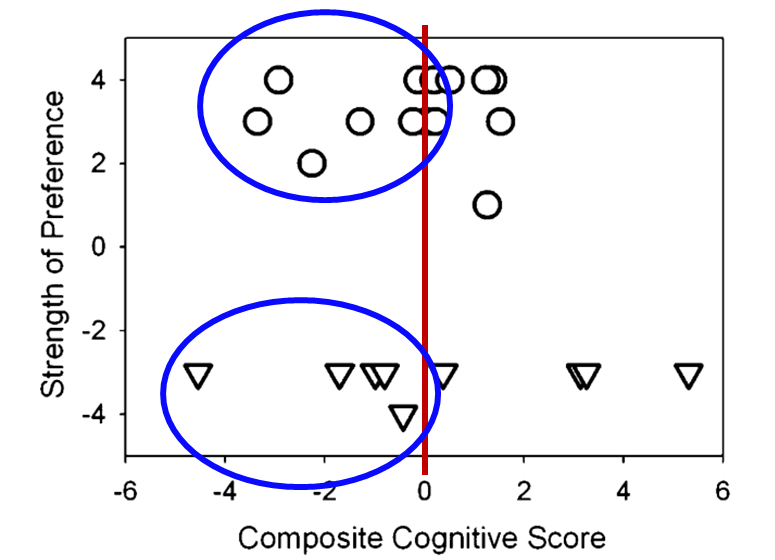
Figure 11. Data of patient preference based on listening experiences in a real- world field study. The x-axis represents composite cognitive score range from -6 (poorest) to +6 (best). The upper circles represent the participants who preferred a long release time, the lower triangles were those who preferred the short release time. The y-axis represents the strength of the preference, e.g., -4 and + 4 being the strongest preference (Adapted from Cox and Zu, 2010).
The upper circles represent the participants who preferred a long release time, and the lower triangles were those who preferred the short release time. Observe, as shown on the y-axis, that while there was fairly even distribution between the long and short release time preferences, nearly all participants had a strong preference, e.g., a 3 or 4 rating. What is the most relevant to our discussion here, is that if we look at the ratings for those 11 participants with cognitive scores below zero (see ratings circled in Figure 11), 5 of these individuals had a strong preference for a short release time. While this is only one study, and a limited sample, it certainly tells us that taking a “one-size-fits-all” approach when selecting compression release times could be risky. Perhaps the most practical advice we can offer clinicians regarding compression speed is this: For older adult hearing aid wearers, consider using slow-acting, adaptive compression by adding a second program with these longer release times. Allow the patient to compare the two programs to see which of the two might be judged to have better sound quality. Given that wearers with cognitive decline (a group that might be more susceptible to sound quality/distortion problems associated with compression speed) often cannot manually change programs, you could have them wear setting one (default to faster compression speeds) at home for 2-3 weeks and then have them wear setting two (default to slower compression speeds) for another 2-3 week stint and see if the wearer has a preference for one of the two settings. Figure 9 shows a fitting in which the second program is exactly like the first program with one exception: the compression speed has changed from fast-acting syllabic to slower-acting adaptive compression.
Music and Hearing Aids
For many of our patients, listening to music through their hearing aids is a big part of hearing aid use—whether it be live, from a loudspeaker, or streamed (we’ll provide some tips on verification of this later in this article). Back in QuickTakes Volume 4 (Taylor and Mueller, 2023), we talked about the accuracy of signal classification systems in detecting music (and switching to the music program). We reviewed the research of Yellamsetty et al (2021), which showed that some products do not detect music very efficiently (See Figure 12).
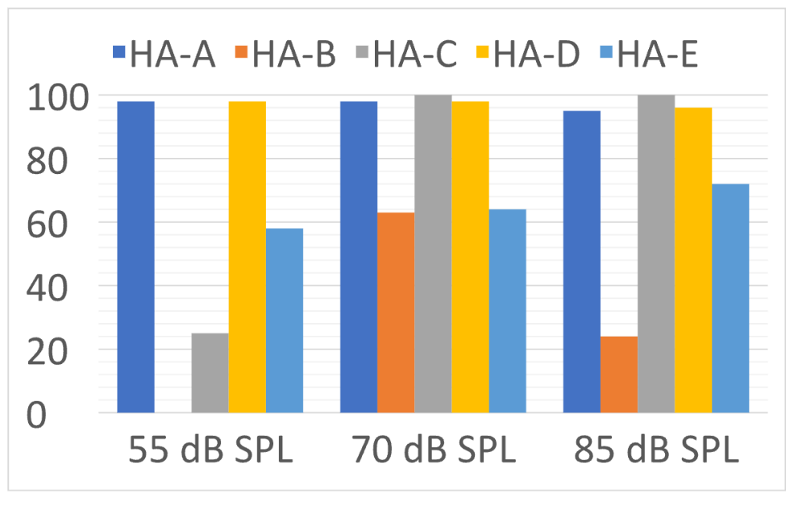
Figure 12. Percent of correct identification of music at three different input levels for the five different hearing aids (adapted from Yellamsetty et al (2021).
The bars in Figure 12 represent the accuracy rate of the premier hearing aid from five different leading manufacturers to identify music. Note that Hearing Aid A and D had excellent accuracy for all levels of music. On the other hand, Hearing Aid B identified soft music as speech-in-quiet 100% of the time. When the music was loud, Hearing Aid B typically identified it as speech-in-noise.
Our assumption here, is if the hearing aid correctly identified music as music, the hearing aid would go to the music program, and the patient would have a better listening experience. But is this true? That was the question asked by Sandgren and Alexander (2023) in their research. Seven brands of receiver-in-canal (RIC) hearing aids were programmed to the NAL-NL2 prescriptive targets for a typical downward sloping hearing loss (known as the N3 audiogram). All advanced features were at the default settings, except the automatic environmental classifier and frequency lowering, which were deactivated. Seventy individuals aged 18–24 years with pure-tone hearing sensitivity < 20 dB HL participated in the ratings. Participants rated the sound quality of 10 music samples on a seven-point scale: 1 (unacceptable), 2 (very poor), 3 (poor), 4 (fair), 5 (good), 6 (very good), 7 (excellent). The ratings for the seven hearing aids are shown in Figure 13. Also shown is the rating (5.5) for the control music sample (not hearing-aid processed).
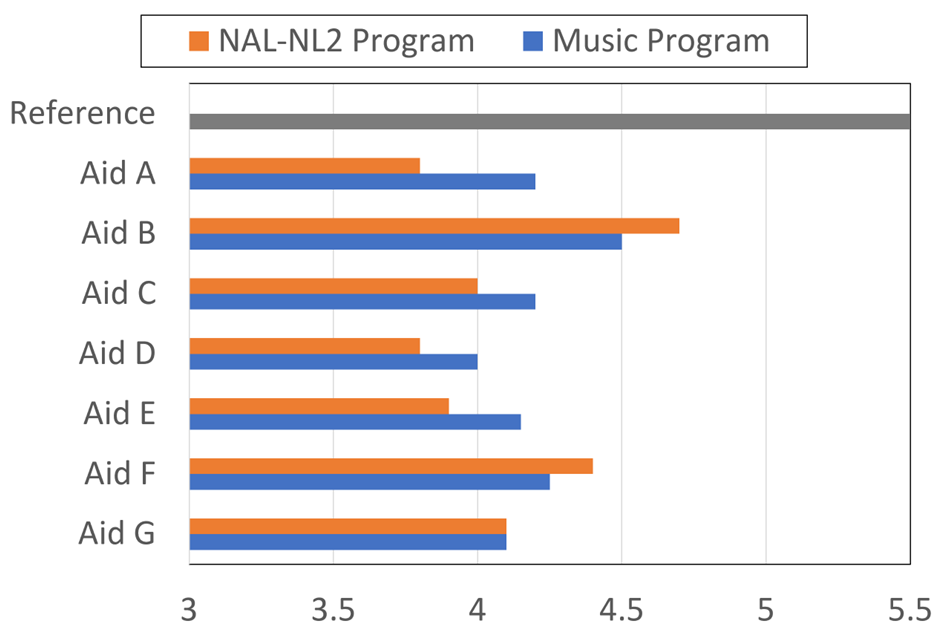
Figure 13. Rating of the music quality (7-point scale) for the NAL-NL2 program, and the default music program for each hearing aid. Also shown is the rating for the music when it was not processed by a hearing aid, labeled as “reference.” (adapted from Sandgren and Alexander, 2023)
There are several remarkable findings shown in the results of this research (Figure 13). While all products were programmed to the NAL-NL2, and verified via probe-mic measures, note that there are relatively large differences in the ratings among products. For example, product B had a NAL-programmed rating of 4.7, whereas products A, D, and E were only 3.8-3.9. As shown, in most cases the music program did not improve the quality of music significantly, and in some cases, not at all. The authors report that statistical analysis revealed that the music program was better for three instruments, the same as the NAL for two, and for two hearing aids, the NAL program was significantly better than the music program for listening to music.
So one study shows that some products aren’t very good at classifying music, and another study shows that for some products that doesn’t really matter, as the standard NAL program is better than the music program! What does this mean? Opportunity! It means that HCPs can demonstrate their ability to out-think what happens by default or automatically. Articles have been written regarding how to program hearing aids for music, and in general we know that for a dedicated music program we usually want to: increase bass, decrease treble, reduce WDRC (make the processing more linear), reduce noise reduction processing, and often, increase the MPO (most patients have a slightly higher LDL for music). Having a dedicated music program can then allow the patient to make real-world comparisons.
Summary
Each year there are several articles published on new hearing aid technology. It’s important, however, to separate the science from the advertorials. In this section, we reviewed the somewhat controversial topic of selecting the best compression release times, and also provided some interesting findings on hearing aids and music—certainly an area where the skills of the HCP can make a big difference.
7.4: Selection and Fitting
We’re continuing with our review of some recent journal articles that in particular have practical clinic applications. So much to read—so little time! In this section of Volume 7, we’ll be looking at some research related to hearing aid selection and fitting—considerations and procedures before we get to verification and validation.
Hearing Aids for People with “Normal Hearing?”
There recently was an Ear and Hearing publication regarding a group of normal hearing individuals who were fitted with hearing aids, given laboratory tests using the hearing aids, and then participated in a field trial (Mealings, 2023). Interesting findings, and we’ll get to that soon, but first, a little background.
Back at the beginning of this article, we had some discussion about what is “normal” hearing (audiometrically), and talked a little about some research regarding fitting hearing aids to those individuals. We reviewed a Chris Spankovich (2020) article on this topic, where he presented a very reasonable case for why 15 dB should be the cut-off. The 15 dB cutoff, however, varies considerably from the World Health Organization (WHO) classification of “normal hearing,” which is a PTA better than 20 dB HL for 500, 1000, 2000 and 4000 Hz in the best ear. Because it’s an average, if a person has very good thresholds at 500 and 1000 Hz, he or she could have a 30-40 dB hearing loss in the higher frequencies, and still be classified as having “normal hearing.” This takes us to some hearing aid fitting findings of Larry Humes (2020), which we also have discussed earlier (see section 7.1). Recall that the main finding of the Humes research was that, based on unaided and aided HHIE/A results, individuals with “normal hearing” (WHO definition) received as much benefit from hearing aids as those classified as having a mild or moderate hearing loss. Moreover, at the end of the clinical trial, nearly 80% of those in the “normal hearing” group purchased their hearing aids. You’ll find that this 80% purchase rate is much higher than similar studies, perhaps because of the WHO definition of “normal.”
A study from a few years ago by Roup et al (2018) also examined the notion of fitting hearing aids to individuals with normal hearing. All participants had hearing sensitivity <25 dB for 250-8000 Hz. They also had a control group of 20 young adults (19–27 years of age) without any self-reported hearing difficulties. The experimental group included 17 adults (18–58 years old; mean age = 30.8), with self-reported hearing difficulties (e.g., HHIA score >20 dB). As part of the pre-fitting testing, a battery of tests believed to be sensitive to auditory processing disorders were administered. The majority of the participants in the experimental group performed abnormally on at least one of these tests. Unfortunately, these tests were not given to the control group, and hence, the significance of this is difficult to interpret, as these tests have poor sensitivity and specificity.
One test which was given to both the control and experimental group (unaided and aided) was the R-SPIN (scored for the low-predictable sentences). The experimental group was fitted bilaterally with hearing aids providing ~10 dB insertion gain. The results for the “low-predictability” portion of the R-SPIN test are shown in Figure 14. Two observations are important. First, while both groups had similar (normal) hearing levels, there was a large difference in (unaided) performance; the control group had mean scores ~25-30% better for the four different SNRs. But interestingly, when the experimental group was tested aided, their speech-in-noise test results were the same as the control group. This would seem to suggest that the experimental group did not have a “processing” problem, but simply needed added audibility.
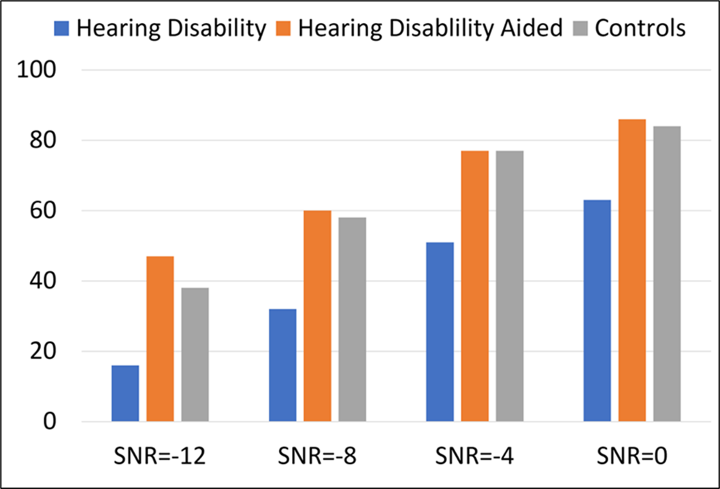
Figure 14. Percent correct scores for the R-SPIN low-predictability items for four different SNRs. The Hearing Difficulties group was tested both unaided and aided. Also shown are the results for the control group (data from Roup et al, 2018).
As would be expected from the data shown in Figure 14, a significant benefit was reported for hearing aid use based on the field trial—HHIA scores went from a mean of 38.4 (unaided) to 20.5 (aided). Despite this significant average reported real-world benefit, at the conclusion of the study, when given the opportunity to purchase the experimental hearing aids at a reduced cost, only 3 of the 17 participants complied.
All this takes us back to the recently published Mealings et al (2023) study. The participants were 27 adults (17 females, 19–68 years old, mean ± SD = 42.7 ± 11.9 years). All had average hearing loss <25 dB. The mean ± SD (minimum–maximum) of the four-frequency average hearing loss was 8.3 ± 4.8 dB (0–16.3 dB) for the left ear and 9.8 ± 5.0 dB (1.3–21.3 dB) for the right ear.
This was a double-blinded case-control study where participants completed retrospective questionnaires (e.g., SADL, SSQ), ecological momentary assessments (EMAs), speech-in-noise testing, and mental effort testing with and without hearing aids. A somewhat unique aspect of this study, compared to others of this type, is that the participants were randomly separated into two groups. The “experimental group” trialed mild-gain hearing aids with advanced directional processing. The “control group” also were fitted with hearing aids, but their aids were programmed to 0 dB insertion gain, with no directionality.
Their results showed the following:
• Regarding the retrospective questionnaires, experimental participants reported significantly lower levels of hearing-in-noise difficulties when they were fitted with mild-gain hearing aids compared to no device. The placebo control group showed no difference.
• Experimental participants reported significantly higher satisfaction with the devices than those in the placebo control group.
• For the real-world EMA, the experimental group reported a significantly better hearing experience when they were aided compared with unaided. The placebo group did not.
• Neither group showed an aided advantage for the laboratory testing (speech-in-noise and listening effort). It should be noted, however, that that the speech testing was conducted at a very high level (~75 dB SPL), negating what might have been a benefit from using the mild-gain hearing aids if soft-level speech had been used.
Despite the real-world benefit reported by the participants (91% reported improved speech understanding in background noise), when given the option of buying the hearing aids for a purchase price of ~$3500, none of them agreed to this option. This is similar to the findings of Roup et al (2018) which we discussed earlier, and of course is related to some of the thinking behind the introduction of less expensive OTC products.
Concerns with Instant-Fit Eartips and Domes
Over the past 10 years or so, it has become more and more popular to fit patients using instant-fit ear tips and domes—estimates are that today, only ~10% of patients being fitted with mini-BTE products (often referred to as RICs) receive a custom earmold. Indeed, the instant-fit products are more convenient, often more comfortable, and usually less expensive. But . . . it's important to understand the acoustics of these products, especially when a "closed” coupling is desired. Detailed study of this was provided in a recent article by Cubick et al (2022). We talked a little about this in Research QuickTakes Volume 4 (Taylor and Mueller, 2023), but it’s worth reviewing again.
There are standard data available regarding the acoustic effects of different custom earmolds, and the venting of these earmolds, going from completely closed to very open. A common source of these data is Dillon (1985), but similar results exist from other researchers.
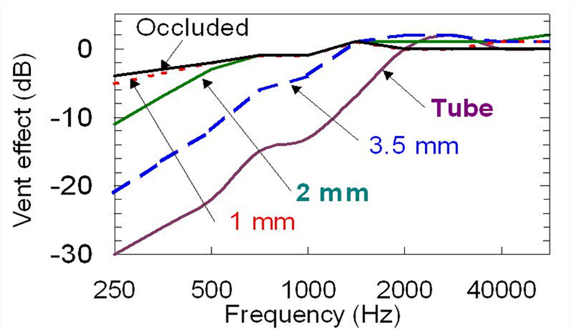
Figure 15. Venting effects adapted from Dillon (1985)
It’s important to know that the venting effects reported by Dillion (1985), data republished on page 137 of his 2012 textbook Hearing Aids, shows the expected venting effects from parallel vents of varying sizes. Given the uniform nature of parallel vents – the diameter of the vent doesn’t change as it runs, usually for several millimeters, through the earmold - the effects of changing the diameter of a parallel vent are predictable. On the other hand, because almost any instant-fit eartip has a slit-leak vent, which is a vent, as the name implies, that doesn’t run parallel through the eartip, the predicted venting effects shown in Figure 15 are not accurate. However, it is the predicted venting effects data displayed in this Figure that often are used by manufacturers as a starting point in the “first-fitting” of their instruments—in general, more gain is applied the more open the fitting to counteract what is leaking out of the earcanal. An example of this is shown in Figure 16 for a Signia product.
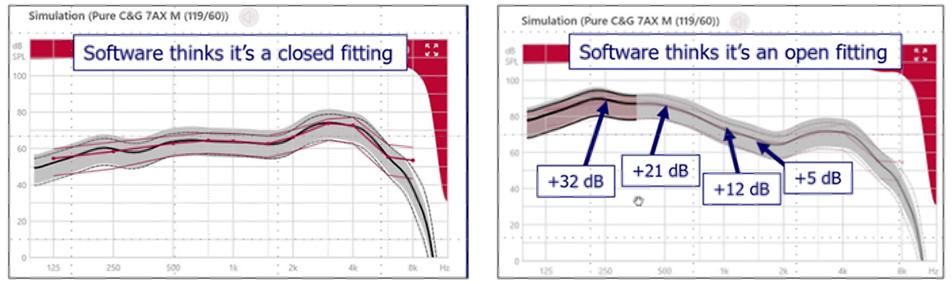
Figure 16. Signia hearing aid programmed for mild-moderate hearing loss. Left panel: Programmed gain (2-cc coupler) when “closed fitting” was selected in the software. Right panel: Programmed gain when “open fitting” was selected in the software.
This is the programmed first-fit gain to match prescriptive target for a typical downward sloping hearing loss, going from 30-35 dB in the low frequencies to 60-70 dB in the highs. The left panel is the 2-cc coupler output that was programmed when we indicated that it is a “closed fitting.” In contrast, the right panel is the resulting programmed output when we indicated that it is an “open fitting.” Notice the large differences in the low, and even the mid frequencies. But what if, we thought we were fitting a “closed” dome (and clicked that box), but it really was open? How would the software know?
Cubick et al (2022) show the vent effects for several different levels of “tightness” for instant-fit tips and domes, going from completely open to double-dome. Perhaps most important, is the large amount of leakage that is present for the fittings labeled as “closed” by the manufacturer. To illustrate, in Table 2 we have summarized the findings for the open and the double dome, and compared the instant-fit findings to the accepted vent effects used by most manufactures.
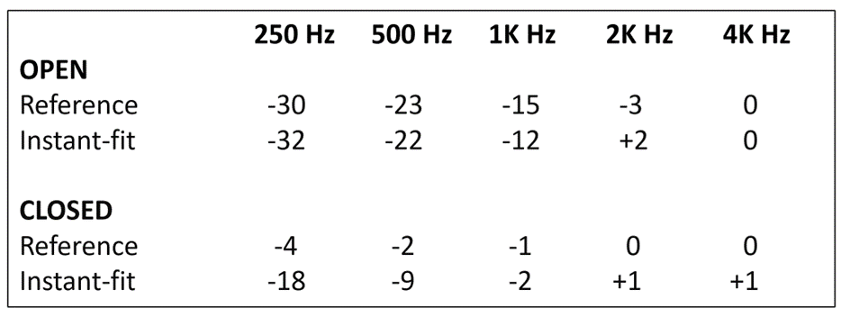
Table 2. Example of instant-fit vent effects compared to reference values for both an open and closed fitting.
Note that as expected, the instant-fit “open” venting is almost exactly the same as the common reference values—open is open! But note, that for the double-dome closed, there is considerably more venting in the lows than would be expected for a “closed” fitting. Not only could this result in a poor match to targets if probe-mic verification was not conducted, but also will reduce the effectiveness of DNR and directional processing (see Taylor and Mueller, 2023).
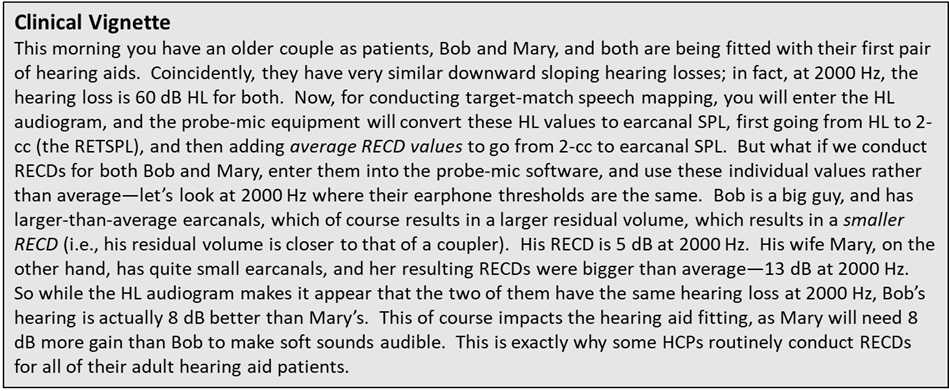
Help with the RECD
Those of you who do not regularly conduct probe-mic measures may not have thought much about the real-ear-to-coupler-difference (RECD) calculation recently. In fact, even those who do routinely use probe-mic measures, the RECD might not be a common procedure. To review, here is how it goes. We obtain the RECD by measuring the output across frequencies of a fixed signal in the ear canal using a closed coupling (usually an insert earphone) and then, the 2-cc coupler value for the same input is subtracted from the earcanal measure. For example, if the output at 2000 Hz was 62 dB in the coupler, and 70 dB in the real ear, that person’s RECD for 2000 Hz would be 8 dB. The size of the RECD mostly is determined by the residual volume of the earcanal when the insert earphone (or eartip, earmold or hearing aid) is in place. There are average values available for both children and adults, stored in the probe-microphone equipment. In many cases, however, it is useful to use actual measures from the patient, rather than to rely on average.
There are three primary uses of the RECD when fitting hearing aids:
- With adult hearing aid fittings, the measured RECDs can be used in place of average, when probe-mic verification is conducted. That is, when the HL thresholds are converted to earcanal SPL, what will be displayed will be a more accurate representation of the true thresholds. This is important for calculating prescriptive gain, and determining audibility of soft speech (see the related Clinical Vignette call-out).
- With infants and toddlers, when probe-mic verification is not possible, the RECD can be added to the 2-cc coupler findings, to predict output in the real ear. This often is referred to as simulated REM, or S-REM.
- When it is not possible or feasible to conduct the REAR85/90, the RECD can be added to OSPL90 measured in the 2-cc coupler to predict what the MPO would be in the real ear.
While the value of the RECD cannot be questioned in the fitting of hearing aids, it does not receive widespread use, especially for adult patients. This could be because HCPs simply believe that all adult RECDs are the same, the extra testing takes more time, or, some HCPs are not experienced in conducting this measure.
This leads us to a recent publication from Urichuk et al, 2023, who demonstrate that valid RECDs can be measured without using a probe-tube, but rather using in-ear equivalent source parameter calibrated transducers. The authors report that the calibrated transducer is placed distal from the eardrum in the ear canal, enabling sound-level measurement methodologies that separate the subcomponents of sound (forward-moving and reflected) to estimate sound levels at the eardrum itself rather than the direct measurement of SPL near the eardrum. The measurement that they used was the integrated pressure level (IPL), which is the sum of the in-phase magnitudes of the forward-moving and reflected sound waves, theoretically equivalent to the SPL at the termination of a cavity, in this case, the eardrum.
The participants in the study were 22 normal hearing adults with normal middle ear status. The traditional probe-mic RECD method was compared to the IPL approach. There were no clinically significant differences between probe-microphone and predicted earmold IPL RECD measurements between 500 and 2500 Hz. Test-retest reliability of IPL RECD measurement exceeded the reliability of earmold SPL RECD measurement across all assessed frequencies, with the greatest improvements in the high frequencies. This approach may not be ready for prime time, but stay tuned.
“Listening In"
We just talked about an RECD procedure that is still somewhat experimental, and now we’re going to switch to a hearing aid fitting tool that has been around for over 30 years. In her recent article, Susan Scollie (2023) talks about the value of the HCP listening to what is happening in the earcanal while conducting probe-mic verification—most all probe-systems allow for the attachment of earphones. In the world of patient-centered care, Scollie points out the value of saying to the patient: “Let’s listen to your hearing aids together, and you can tell me how they sound to you.” The notion is, that the simple act of co-listening helps put the patient in charge. This is considerably more valuable than using some form of “listening tube” or stethoscope. Important things to listen for include:
- Overall sound quality
- Low noise floor
- Distortions
- Intermittent feedback
- The occlusion effect
- The quality of telecoil-transduced speech.
As you might guess, co-listening can be particularly helpful when fitting frequency-lowering instruments. Scollie (2023) recommends a three-step approach:
- Initially, fit the hearing aids to prescriptive targets with frequency lowering disabled, this will minimize how much lowering is needed.
- If necessary, enable the frequency lowering and tune it for strength using a synthetic “s.”
- Play running speech and listen for clarity, paying special attention to settings that maintain vowel quality and that let you hear the difference between “s” and “sh”. Co-listen with your patient and assess their perceptions and preferences.
In general, the process of co-listening gives the HCP a good understanding of what modern hearing aids with clean signal processing should sound like—important in today’s world of direct-to-consumer products—helping the patient differentiate between good and bad can be very helpful. Both of us started using this “listen-in” approach more than 30 years ago when the manufacturers of probe-mic equipment threw a pair of circum-aural headphones in with their new equipment. For all the reasons we explained above, it is an indispensable part of the fitting approach we both used in the clinic.
Summary
We have reviewed some recent articles that relate to the overall fitting, some are things to consider before the fitting, others relate to the day of the fitting itself. Fitting hearing aids to individuals with normal hearing, but who report hearing problems, seems to have a positive effect, but maybe the “value” doesn’t equate to the common price of today’s hearing aids. We also reviewed some recent findings regarding instant-fit tips and domes, and a new RECD procedure. And of course, a little blurb from Susan Scollie regarding why we should “listen in.”
Volume 7.5: Verification of the Fitting
In this section of Volume 7, we continue with the general theme, where we take a close look at what has been published over the past few years and collect a grouping of articles that have direct Monday Morning clinical applications. In this final section, 7.5, we will focus on the verification of the fitting.
Accuracy of the Probe-Mic Measure
For the past four decades, when we talk about hearing aid verification, we nearly always are referring to probe-microphone measures, sometimes referred to as real-ear measures (REM; a somewhat confusing term, as there are real-ear verification procedures, such as aided soundfield testing, that do not utilize probe-microphones). Since the early days of probe-mic testing, there have been questions regarding the validity of these measures (see Mueller et al, 2017 for review). One issue that has been questioned relates to the possibility that the presence of the probe tube in the ear canal creates a “vent effect,” (sometimes called a “slit leak”), and because of leakage, low-frequency gain will be under-estimated. This of course, only pertains to tight fittings, as if the fitting is open, or even partially open, then a vent effect already exists. Some of you older readers might recall that back in the day of CIC popularity (mid 1990s), it was fairly common that we had the CIC product built with the probe tube embedded, as then we were assured that no venting caused by the probe-tube would occur (note: after the probe-mic verification was conducted, the tube was snipped off on both ends, and then served as a pressure vent).
General thinking, based on limited research, has been that today’s thin tubes do not have a significant venting effect. This recently was systematically studied, and the findings confirmed, for the most part, what we previously believed (van Noort et al, 2023). Above 500 Hz, the effect caused by the probe tube placement was negligible. For 500 Hz, the effect was -2 dB (+/- 1 SD ~6 dB). As expected, the probe-induced-vent-effect was greater for 250 Hz: -4 dB, with a +/- SD of ~7 dB. In most cases, these small effects would not have a significant impact on the fitting, and again, this is only an issue when the fitting initially is considered to be closed.
Don’t Forget about the REOR
As we’ve already mentioned, nearly always hearing aid verification involves probe-microphone measures. If we use insertion gain as the metric for verification, we would conduct a real-ear unaided response (REUR), then a real-ear aided response (REAR), and subtract the REUR from the REAR to calculate real-ear insertion gain (REIG). More commonly today, is to simply use the REAR to obtain a match to prescriptive targets for different input levels, sometimes referred to as speech mapping. One probe-mic procedure we have yet to mention, is the real-ear occluded response (REOR). While it is not a direct verification measure, it is useful in several instances, and should be a routine part of every probe-mic protocol.
To review, the REOR simply is a measure of the earcanal SPL for a given input with the earmold/hearing aid in place, but with the hearing aid muted/turned off. Over the years there has been some interest in comparing the REOR to the REUR, and the difference in then referred to as “insertion loss.” If a closed earmold, or closed custom instrument is used, the “loss” is a combination of the closed system altering the earcanal resonance, and also acting as an earplug for the higher frequencies. Where the REOR plays into verification the most, however, is when the ear mold is open, or partially open. In these cases, it is easy to mistake segments of the REOR for the REAR. We’ll explain.
Mueller et al (2017) cite two examples when HCPs often are fooled by the REOR disguising as the REAR:
- When there is very little hearing loss in the low frequencies, it is common that when the REAR is conducted, the output is 5-10 dB above targets in the 250-1000 Hz region. It is very possible, however, that what we are observing is the real-speech input signal (which peaks in the lows) going directly to the eardrum—the REOR. If the HCP, however, believes that the “too-much-gain” problem is from hearing aid amplification, then he or she will attempt to reduce this output by altering the programming, which of course will have no effect if indeed what we are seeing is a component of the REOR.
- Similarly, in an open fitting, the patient’s earcanal resonance and concha effects will still be present—it’s not uncommon that this is ~20 dB in the 2000-4000 Hz range, and will be observed in the REOR. It is possible, therefore, that if the patient has relatively low LDLs, when the REAR85 is conducted, the output will be above the LDLs in the 2000-4000 Hz range. If the HCP did not conduct an initial REOR before the REAR85 measure, he or she would likely believe that the excess output was the amplified signal, and turn down the MPO trying to solve this problem—which of course would have no effect.
This takes us to the recent article of Scollie (2023), where she gives another example when the REOR provides useful information relating to hearing aid verification. Earlier in this paper, we discussed the music program of hearing aids, and its appropriate implementation when the hearing aids are fitted. Consider, that many of our patients are using the music program for both music from a loudspeaker and streamed. When verification is conducted, it is, therefore, important the hearing aids are programmed correctly for both delivery methods. Yes, some manufacturers have “off-sets,” but we’ve already discussed a couple times in this article, that going with the manufacturer’s default setting might not be the best course of action.
Shown in Figure 17 (left panel; from Scollie, 2023) is the REAR for a music signal delivered via a loudspeaker for a patient using an open-fit RIC product. We know that for music, patients tend to prefer more bass than what we typically would prescribe for speech. Looking only at the REAR, we might conclude that the amount of low frequencies gain is appropriate. But observe, that until we reach 1500 HZ, the output that we are seeing at the eardrum is the REOR—not the amplification of the music by the hearing aid—low frequencies that will not be present to this degree when the music is streamed.
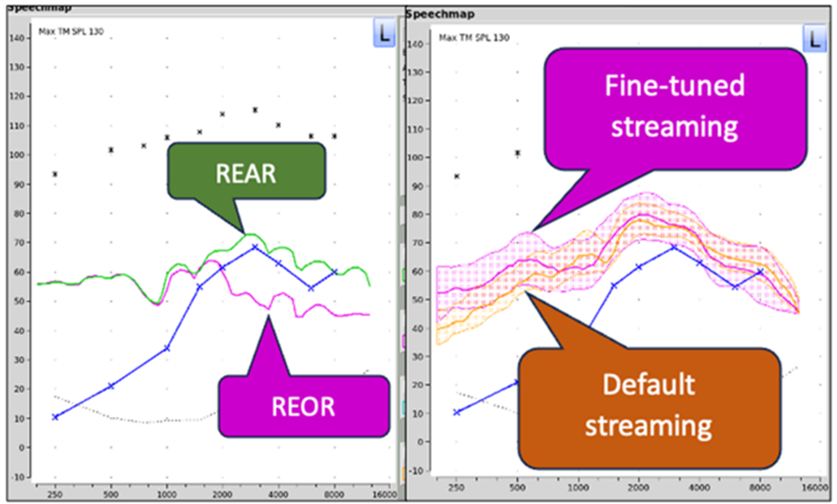
Figure 17. Example of probe-microphone measures of music. Left panel: The REAR/REOR comparison for music delivered via a loudspeaker. Right panel: The default vs. fine-tuned programming of streamed music (adapted from Scollie, 2023).
The importance of conducting real-ear verification for all types of music delivery methods is further pointed out in the right panel of Figure 17 (Scollie, 2023). Notice that the default programming for streamed music was significantly below desired levels for 1000 Hz and below. Clearly, as more and more patients are using their hearing aids for listening to streamed music, verification of this needs to be part of the routine fitting.
Role of the SII
In recent years, we are seeing the Speech Intelligibility Index (SII) discussed more and more when the topic of verification comes up. This is no doubt because most probe-microphone systems are now including the SII calculation as part of the verification procedure. That is, whenever an output curve is created, the calculated SII is shown (based on the patient’s audiogram, which has been converted to earcanal SPL). Hence, with most systems, the HCP can view the SII for unaided and aided results for any input level selected.
This “discovery” of the SII, a modification of the AI, has raised many questions among HCPs, so it’s probably good to provide a little history, which takes us back to 1947 (French and Steinberg), when the Articulation Index (AI) was proposed. In general, the AI is an expression of the proportion of the average speech signal that is audible to a given patient, and therefore it can vary from 0.0 (0%) to 1.0 (100%). The calculation procedure for the AI usually consists of dividing the speech signal into several frequency bands, each weighted based on their theoretical contribution to speech understanding (e.g., the 1500-3000 Hz region is given greater weight than the low frequencies).
Around 20 years ago, the time-honored AI calculation was modified slightly, and the name was changed to the Speech Intelligibility Index—a welcome change, as indeed we are predicting intelligibility not “articulation.” Audiologist Ben Hornsby (2004) contributed a useful article describing the similarities and differences of the historic AI vs the new SII calculation. Mueller and Killion (1990), who earlier had created an AI count-the-dots audiogram, modified this clinic tool and published the SII count-the dots audiogram (See Figure 18; Killion and Mueller, 2010).
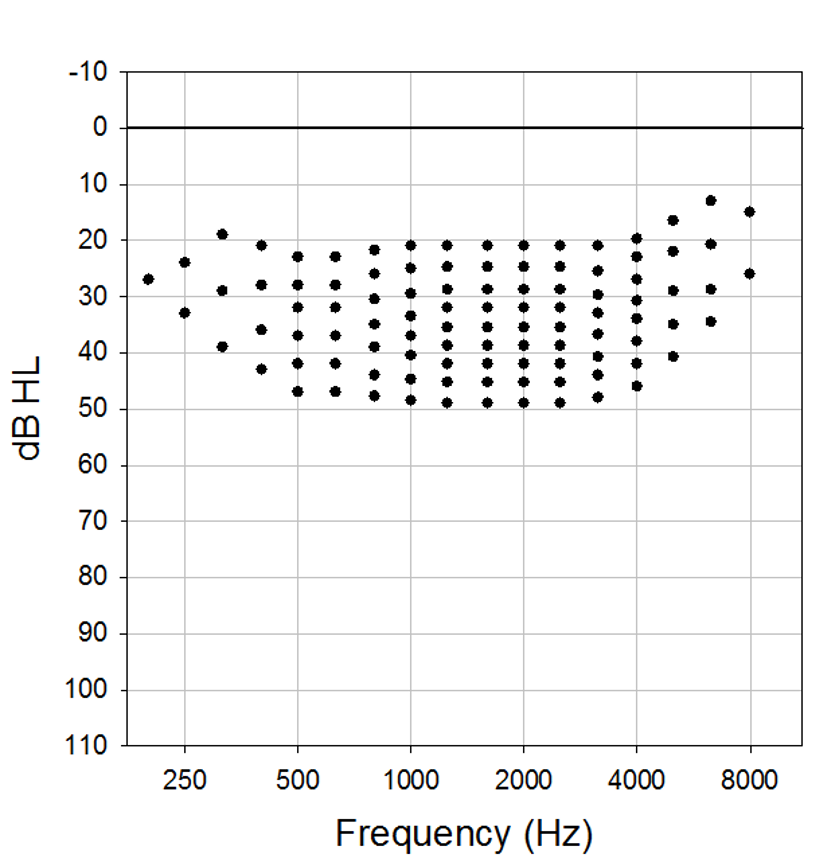
Figure 18. The 2010 SII modification of the 1990 AI-based Mueller-Killion Count-The-Dots audiogram.
As discussed earlier, observe that the density of the dots changes from frequency to frequency, based on the theoretical importance of a specific frequency for understanding speech. The count-the-dot audiogram worked nicely when REIG was the calculation used for verification, as aided thresholds (in HL) easily could be calculated from the REIG. This calculation approach is difficult to use when the REAR is the verification measure (as is common today), as the dots are in HL. This takes us back to the earlier comment, that fortunately today, most probe-mic equipment calculates the SII for us automatically (for review, see Mueller and Pumford, 2022).
On one of the popular audiology Facebook pages, an audiologist recently posed the following question: I just fit a hearing aid with a perfect match to target for average inputs, but the SII is only 75%. Why isn’t it 100%? What am I doing wrong? The over-20 responses to this question, were . . . shall we say . . . interesting. Fortunately, a research paper is available which provides some help.
Dau et al (2021), based on the fittings to 281 ears, characterized the range of fit-to-target and the range of aided SII associated with hearing aid fittings using the Desired Sensation Level version 5.0 prescription with adults. Using a four-frequency pure-tone average, ± 5 dB absolute deviation, or within 5 dB RMSE, clinical ranges for RMSE and aided SII were developed. The authors developed helpful charts with confidence intervals for deviation from target and the aided SII. One of these charts is shown in Figure 19.
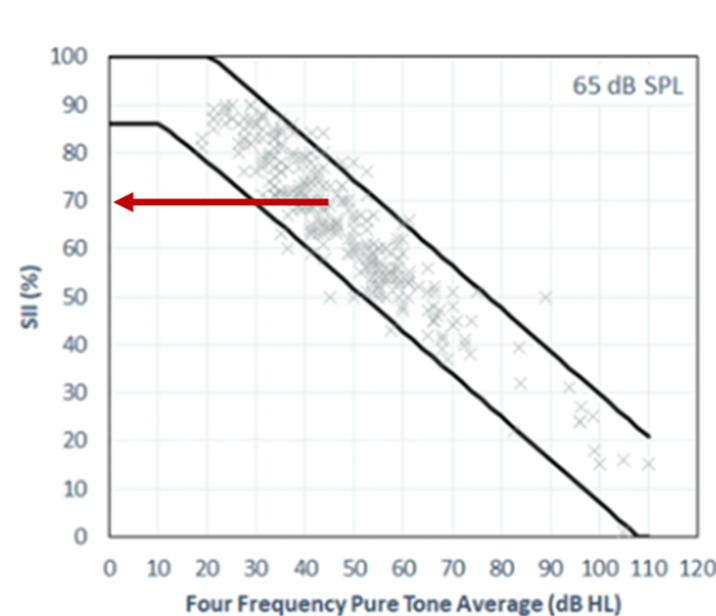
Figure 19. Shown across the x-axis is the four-frequency pure-tone average for the patient. The diagonal dark lines represent the confidence levels as a function of the degree of hearing loss, which then corresponds to the acceptable SII values shown on the y-axis. This chart is for a 65-dB-SPL input (adapted from Dau et al, 2021).
To use this chart, which only applies for a 65-dB input (charts are available for other input intensities), the HCP would first take the four-frequency pure-tone average for the patient. For our example, we used a PTA of 45 dB, which is fairly common for someone with a downward sloping loss being fitted with hearing aids. We then can go up vertically at the 45 dB point and see the range of acceptable SIIs (on the Y-axis) for someone with this degree of hearing loss. Note that the range roughly is 58-78%. The middle of the range, where we have placed the base of the red arrow (presumably a close fit to target) results in an SII of ~68-70%. As expected, the “acceptable” SIIs go up and down as the degree of hearing loss goes up and down. These charts are available for other input levels, and the boundaries shown here are part of the software for at least one probe-mic manufacturer.
While these charts provide useful information for the HCP for the verification process, a frequently asked question is: “I use the NAL-NL2—are there similar charts for this prescriptive method?” To our knowledge there are not, but we do have data to suggest that this should not be a big problem. A few years back, Johnson and Dillon (2011) conducted an SII comparison of the DSLv5.0 and the NAL-NL2 for 5 different audiograms—the audiograms differed significantly, ranging from flat to upward sloping to sharply downward sloping. The resulting SIIs for a perfect fit-to-target for the two prescriptive methods are shown in Table 3. Notice that for only one of the audiograms (A-2, which was upward sloping) was there an SII difference of more than .04, and the average difference across audiograms was .01. It would seem, therefore, that for adults, the DSL critical differences would be similar to those for the NAL-NL2, and when using these charts for NAL fittings, it would be unlikely that significant mistakes would be made.
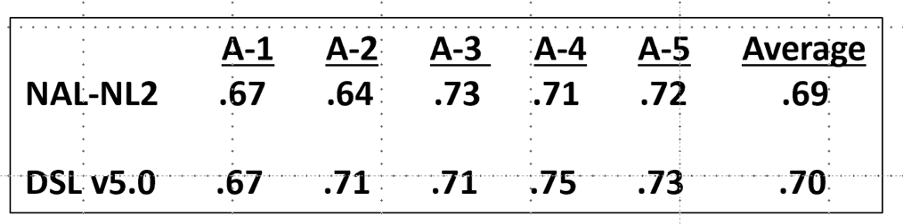
Table 3. Resulting SIIs when the DSLv5.0 and the NAL-NL2 are fitted perfectly to prescriptive targets (for an average-speech input) for five different audiograms (A-1 to A-5).
Coupler-Based Verification
As we’ve discussed, verification typically is conducted using probe-microphone measures, more specifically, the REAR. There are times, however, when this is not possible or practical. This is commonly true with infants and toddlers, but there also are cases with adults when an alternative verification measure is needed. There are, therefore, procedures for predicting the REAR from coupler-based verification measures, commonly referred to as the Simulated-REM or S-REM. One shortcoming of this approach is that if the fitting is vented or open, it is difficult to predict the real-ear values from the coupler measures. A recent article has provided assistance in this area (Scollie et al, 2023).
Retrospective file review was used to obtain previously measured REARs from 104 fittings in 52 adults and three hearing aid styles. The authors then re-measured each fitting at three different test levels using S-REM, with and without the newly-developed venting correction factors. They report that the new vent-effect algorithms reduced low-frequency error by up to 11 dB, and as expected, fittings with more open dome or tip styles had a larger improvement when the vent model was added. These vent correction factors have been included in at least one probe-mic system.
Summary
Hearing aid verification using probe-mic measures has been the norm for four decades. But, as we’ve reviewed here, there continues to be new information on this topic. We’ve talked a little about support for the REOR as a routine procedure, some confirmation of the validity of all our ear canal measures, and how newly developed corrections can be applied. Also, it appears that the SII continues to be a welcome companion to the real-ear values, and we now have some guidelines to help us confirm when these values are acceptable.
In Closing
So that’s our brief review of some the hearing aid articles published in the last year or two, that we believe have some important clinical relevance—and yes, maybe even on Monday Morning. We’ll be reviewing another 300 or so new articles published in 2024, and who knows, we may be back with a similar review before too long. So much to read, so little time!
References
Bentler R, Niebuhr D, Johnson T, Flamme G. (2003) Impact of Digital Labeling on Outcome Measures. Ear and Hearing. 24(3):215-24
Cancel, V. E., McHaney, J. R., Milne, V., et al. (2023). A data-driven approach to identify a rapid screener for auditory processing disorder testing referrals in adults. Scientific Reports, 13, 13636. https://doi.org/10.1038/s41598-023-40645-0
Carhart, R., & Tillman, T. W. (1970). Interaction of competing speech signals with hearing loss. Archives of Otolaryngology, 91, 273–279.
Cox R, Xu J. (2010) Short and long compression release times: speech understanding, real-world preferences, and association with cognitive ability. J Am Acad Audiol. 21(2):121-38
Cubick J, Caporali S, Lelic D, Catic J, Damsgaard AV, Rose S, Schmidt E. (2022) The Acoustics of Instant Ear Tips and Their Implications for Hearing-Aid Fitting. Ear and Hearing 43(6): 1771-1782
Dao A, Folkeard P, Baker S, Pumford J, Scollie S. (2021) Fit-to-Targets and Aided Speech Intelligibility Index Values for Hearing Aids Fitted to the DSL v5-Adult Prescription. J Am Acad Audiol. 32 (2): 90-98.
Davidson, A., Marrone, N., Wong, B., & Musiek, F. (2021). Predicting Hearing Aid Satisfaction in Adults: A Systematic Review of Speech-in-noise Tests and Other Behavioral Measures. Ear and Hearing, 42(6), 1485-1498.
Dillon, H. (1985). Earmolds and high-frequency response modifications. Hearing Instruments, 36(12), 8-12.
Dillon H. (1996) Compression? Yes, but for low or high frequencies, for low or high intensities, and with what response times? Ear Hear. 17(4):287-307. doi: 10.1097/00003446-199608000-00001.
Edwards B. (2023) Providing Hearing Solutions to People with Hearing Difficulties but Minimal Hearing Loss. Hearing Review. 30(2):22-23
Ellis BK, Singh G, & Launer, S. (2022) Hearing Aid Adoption is Associated with the Type of Significant Other in Attendance at Hearing Care Appointments. Trends in Hearing.
Fitzgerald, M. B., Gianakas, S. P., Qian, Z. J., Losorelli, S., & Swanson, A. C. (2023). Preliminary Guidelines for Replacing Word-Recognition in Quiet With Speech in Noise Assessment in the Routine Audiologic Test Battery. Ear and Hearing, 20, 00-00.
French, N. R., & Steinberg, J. C. (1947). Factors governing the intelligibility of speech sounds. Journal of the Acoustical Society of America, 19, 90–119. https://doi.org/10.1121/1.1916407
Glyde H, Dillon H, Young T, Seeto M, Roup C. (2021) Determining unilateral or bilateral hearing aid preference in adults: a prospective study. International Journal Audiology, 60 (5):341-349
Hausladen J, Plyler P, Clausen B, Fincher A, Norris S, Russell T. (2022) Effect of Hearing Aid Technology Level on New Hearing Aid Users. J Am Acad Audiol. 33 (3): 149-157.
Hornsby B. (2004) The Speech Intelligibility Index: What is it and what's it good for? The Hearing Journal 57(10):10-17
Humes LE. (2020) What is “normal hearing” for older adults and can “normal-hearing older adults” benefit from hearing care intervention? Hearing Review. 27(7).12-18.
Johnson, E., & Dillon, H. (2011). A comparison of gain for adults from generic hearing aid prescriptive methods: Impacts on predicted loudness, frequency bandwidth, and speech intelligibility. Journal of the American Academy of Audiology, 22, 441-459.
Jorgensen L, Barrett R. (2022) Relating Factors and Trends in Hearing Device Adoption Rates to Opportunities for Hearing Health Care Providers. Semin Hear 43:289–300.
Killion MC, Mueller HG (2010). Twenty years later: A new count the dots method. Hearing Journal. 63(1): 10-17.
McArdle, R. A., & Wilson, R. H. (2006). Homogeneity of the 18 QuickSIN™ lists. Journal of the American Academy of Audiology, 17(3), 157-167.
McShefferty D, Whitmer W, Akeroyd M. (2015) The Just-Noticeable Difference in Speech-to-Noise Ratio. Trends Hearing. doi: 10.1177/2331216515572316
Mealings K, Valderrama J, Mejia J, Yeend I, Beach E, Edwards B.rent (2023) Hearing Aids Reduce Self-Perceived Difficulties in Noise for Listeners With Normal Audiograms. Ear and Hearing 45(1):151-163.
Mueller HG, Killion M. (1990) An easy method for calculating the articulation index. Hearing Journal. 43 (9): 14-17.
Mueller, H. G., Ricketts, T., & Bentler, R. (2014). Modern Hearing Aids: Pre-fitting testing and selection considerations. San Diego: Plural Publishing.
Mueller HG, Ricketts T, Bentler RA (2017). Speech mapping and probe microphone measures. San Diego: Plural Publishing.
Mueller H G, Stangl E, Wu Y-H. (2021) Comparing MPOs from six different hearing aid manufacturers: Headroom considerations. Hearing Review. 28(4):10-16.
Mueller, H. G., Coverstone, J., Galster, J., Jorgensen, L., & Picou, E. (2021). 20Q: The new hearing aid fitting standard - A roundtable discussion. AudiologyOnline, Article 27938. Available at www.audiologyonline.com.
Mueller HG, Pumford J. (2022) Using Probe-Microphone Measurements for Hearing Aid Verification. AudiologyOnline. Available at www.audiologyonline.com
Mueller HG, Ricketts T, Hornsby B (2023). Speech in noise testing—Too useful to ignore. AudiologyOnline. Available at www.Audologyonline.com.
Nabelek A, Freyaldenhoven M, Tampas J, Burchfiel S, Muenchen R. (2006) Acceptable noise level as a predictor of hearing aid use. J Am Acad Audiol. 17 (9):626-639.
Picou, EM (2022) Hearing Aid Benefit and Satisfaction Results from the MarkeTrak 2022 Survey: Importance of Features and Hearing Care Professionals. Semin Hear 43:301–316
Plyler P, Hausladen J, Capps M, Cox A. (2021) Effect of Hearing Aid Technology Level and Individual Characteristics on Listener Outcome Measures. JSLHR, 64 (8): 3317-3329.
Qian, Z. J., Vaisbuch, Y., Gianakas, S. P., & Tran, E. D. (2023). Evaluation of Asymmetries in Speech-in-Noise Abilities in Audiologic Screening for Vestibular Schwannoma. Ear & Hearing, 20, 00-00.
Roup C, Post E, Lewis J. (2018). Mild-Gain Hearing Aids as a Treatment for Adults with Self-Reported Hearing Difficulties. Journal American Academy Audiology. 29 (6): 477-494.
Saleh H, Folkeard P, Van Eeckhoutte, M, Scollie S. (2022) Premium versus entry-level hearing aids: using group concept mapping to investigate the drivers of preference. International Journal Audiology, 61 (12): 1003-1017.
Saleh H, Folkeard P, Liao S, Scollie S. (2023) Development and initial evaluation of the Hearing Aid Attribute and Feature Importance Evaluation (HAFIE) questionnaire. International Journal Audiology. https://doi.org/10.1080/14992027.2023.2253498
Sangren, E., & Alexander, J. (2023). Music quality in hearing aids. Audiology Today, 35(4).
Scollie, S. (2023). Next-level hearing aid verification AudiologyOnline, Article 28775. Available at www.audiologyonline.com
Scollie S, Folkeard P, Pumford J, Abbasalipour P, Pietrobon J. (2023) Venting Corrections Improve the Accuracy of Coupler-Based Simulated Real-Ear Verification for Use with Adult Hearing Aid Fittings. J Am Acad Audiol 33(05): 277-284
Taylor B, Mueller HG. (2023) Research QuickTakes Volume 4: Potential Hearing Aid Fitting Misconceptions. AudiologyOnline. Article 28685. Retrieved from www.AuidiologyOnline.com
Taylor B, Mueller HG. (2023) Research QuickTakes Volume 6.1: Hearing aid fitting toolbox. AudiologyOnline.
Spankovich C (2020) Some Observations on ‘Normal’ Hearing and Hearing Loss, Audiology Today 32 (5).
Urichuk M, Purcell D, Allen P, Scollie S. (2023) Validation of an integrated pressure level measured earmold wideband real-ear-to-coupler difference measurement. International Journal Audiology. https://doi.org/10.1080/14992027.2023.2254934
Van Noort F, Antoniuk O, Kilic Y. (2023). If the “observer effect” present in real ear measurement practice. Hearing Review 30(5):14-21.
Wilson, R. (2011). Clinical experience with the words-in-noise test on 3430 veterans: Comparisons with pure-tone thresholds and word recognition in quiet. Journal of the American Academy of Audiology, 27(7), 405-423.
Windle R, Dillon H, Heinrich A. (2023) A review of auditory processing and cognitive change during normal ageing, and the implications for setting hearing aids for older adults. Frontiers in Neurology. 14: https://doi.org/10.3389/fneur.2023.1122420
Yellamsetty, A., Ozmeral, E., Budinsky, R., & Eddins, D. (2021). A Comparison of Environment Classification Among Premium Hearing Instruments. Trends in Hearing. https://doi.org/10.1177/2331216520980968
Citation
Taylor, B. & Mueller, H. G. (2024). Research QuickTakes Volume 7: Useful clinical nuggets mined from recent hearing aid research. AudiologyOnline, Article 28939. Retrieved from https://www.audiologyonline.com