
Editor’s Note: This text course is an edited transcript of a live seminar. Download supplemental course materials.
Introduction
I appreciate the opportunity to present. The topic that we will be covering today is myths about the hearing aid market.
Imagine a hodge-podge of puzzle pieces that seem unlikely of being melded together into a sustainable form of art. However, if one were to spend sufficient time digging through the puzzle pieces, various patterns begin to emerge. Over time, these patterns form connections yielding a clearer outcome of something more meaningful. The analogy used to describe the hodge-podge of puzzle pieces is also applicable to the hearing aid industry.
The hearing aid industry is viewed by both those within and outside as a fragments market, having no single manufacturer as the leader and no clear gatekeeper to hearing healthcare. Dispensers have and continue to make business decisions based on data presented by manufacturers and industry personnel. Unfortunately, the degree of evidence behind this data is not always known or understood. This can result in dispensers making errors that influence their bottom line. In this talk, you will be presented with nine prevailing myths and supporting evidence that provide a clearer understanding of the hearing aid market, as well as strategies that can increase your bottom line through improvements in marketing, pricing and counseling.
Myth 1: The Hearing Aid Market is Underserved
The first prevailing myth that we will discuss is whether or not the hearing aid market is underserved. That is, “Are the number of impaired listeners who need a hearing aid receiving one, and how many who need a device do not have one?” This myth is assessed by reviewing evidence from industry reports as well as economic reports. MarkeTrak VIII (Kochkin, 2009) data made estimates of the number of Americans who have and are expected to have a hearing loss between the years 1989 and 2050. Over this 60-year span, the number of people with hearing loss is estimated to increase by 28.2 million, which equates to an average increase of about 460,000 Americans entering the market every year. Between the years of 2010 and 2015, the estimated number of people with a hearing loss is expected to increase by 2.4 million. In 2012, the number of impaired listeners is estimated at 34.36 million. The same MarkeTrak VIII survey data also included the adoption rate for hearing aids between 1984 and 2008. The most compelling aspect of this data is the small and stagnant percentage values which range between 20.4% and 24.6%. These values include hearing aids dispensed by the Veteran’s Administration and devices purchases through direct mail. As a result, today’s estimated hearing aid adoption rate of 24.6% actually overestimates the true adoption rate seen in the private sector.
Figure 1 graphically illustrates the conventional adoption rate for the year 2012. The conventional adoption rate is derived by multiplying the estimated number of all United States (U.S.) hearing-impaired listeners times the present-day adoption rate. The hearing aid adoption rate, which is estimated at 24.6% or 8.45 million Americans, is depicted in the green area, while the blue area represents the estimated 25.91 million Americans who do not own a hearing aid (Figure 1). Professional organizations, funding agencies, and hearing aid manufacturers, just to name a few, often portray that because these 25.91 million Americans do not own a hearing aid, that the market is underserved. Use of the data in this manner is incorrect, as it is implausible to assume that all 25.91 million Americans who do not own a hearing aid want or need amplification technology.
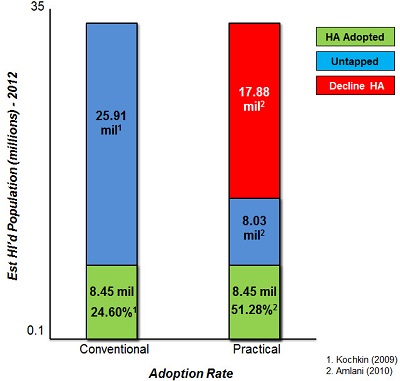
Figure 1. Comparison of conventional and practical adoption rates, based on current evidence (Kochkin, 2009; Amlani, 2010).
We recently developed an economic model, which lead to the creation of a practical adoption rate. This practical rate provides a more reasonable estimate of the true, untapped market for those Americans who want or need a hearing aid. Both the conventional and practical estimates agree that the market has an estimated 8.45 million hearing aid users. These values are depicted in green (Figure 1). The practical rate, however, estimates that the untapped market represented in the blue area on the right is only underserved by 8.03 million, not 25.91 million. In other words, the practical rate estimates that adoption for amplification devices is actually 51.28%. The difference between the conventional and practical models is 17.88 million Americans, which is highlighted on the right in red; the practical rate concedes as listeners not wanting or needing a hearing aid. Why are these differences in estimates important? Consider for example, that United Healthcare entered the hearing aid market recently because it was portrayed as underserved by nearly 18 million Americans. Had the hearing aid industry reported the practical adoption rate, there is a strong likelihood that United Healthcare and others would have been less likely to enter this market.
In summary, the hearing aid market is often portrayed as being underserved based on the estimates provided in various marketing surveys. The reason that the market seems underserved stems from the fact that estimates include all listeners having some form of hearing loss such as single-sided deafness, losses with a conductive component, and losses better served by cochlear implants. Because of the portrayal, outsiders continually attempt to establish their presence in the market in the form of Internet sales and third-party distributers. The practical rate provides a more realistic estimate of the hearing aid adoption rate. At present, it is assumed that the market has slightly more than a 51% adoption rate, with the potential to increase the number of hearing aid users by up to 27% in the future.
Myth 2: Price is the Primary Barrier to Adoption Rates
Related to the hearing aid adoption rate myth is the question of which barrier precludes impaired listeners from procuring this technology. The most often-given response is price. In this section, the influence of price as the primary barrier to hearing aid adoption is evaluated.
One aspect of assessing the myth of price as a barrier to the adoption rate is to consider the characteristics of the average user. MarkeTrak VIII data (Kochkin, 2009) indicates that the average age of a first-time hearing aid user is typically between 66 and 70 years. This means that most first-time hearing aid users are either retired or nearing retirement. Given the age and lifestyle of average first-time user , it is only fitting to assess the median household income of this population. Figure 2 shows the median U.S. household income across various age groups for the years 2001 in red, 2006 in yellow, and 2010 in blue (U.S. Census, 2010). Note that in 2010, median household income is slightly above $65,000 for people age 45 to 54 years, up slightly more than $7,000 compared to 2001 and up slightly more than $500 compared to 2006. It should be noted that while median income has increased over time, this increase is comparable to the rate of inflation. Note, however, that for people over the age of 65, relative to the 45 to 54 age group, income is reduced by nearly 51% to roughly $31,900 annually in 2010.
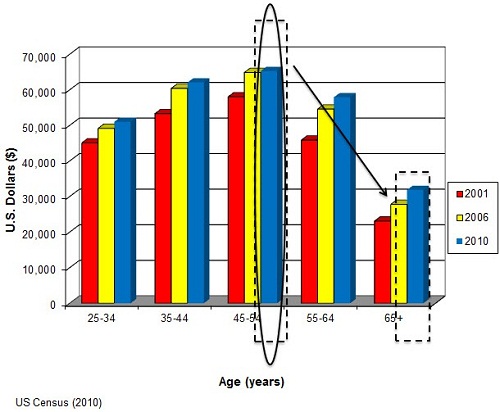
Figure 2. Median income for Americans for the years 2001, 2006 and 2010. (U.S. Census, 2010).
With respect to median income, the fact that most patients seen by audiologists and dispensers experience a decrease in household income, combined with the fact that older adults are living longer and on a fixed income suggests that customers of amplification devices will be less sensitive to changes in price. In addition to the age and income characteristics of the average first-time hearing aid user, another characteristic that must be considered is the percentage of sales provided to this population.
Note that since the early 1990’s the number of hearing aids dispensed to first-time users ranges between 30% and 40% (Kochkin, 2009; Figure 3). This means that the majority of hearing aid sales between 60% and 70% is provided to listeners who have previous experience with amplification. In addition to hearing aids being sold primarily to experienced listeners, data from MarkeTrak VIII (Kochkin, 2009) shows that nearly 80% of all hearing aids dispensed are binaural.
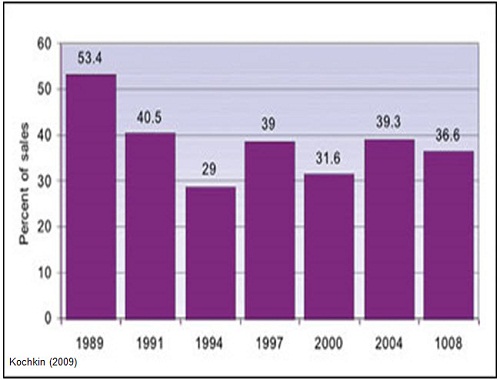
Figure 3. Rate of first-time hearing aid users (Kochkin, 2009).
So is price the primary deterrent to hearing aid adoption? Several surveys have assessed what role price plays in the adoption of hearing aids by querying respondents. Data taken from MarkeTrak VI (Kochkin, 2002) found that while 85% of respondents desired lower retail prices, price was ranked fourth in importance behind the ability to hear speech against competing noise, improved sound quality and fidelity, and feedback reduction. In MarkeTrak VII (Kochkin, 2007), the data indicated that the retail price of hearing aids affected 30 out of 100 respondents. Of these 30 respondents, only 22%, or about 7 out of a possible 100 respondents, indicated that they could not afford to purchase a hearing aid. We might also consider consumer satisfaction with hearing aids. One aspect of consumer satisfaction is value, which is defined as the perceived performance for the price paid. For the variable of value, note that 16% of respondents in MarkeTrak VIII (Kochkin, 2010) renounced the price paid for the performance provided by the device, while 84% of respondents were mostly content with the price they paid and the technology they received. Had price been an issue, specifically buyer’s remorse, the percentage of non-satisfied respondents would have been much higher than 16%.
The U.S. economy has been in a state of recession since December 2007, according to the National Bureau of Economic Research. Despite the slowdown in economic activity, the number of hearing aid unites sold has continued to increase at an average rate of nearly 4% over the past four years. If price were an issue, given the instability in the economy, the number of units sold would have decreased markedly. This stable growth during a period of recession is also a sign that the hearing aid market is inelastic, which is defined as consumers being insensitive to price for a given product or service. We will discuss this topic in another section of this presentation. Is price the primary factor considered by a potential user when deciding whether to adopt a hearing aid? The answer is no. Price is important to the end user, but not as important as the improvement in listening ability. For a minority of listeners, an estimated 30% of the U.S. hearing-impaired population, the retail price of hearing aids is a true barrier to the adoption process. Greater research efforts are needed to characterize who these listeners are and how to best provide them the necessary technology and services related to adopting personal amplification devices.
Myth 3: Hearing Aids are More Expensive Today than in Previous Years
The third myth pertains to the high retail cost of hearing aids. Audiologists and dispensers are often asked by patients why hearing aids are so expensive and whether the technology has priced itself out of the market. If hearing aids are overpriced, then that may explain the reason, at least in part, for the low conventional adoption rate. In this section, we assess this myth by comparing today’s hearing aid retail costs to previous years’ retail costs.
The work of Lundeen (2004) compares modern hearing aid price to historical values. All hearing aids were adjusted to represent constant dollars in the year 2000. The mean constant dollar price for technologies engineered with carbon, vacuum tube, and transistor technology is $882. While hearing aid prices in 1999, 2000, 2008, and 2010 were higher than the historical mean, each year still fell within one standard deviation of the historical mean. This data suggests that, while the price of hearing aids has increased over the past 50 years, the rate of increase is not significantly different compared to historical hearing aids.
Figure 4 shows the price of hearing aids over time, and is adopted from the work of Doyle (1980). In 1960, an analog behind-the-ear (BTE) hearing aid with single-frequency response, omnidirectional microphone and possibly a trim pot or two, retailed for $350. That same hearing aid, when adjusted for inflation, would cost more than $2,500 in 2010, as indicated by this solid green bar. In 2010, a more technologically-advanced hearing aid, denoted by the black bar, retails for just over $1,900, or a savings of nearly $600 to the consumer. This finding suggests that contemporary hearing aids, which are markedly more technologically advanced than the 1960’s devices, costs less than a traditional device when adjusted for inflation. The notion that hearing aids are more expensive today than in previous years is a myth. Today’s hearing aids are technologically more advanced and cost statistically the same as in previous years, despite the rate of inflation.
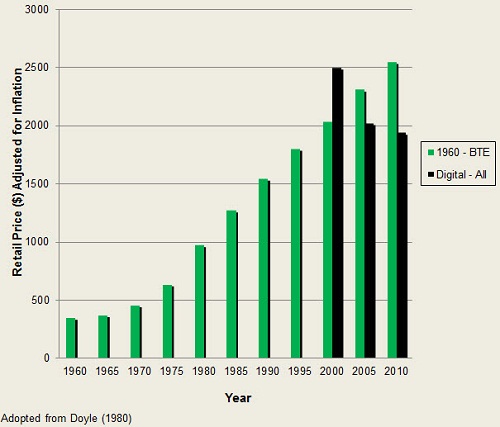
Figure 4. Hearing aid prices over time (Doyle, 1980).
Myth 4: Technology Will Increase Adoption Rates
A common theme that surfaces is that hearing aid adoption rates will improve as advances in technology continue to abound. In this section, we assess the relationship between technology and adoption rates. Data from Kochkin (2009) reveals the stagnant growth in adoption rates between 1984 and 2008. Over this period, hearing aid technology advanced from analog to digital, from linear to wide-dynamic-range compression, from single channel to multichannel, from omnidirectional to directional technology, adaptive and null-steering options, and the list goes on. Despite these advances in technology, marked increases in adoption rate are not evident.
One reason that technology has not increased the stagnant adoption rate stems from the fact that the market has failed and continues to fail at providing would-be users with evidence-based benefits of the technology in a meaningful way. We addressed this issue in an article published in the December 2011 issue of the Hearing Review (Amlani, Taylor, Weinberg, 2011). Figure 5 portrays technology from the same hearing aid which has been reported in three different ways. In the top panel, the technology is described in vague technical terms such as 100% digital, often seen in local and national newspapers as well as online advertisements. In the middle panel, the technology is described in detailed industry-based technical terms such as memories, channels, adaptive directionality, and adaptive feedback control. In the bottom panel, the technology is described using layman’s terms such as environment listening program, reduces background noise, and reduces whistling.
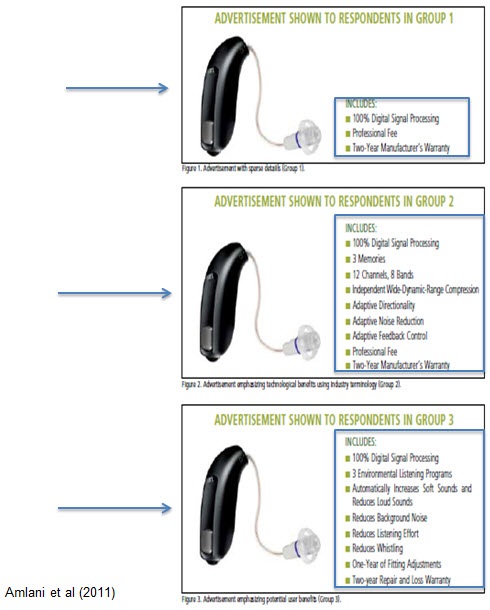
Figure 5. Variations in marketing terminology (Amlani, et al., 2011).
In this study, each frame was shown to a different group of listeners, with each group having an equal sample size and match for median income, hearing aid experience, age and gender. Each respondent was asked to provide the dollar amount they were willing to pay for the slide shown. Findings from this study revealed that when advertising utilized both vague and technical terms, seen here in the top box, listeners provided similar willingness to pay amounts for each individual component. However, when technology was framed using layman’s terms that demonstrated evidence-based benefit similar to that shown in the middle box, listeners in group 3 were willing to pay statistically more to obtain the same technology.
Further, the same study (Amlani, et al., 2011) assessed willingness to pay as a function of respondent’s experience with hearing aids. Figure 6 is taken from experienced and inexperienced respondents in group 3, that is those respondents who were shown technology framed using layman’s terms that demonstrated evidence-based benefit, revealed that inexperienced listeners were willing to pay more than their experienced counterparts for professional services. This is indicated in the red ovals. Experienced listeners, on the other hand, were willing to pay significantly more for technology, specifically directional microphones, than their inexperienced counterparts. This is highlighted in the blue ovals. The view that technology alone will improve adoption rates is a myth as seen by the stagnant growth over the past 30 years, despite tremendous advances in hearing aid technology.
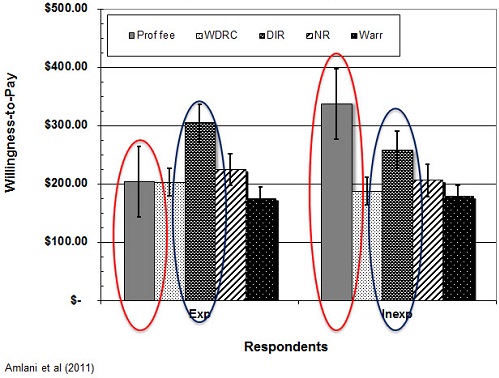
Figure 6. Willingness-to-pay comparisons between experienced and inexperienced users.
Improving adoption rates through technology is based on two factors. First, technology needs to be promoted in a manner that enhances user benefit based on sound empirical evidence. Second, inexperienced hearing aid users are not technology driven, but rather driven by the services they will receive related to the hearing aid fitting and rehabilitation process. Conversely, experienced listeners tend to be more technology driven given that they have likely experienced the fitting and rehabilitation process previously.
Myth 5: Unbundling Prices will Decrease Adoption Rates
For years I have speculated and continue to support the notion that adoption rates have remained stagnant because of the use of the predominant bundling pricing structure within the market. Presumably, audiologists and dispensers fear that by using the unbundling pricing approach, current and potential users are less likely to adopt hearing aids. We will assess the rationale for unbundling prices and its effect on adoption rate in this section.
Figure 7, taken from our work (Amlani, et al.) published in 2011, illustrates the differences between the bundled and the unbundled pricing strategies. The far left column, labeled “pure price bundling” is characterized by the pricing strategy in which the consumer has provided the total price for the product and all services. A derivative of pure price bundling is “partial price bundling,” seen in the middle column. An example of partial price bundling occurs when the consumer has provided the subtotal price for the product and the subtotal price for the services provided. This approach is commonly used by audiologists and dispensers during the dispensing of hearing aids. In contrast to the price bundled approach is the unbundled approach. Here, as seen in the right-most column, the consumer has provided an itemized price for each technology of the product and for each service provided.
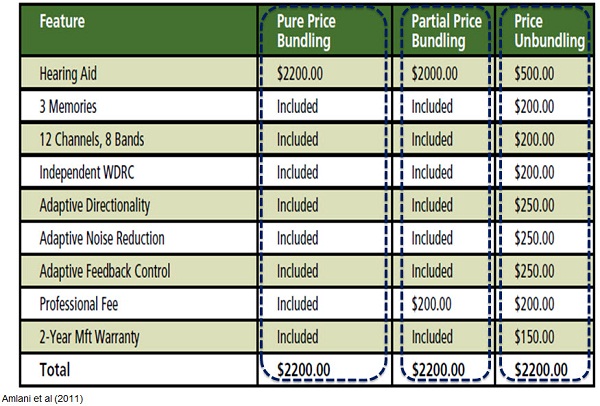
Figure 7. Differences between bundled and unbundled pricing strategies.
In this article (Amlani, et al., 2011), we also assessed respondents willingness to pay as a function of whether pricing was bundled and unbundled for the same technology framed in three different ways. Recall that the technology was described using vague terms, using industry terms, and using layman’s terms based on empirical evidence. What we showed was respondents’ willingness to pay as a function of each slide for the same device. We found that when the technology and the professional service provided were presented in an unbundled format, regardless of how the technology and services were framed, consumers were always willing to pay more in the unbundled condition than in the bundled condition. We found that these findings were statistically significant across groups. It was also worth noting that when the technology and services to be provided were framed in a manner that supported evidence-based benefits, such as the ability to hear in the presence of background noise and reduced whistling, respondents were willing to pay more when the technology was framed using both vague and technical terms.
Post-outcome analysis revealed that willingness to pay in a given pricing strategy was statistically influenced by experience with amplification. Specifically, listeners experienced with amplification were willing to pay the retail price of $1,531 for a hearing aid and professional fees presented in the bundled format, while listeners inexperienced with amplification were willing to pay $327 less for the same product and service. Conversely, both experienced and inexperienced listeners were willing to pay a similar price for a device and professional services framed using an unbundled strategy. The latter finding is critical if one considers that the bundled approach creates a dichotomy between listeners based on experience. Specifically recall that earlier I reported that experienced listeners were more sensitive to technology aspects while inexperienced listeners were more sensitive to rehabilitative aspects. The use of an unbundled approach virtually eliminates this dichotomy.
The question of whether to bundle or unbundle products and services within the hearing aid market is a complex one. Initial reports suggest that the unbundling pricing strategy is favored by current and potential users over the bundling pricing approach. One advantage to unbundling prices is that it creates a level playing field for those listeners who favor technology and for those listeners who favor rehabilitation. Given these findings, unbundling prices appears to improve adoption rates over the bundled pricing approach.
Myth 6: The Hearing Aid Market has an Elastic Demand
For decades it has been assumed by both dispensers and those in the industry that the hearing aid market was one in which consumers of amplification technology were sensitive to changes in price. In other words, increased prices meant lower adoption rates, and reduced prices meant higher adoption rates. Our sixth myth assesses the degree of the sensitivity or elasticity within the hearing aid market. Price elasticity, denoted by the Greek symbol epsilon, is used to measure consumer price behavior in economics. Price behavior is measured as a relationship between price and quantity. At higher prices, the quantity demanded is less. Conversely, as prices decrease, the quantity demanded is increased. This inverse relationship between price and quantity is termed the Law of Demand and designated by Qd.
Elasticity is a term that defines whether consumers are more or less sensitive to changes in price. Further, the elastic nature of the market dictates whether increasing or decreasing price will increase total revenue. There are two methods by which elasticity can be quantified. Figure8 illustrates the first method by which price elasticity is quantified. The data shown by the filled circles are hypothetical. Price elasticity is calculated by running a nonlinear or logarithmic line through all the points that best predicts the outcome of the data set. The outcome is then represented as a single negative number.
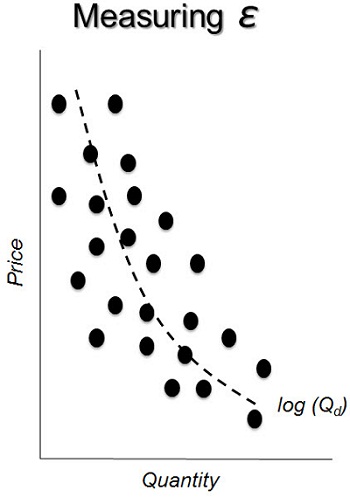
Figure 8. Measuring elasticity as a function of price and quantity.
The second method for calculating the price elasticity of the demand which is known as the Arc Elasticity is shown in Figure 9. Here, the objective is to determine whether the consumer’s sensitivity to price changes cross various points on a single demand curve. In other words, this method determines the amount of change between the two points on the curve for both price and quantity. Use of this approach ultimately allows for the examination of consumer sensitivity between changes in price and quantity demanded. The underlying formula, noted in Figure 9, calculates the percentage change in quantity, which is the numerator, and we divide it by the percentage change in price, which is in the denominator. I will explain this formula in some subsequent slides here.
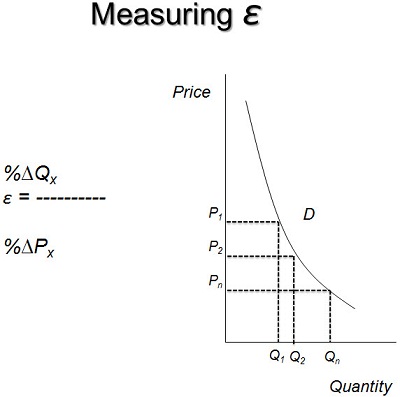
Figure 9. Measuring elasticity using the arc elasticity formula.
For both approaches of calculating elasticity, the interpretation is the same. When elasticity, or the value that you get, is greater than the absolute value of 1, the demand curve is said to be elastic. That is, consumers are highly responsive to changes in price. As prices increase by small amounts, quantity demanded will decrease usually by a substantial amount. Likewise, as prices decrease by a small amount, quantity demanded will increase usually by a substantial amount. On the other hand, when the elasticity is less than the absolute value of 1, the demand curve is said to be inelastic. Inelastic demand function suggests that consumers are less responsive to changes in price. For example, as prices increased, the quantity demanded will decrease only by a small amount. Similarly as prices decreased, the quantity demanded will increase but only by a small amount.
Today, only a handful of studies have assessed the demand function within the hearing aid market. The results from these studies (Aaron, 1987; Lee & Lotz, 1998; Amlani & De Silva, 2005; Amlani, 2010) indicate that the demand function is inelastic, with coefficients from all studies ranging between -0.31 and -0.54. As of the third quarter of 2011, the demand function for the hearing aid industry is -0.38. You might be asking, “What does all this mean?”
To illustrate, I will use the most recent demand function for the hearing aid industry (Amlani, 2010); that is the -0.38 value. A demand function of -0.38 indicates that as market demand increases by 3.8%, price decreases by 10%. Stated differently, if hearing aids were provided to users at no cost, absolutely free, there would only be a 38% increase in the demand for amplification technology. With respect to adoption rate, the present day conventional rate would increase from 24.6% to nearly 34%.
Figure 10 represents the demand function from the first quarter of 1980 through the third quarter of 2011. Note that within the green shaded area, the demand function for the hearing aid industry ranges between -0.31 and -0.54. In April of 2010, I reported that this small range correlates well with the narrow range of adoption rates released in the various MarkeTrak reports. In addition to these values, we also estimated the best and worst case demand function scenarios for the market, and we found values of -0.95 and -0.21, respectively. Note that in all instances, the demand function within the hearing aid industry remains inelastic.
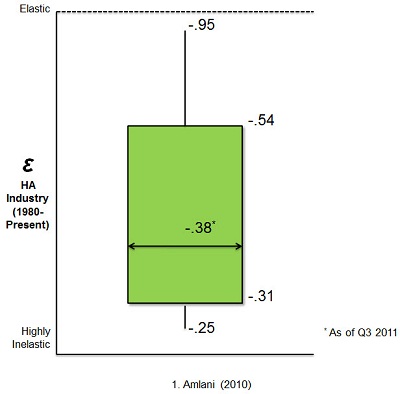
Figure 10. Demand function from 1980 to 2011 (Amlani, 2010).
The table in Figure 11 represents the influence of the demand function on the estimated conventional adoption rate. In 2012, there will be an estimated 8.45 million hearing aid users in the United States (Amlani, 2010). If the demand function is at its potentially lowest point, that is -0.25, and hearing aids are fully subsidized to the end user, the market will increase by 25%, or by 2.1 million new users. That is, the market will increase from 8.45 million to 10.57 million. If, on the other hand, the economy recovers and the market reaches its estimated highest point, which is -0.95, there will be a 95% increase in the number of new users, or an increase of 8.03 million new users that enter the market assuming that they are fully subsidized. In this instance, for this -0.95, the practical adoption rate has been reached. The hearing aid market is inelastic. This means that consumers are not sensitive to changes in price. Thus, use of tactics such as lowering the price of a product will not increase the number of individuals who purchase hearing aids by a substantial amount. In order to grow the market, concessions must be made to improve the inelastic function so that it becomes more elastic, or that the value becomes closer to the demand function of 1. We will discuss these concessions in greater detail under Myth 9.
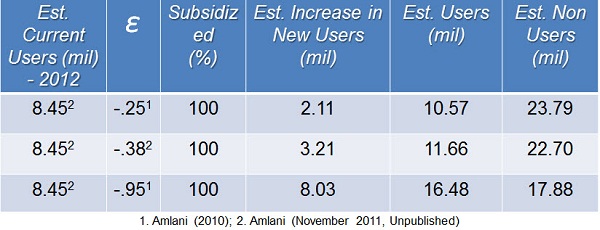
Figure 11. Price elasticity and estimated “conventional” adoption rate.
Myth 7: Reducing the Price of Hearing Aids will Increase Total Revenue in a Market with Inelastic Demand
In the previous myth, Myth 6, evidence was presented that the hearing aid market was inelastic. Related to the inelastic demand function was the fact that lowering prices would not improve adoption rates markedly. In Myth 7, we assess the validity that reducing the price of hearing aids in a market having an inelastic demand function will increase revenue.
The hearing aid market, as I presented earlier, is inelastic. If one were to use the Arc Elasticity method (Figure 12) to assess demand, one could find the point at which prices and quantity demanded become elastic. Using the data from the hearing industry’s association, economic estimates suggest that $1,623 is the ideal mean retail price for a single hearing aid in the United States (Amlani, 2010). Prices above $1,623 constitute the price point at which consumers are sensitive to changes in price. In other words, this is the region of elastic demand, while prices below $1,623 represent the price point at which consumers are not sensitive to changes in price (Amlani & De Silva, 2005). This is the region of inelastic demand. Please note that this curve and the various demand regions will differ from those of your individual practices.
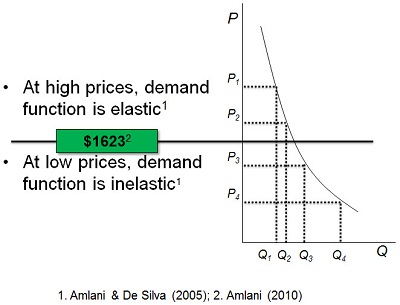
Figure 12. Arc Elasticity model used to assess demand of hearing aid and the optimal mean retail price.
Figure 13 demonstrates the relationship between total revenue and the demand function. Total revenue is defined as the sum of all price points multiplied by their corresponding quantities. The relationship between total revenue and demand function is displayed in Figure 13. If the demand function calculated using the Arc Elasticity method is elastic and the price of a hearing aid is increased, total revenue will decrease. If on the other hand, the demand function is elastic and the price of the hearing aid is reduced, total revenue will increase. For in any elastic demand, the solution and outcomes are reversed. Specifically, if the price for a hearing aid is increased, total revenue will increase. If, on the other hand, in an inelastic demand, the price of the hearing aid is reduced, total revenue will also decrease. Given these outcomes, it is possible to misinterpret the data. I am in no way advocating that patients be overcharged for amplification technology. Use of this table requires the diligent task of calculating Arc Elasticity and making decisions based on the data. I will provide some examples for you.
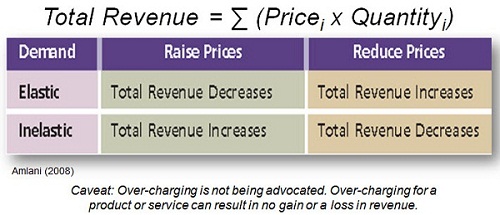
Figure 13. Relationship between elasticity and total revenue (Amlani, 2008).
The data in Figure 14 are derived from a hypothetical private practice. Last fiscal year, this practice dispensed 75 hearing aids which resulted in total revenue of $176,200. Figure 14 will serve as our control or our reference condition. This hypothetical practice is in need of new diagnostic and hearing-aid-fitting-related equipment. In order to purchase these items, the owner is considering changes to the pricing structure of hearing aids. The data are calculated using the Arc Elasticity method. Note that the total revenue notated by the R is nothing more than the quantity multiplied by the price. To calculate the percentage change in quantity, we subtract two adjacent points. For example, 17 minus 20. Then we are taking that 17 minus 20, or -3, and dividing it by the average of these same two points. So that is 17 – 20 or -3 divided by 18.5, which will give you the percentage change in quantity of -0.16.
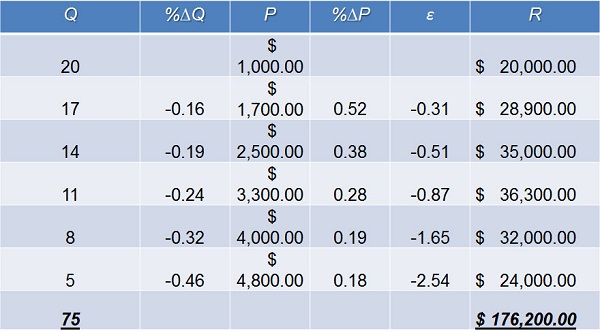
Figure 14. Hypothetical fiscal data for ABC Audiology.
We do the same thing for price for the corresponding price points. Here we are going to take $1,700, subtract it from $1,000, which gives us a product of $700. We then divide $700 by the average of these two points, which would be $1,350. Next, take $700 divided by $1,350 which will give you the percentage change in price of 0.52. The elasticity function between these two points is then derived by dividing -0.16 by 0.52, which equals -0.31. You will notice that all the values below $3,300 are inelastic, meaning that they are less than the absolute value of 1. Values $4,000 and higher are considered to be elastic because their values are higher than the absolute value of 1.
To illustrate the point of demand function and total revenue, assume that the owner of this hypothetical practice simply decides to decrease all price points by $200 (Figure 15). The owner acknowledges that decreasing price will increase demand, and for illustrative purposes, we are adding one additional quantity to each price point. In the forecast, the total number of devices dispensed will increase from 75 in our control condition to 81. The additional increase in units dispensed, however, results in only a $1,100 increase in total revenue. From my perspective, simply decreasing the price to dispense more hearing aids for a small increase in total revenue does not seem very business savvy.
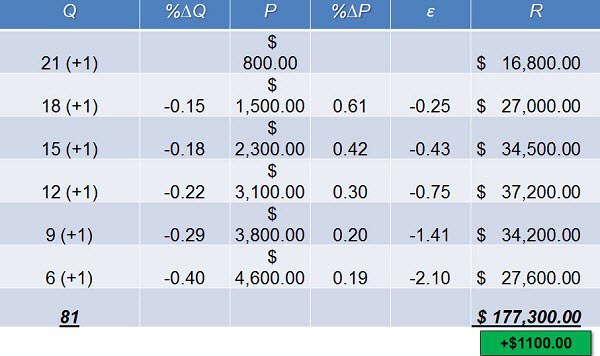
Figure 15. Forecast scenario for ABC Audiology when reducing product price by $200.
In this example, the owner of this hypothetical practice has decided to increase all price points by $200. The owner acknowledges that increasing price will drive away some of the customers, and we have considered that by subtracting one additional purchase from each of the quantities here (Figure 16). In this forecast, we are now dispensing 69 hearing aids as opposed to 75, but total revenue is now going to be reduced compared the control condition by $3,500. In this example, this practice has priced itself out of the market.
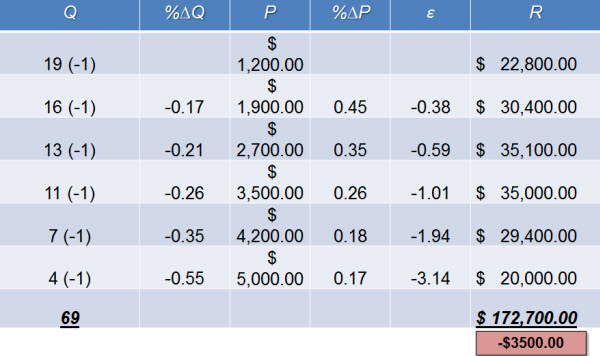
Figure 16. Forecast scenario for ABC Audiology when increasing original product price by $200.
In this final example, the practice has decided to utilize the revenue demand table that I showed you earlier (Figure 13). The question is, “Does total revenue increase?” Here you will notice that at points where there is an inelastic function, we have increased the price of the product by $200, and where it is elastic, we have reduced the price by $200. Where we have increased the price, we have reduced the quantity by 1 and where we have increased the price, we have increased the quantity by 1. You will notice that we are dispensing two fewer devices, so 75 to 73, but you will also notice that by doing this, we have increased our total revenue by $8,900 using that revenue table (Figure 17).
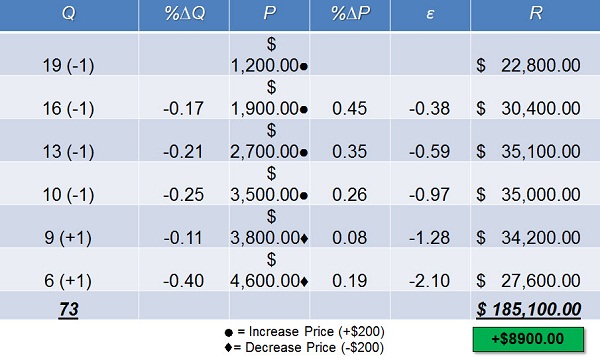
Figure 17. Forecast scenario for ABC Audiology after applying elasticity-revenue table.
In summary, understanding the impact of elasticity at various price points and applying the correct price increase or decrease can improve the bottom line. Specifically, this economic model suggests that the price of low-end hearing aids should be increased while the price of high end devices should be decreased. On the other hand, blindly adjusting prices is also an option. Beware, however, that implementation of the blind approach is likely to hinder revenue potential.
Myth 8: Federal Subsidies will Increase Adoption Rate
For nearly a decade, the hearing aid industry, in conjunction with various members of the House and Senate, has presented Congress with a bill that would provide Americans with a tax credit if they purchased a hearing aid. This tax credit is expected to improve the autonomy of the profession, as well as increase adoption rates. In this section, we assess the validity of whether such a tax credit, which is a form of a federal subsidy, can improve adoption rates. The details of the proposed bills are shown in Figure 18. One is to the House, labeled as HR 1646, and one is o the Senate, labeled S 1019. Note that both bills provide a $500 tax credit per qualified device for a maximum of $1,000 once every 5 years. The bills differ in the interpretation of qualified recipients and income cap, with the Senate version being least restrictive.
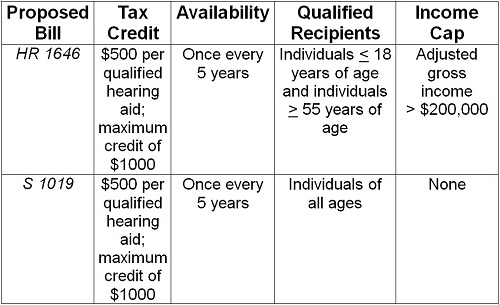
Figure 18. Amplification tax credit bills proposed by the House of Representatives and United States Senate.
The potential approval of the proposed tax credit has created a buzz in the industry that some hope will signal a marked increase in adoption rates of amplification technology. In 2005, for example, Kochkin suggested that the tax credit would increase adoption rates by as much as 15%. In 2012, this would result in an estimated 3.89 million new users entering the market. A second example suggesting that the tax credit would increase adoption rates was published in the November 2009 issue of the Hearing Review. Here Stephen Hansbrough, the CEO of HearUSA, proclaimed that the tax credit would flood the market by an additional 10 million new users, thus increasing the conventional adoption rate from 24.6% to just under 55%.
Before we assess the validity of these industry claims, it behooves us to first understand how the tax credit works. This is exemplified in Figure 19, illustrating a single monaural device having a retail price of $2,000. The left-hand column labeled self-pay is our control condition. Here, the average median gross income for someone age 65 years is $28,305. Federal taxes of 22.65% are applied to this gross income resulting in a net income of $21,893.92. After paying the retail price of the hearing aid, which is $2,000, the self-paying American is left with a disposable income of $19,893.92. In the middle and right-hand columns are various versions of a tax credit. The reason that both tax credit methodologies are shown is because there is no published reports as to which model is being proposed to Congress.
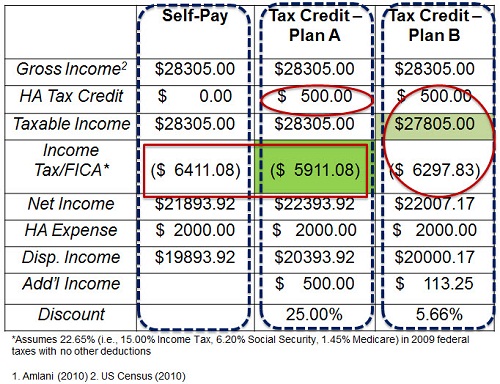
Figure 19. Hearing aid tax credit scenarios for a self-pay American purchasing a $2000 monaural hearing aid (Amlani, 2010; U.S. Census, 2010).
For Plan A in the middle (Figure 19), note that a $500 tax credit has been applied, which reduces federal taxes by $500. This essentially is the same as a 25% discount on the retail price of aid. Plan A is believed to be the tax credit approach proposed to both the House and the Senate. You will also notice that there is $500 difference in the disposable income.
For plan B, which is in the right-most column (Figure 19), note that a $500 tax credit has also been applied, but that this tax credit is now being reduced from the taxable income. When we do this, when we subtract $27,805 from this new taxable income, we end up with a disposable income of $20,000.17 after the hearing aid has been paid. The difference between the tax credit disposable income for plan B and the self-pay means that the plan B would allow for $113.25 in additional income. When we apply this as a discount, it basically means that the hearing aid was discounted by 5.66%.
Given that the hearing aid market is inelastic, we can now assess the expectation by industry personnel that the hearing aid adoption rate will increase between nearly 4 million and 10 million new users. Figure 20 shows outcomes based on plan A of the tax credit, which suggests that amplification costs will be reduced by 25%. I am showing that 25% in the subsidized column. Further estimates were derived for the current demand function value, which is -0.38, as well as the lowest and highest demand function values that we have found historically, -0.31 and -0.54. The blue shaded area represents the conventional adoption rate. The green shaded area represents the practical adoption rate. Note that at the highest demand function recorded in the hearing aid industry over the past 30 years and with the 25% discount provided to new users as a result of the tax credit, hearing aid adoption rates will only increase by 1.14 million new users in both the conventional and practical adoption rates. The number presented in Figure 20 is markedly smaller than those purported by industry personnel.
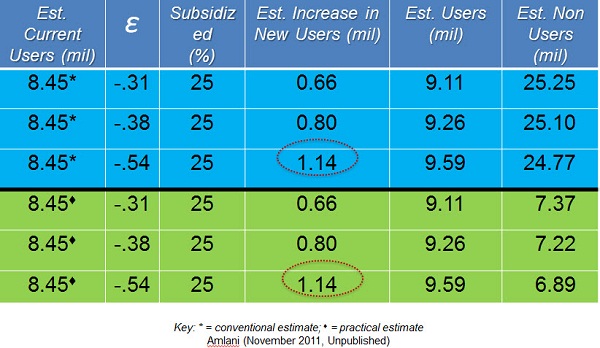
Figure 20. Hearing aid tax credit (Plan A of Figure 20) and estimated users.
If the tax credit had passed today, given that our demand function is -0.38, we would expect to see an increase in adoption rate of about 800,000 new users. The estimate of 800,000 new users in today’s market is not guaranteed. This estimate depends on the ability of all potential new users to pay the average cost of $2,000 per device at the time services are rendered. Given that financial concerns abound for about 30% of potential users, the estimate of 800,000 persons is actually an overestimate. A more realistic estimate based on the evidence suggests that the tax credit will increase adoption rates by roughly 560,000 new users.
Another limitation of the proposed tax credit is that it fails to provide appropriate discounts based on the demand function. Recall that hearing aid price is elastic at higher levels above $1,623, and inelastic below $1,623. Thus for a monaural device retailing at $1,000, the tax credit offers a 50% discount at a price point where consumers are not price sensitive. Conversely, the tax credit offers a smaller discount, for example, 17% on higher-end monaural hearing aids. This model unfortunately will result in a large number of low-end hearing aids being dispensed.
You might ask what is wrong with dispensing low end amplification. Well, research suggests that these devices are more prone to ending up in the proverbial drawer because they fail to meet the listening needs of the user (Callaway & Punch, 2008; Ramachandran, Stach & Becker, 2011). The hearing aid tax credit, which is one form of a federal subsidy, will help the profession become more autonomous as well as improve the adoption rate of hearing aids. However, the expected growth of new users entering the market is markedly less than that being portrayed by those in the industry.
Myth 9: Over-the-counter and Internet-sold Devices will Reduce Adoption Rates
In Myth 6, recall that we discussed the various demand functions. Further recall that the hearing aid market was defined as an inelastic market, meaning that consumers were not sensitive to changes in price. In order to improve upon price sensitivity, or to make the inelastic market more elastic, concessions need to be made. One such concession is the introduction of over-the-counter devices. It is conjectured that doing so will reduce the U.S. adoption rate. In this section, we assessed the validity of this claim from an economic standpoint.
Improving the demand function is the goal of every industry. The factor that has the greatest influence on improving demand function and ultimately adoption rate is the availability of substitutes. At present, the hearing aid market has few substitutes, and those that are available are more invasive and restricted to a select population of hearing loss types. Examples of these substitutes include middle-ear implants, bone-anchored devices, and cochlear implants. If promoted and distributed correctly, over-the-counter devices would reduce stigma, increase awareness of hearing healthcare, and improve adoption rates. Preliminary data from my laboratory suggested over-the-counter devices could reach between 600,000 and 1 million units sold in the first year with the likelihood of nearly 40% of these purchases leading to sales of more permanent amplification technology.
The second most important factor in improving the demand function is education. Consumers who view the hearing aid, rehabilitation, and counseling as a necessity will increase the demand for the product and services. Many consumers, especially new hearing aid users, want and need these services, but fail to ask whether they are provided because of the market’s push towards technology. If the profession is to grow and flourish, education through rehabilitation and counseling efforts must become a priority.
A third factor in improving the demand function is to provide the user with the comparison chart of features across manufacturers and models. By doing so, the consumer becomes a part of the treatment process which increases their likelihood of a trial period with a device. In fact, research has shown that most current and potential users of amplification technology are not aware of how the technology operates (Amlani, at al., 2011). Given that creating such a chart is time-consuming, there is a Web site called loginhear.com. Do note that I am a consultant to this Web site and thus have financial, equitable, and intellectual interests.
Reducing out of pocket expenses is the fourth factor that is known to improve the demand function. One way to reduce expenses to the end user would be for insurance companies to provide greater benefits towards the retail cost of hearing aids. Another option is for consumers to utilize third-party financing. Here, large ticket items are divided into smaller, more manageable payments and spread out over a period of time.
Switching costs is the final factor known to improve the demand function. Here the goal is ensure that consumers’ existing equipment such as an MP3 player Bluetooth capability, cell phone and FM system are operational with the new device. Failure of the new device to utilize the external components will result in non-adoption.
In order for the hearing aid market to grow, it must improve the demand function. If the market is to grow, introducing hearing aid substitutes such as over-the-counter devices must be a consideration. The manner in which the substitute product is promoted and distributed must be carefully considered and audiological egos must be laid to rest. In addition, counseling and rehabilitation needs to be placed ahead of technology. Doing so will not only increase adoption rates, but hearing aid satisfaction and, more importantly, the audiologist as the gatekeeper of hearing healthcare.
References
Aaron, J. M. (1987). An economic study of the United States hearing aid industry: a demand- and supply-side examination. (Doctoral dissertation, University of Illinois, 1987).
Amlani, A. M. (2008). How patient demand impacts pricing and revenue. The Hearing Review, 15(3), 34, 36.
Amlani, A. M. (2010). Will government subsidies increase the US hearing aid market penetration rate? Audiology Today, 22(2), 40-46.
Amlani, A. M. & De Silva, D. G. (2005). Effects of business cycles and FDA intervention on the hearing aid industry. American Journal of Audiology, 14(1), 71-79.
Amlani, A. M., Taylor, B., & Weinberg, T. (2011). Increasing hearing aid adoption rates through value-based advertising and price unbundling. Hearing Review, 18(13), 10-17.
Callaway, S. L., & Punch, J. L. (2008). An electroacoustic analysis of over-the-counter hearing aids. American Journal of Audiology, 17(1), 14-24.
Clutterbuck, N. (2008). It’s the stigma stupid…not! The Hearing Journal, 61(10), 36,38.
Doyle, J. B. (1980). How much is a hearing aid worth today? Hearing Instruments, 31(9), 26.
Kirkwood, D.(2010). In troubled times, the hearing aid industry remains an island of stability. The Hearing Journal, 62(13), 11-12, 14, 16.
Kochkin, S. (2000). MarkeTrak IV: Correlates of hearing aid purchase intent. The Hearing Journal, 51(1), 30-38.
Kochkin, S. (2002). Consumer rate improvements sought in hearing instruments. Hearing Review, 9(11), 18-22.
Kochkin, S. (2005). MarkeTrak VII: Hearing loss population tops 31 million people. Hearing Review, 12(7), 16-29.
Kochkin, S. (2007). MarkeTrak VII: Obstacles to adult non-user adoption of hearing aids. The Hearing Journal, 60(4), 24, 26, 28, 31-34, 36-41, 44, 46, 48, 50.
Kochkin, S. (2009). MarkeTrak VIII: 25-year trends in the hearing health market. Hearing Review, 16(11), 12, 14, 16, 18, 19, 20, 24-26, 28, 30-31.
Kochkin, S. (2010). MarkeTrak VIII: Consumer satisfaction with hearing aids is slowly increasing. The Hearing Journal, 63(1),l 19-27.
Lee, K. & Lotz, P. (1998). Noise and silence in the hearing instrument industry. Working Paper, Department of Industrial Economics & Strategy, Copenhagen Business School.
Lundeen, C. (2004). Hearing aid prices in historical context. Hearing Review, 11(10), 18-19.
Ramachandran, V., Stach, B. A., Becker, E. (2011). Reducing hearing aid cost does not influence device acquisition for milder hearing loss, but eliminating it does. Hearing Journal, 64(5), 10, 12, 14, 16-18.
U.S. Census Bureau. (2011). 2010 Census data products: United States, at a glance. Retrieved from https://www.census.gov/population/www/cen2010/glance/
Cite this content as:
Amlani, A. (2013, March). Unitron Practice Development Series: Myths about the hearing aid market. AudiologyOnline, Article #11643. Retrieved from https://www.audiologyonline.com/
