
This text course is an edited transcript of an Audioscan webinar. Download supplemental course materials.
Learning Outcomes
- After this course learners will be able to explain how to verify the directional microphone function of any modern hearing instrument using the Verifit and/or Verifit 2 test box.
- After this course learners will be able to explain how to trouble-shoot certain unexpected directional mic results.
- After this course learners will be able to describe some special considerations associated with doing directional mic tests on-ear.
Introduction
David Smriga: In today's course, we will be exploring Audioscan’s unique directional microphone testing capabilities and how these tests can be used to quantify the performance of today’s modern directional microphone designs. Although we will be depicting the various test procedures with images created using the Verifit 2 real-ear measurement and verification system, these same tests can be performed with the original Verifit system as well.
As is the case with any educational material produced by Audioscan, any recording, presentation, adaptation, publishing or sharing of this material is prohibited without the express written permission of Audioscan.
Directional Microphone Technology
Directional microphone technology has been available for nearly fifty years, and remains even to this day, the single most effective approach to improving signal-to-noise ratio (SNR) for certain listening conditions within a “head-worn” hearing instrument device (Lybarger & Lybarger, 2000). Why is improving SNR important? Because even modest improvements can have a significant impact on speech intelligibility, particularly in less reverberant environments.
As Harvey Dillon (2006) has illustrated, a 1 dB improvement in SNR can have as much as an 18% improvement in speech intelligibility for speech discourse. This advantage is not as great for isolated speech sounds where it can be as little as 3%. But, if we take 10% as a realistic overall improvement potential and apply that to behind-the-ear (BTE) directional fittings, which average about 3 to 4 dB improvement in SNR, a well-fit directional microphone device could potentially improve speech intelligibility in noisy environments by as much as 30 to 40%. (It is often noted that for children, the advantages of a directional microphone in improving SNR should be weighed against the advantages of omnidirectional functionality from the perspective of safety and learning).
It is also worth noting that directional microphones are responsible for a substantive difference on key user ratings of satisfaction. As indicated in a subset of consumer survey data through MarketTrak (Kochkin, 2003), hearing instruments equipped with directional microphones significantly outperform hearing instruments that do not have this capability in virtually every area meaningful to a consumer in quantifying satisfaction with hearing aid performance.
History
Today’s directional microphone technology is very different from the directional microphone technology used up until around 1995. Until then, directionality was achieved mechanically through a dual-port directional microphone system design.
Sound energy would enter these two ports and be directed to opposite sides of the hearing aid microphone’s diaphragm. Sounds coming from behind would thus arrive at the rear port first and then at the front port a bit later. By inserting a series of mechanical baffles in the rear sound port, it is possible to delay the arrival of the rear sounds just enough, so that they arrive at the back side of the microphone’s diaphragm at the same time as these same sounds reach the front side of the diaphragm from the front port. This creates a suppression of the rear energy driving the microphone.
The end result is a microphone that favors delivering sounds from the front at greater intensity to the amplifier than sounds from behind.
Today, directional microphone functionality is primarily a property of software, rather than mechanical design. In modern directional hearing instruments, two omni-directional microphones both feed their signals to a digital signal processing chip which is driven by software that analyzes the phase, amplitude and arrival time difference between these two signals. The software then applies an electronic “delay” to create the desired directional effect. This allows directional microphones to be either “on” or “off”, which is a key advantage over the mechanical design mentioned previously. This approach also facilitates creating features to maximize the directional advantage in a variety of listening conditions and even to turn the directional feature “on” automatically when the environmental conditions being read by the software indicate that a directional advantage should now be activated.
As a result, you can now encounter a variety of directional microphone capabilities based on the software algorithm used and the hearing aid system’s design. Polar patterns can either be fixed and selectable or adaptive and changing automatically, and the operator’s ability to access these various capabilities can either be manual (by switching memories or pressing a button) or automatic through the software’s analysis of the incoming signal and its determination as to what needs to be done next from a directional performance perspective.
And, let’s not overlook one other key modern technological tool for improving SNR: the remote microphone. Many of these remote microphone devices also include a directional microphone capability, a feature which should be included in any discussion about measuring or verifying a directional microphone’s function.
Measuring Directionality
Most readers should be familiar with the ANSI standard methodology for testing directional microphones using the polar plot. The polar plot is obtained by placing a hearing aid attached to a coupler that is mounted either on a pole or inside a manikin’s head. This assembly sits on a device that slowly rotates it 360 degrees in the presence of a single-source sound field speaker that generates a pure-tone stimulus. As the hearing aid is rotated in the presence of this single-source stimulus, the output at the varying angles of incidence are measured and recorded as the polar plot.
Polar Plots
There are several classic polar patterns that have been identified and are often used as reference when describing the functionality of a given directional microphone. These include the following:
Bi-directional. A polar pattern where the nulls of the polar plot are at both the 90 and 180 degree orientations. This type of polar pattern could be obtained if a hearing aid were equipped with two omni-directional microphones, one forward facing and one rear facing, but with no delay incorporated in the rear microphone’s design. In this situation, sounds arriving from the left or right side would reach both microphones at the same time and would cancel each other at the amplifier. However, by applying various internal processing time delays, you can produce a variety of other directional patterns.
Cardioid. In this pattern, the directional system is more sensitive to sounds arriving from the front (0 degrees azimuth) and least sensitive to sound arriving directly from behind (180 degrees azimuth). The polar pattern is called a cardioid directional pattern, because of the heart shape this polar plot presents.
Hypercardioid and Supercardioid. More common than either of the two polar patterns mentioned above is the hypercardioid pattern. In this case, instead of having one null at 180 degrees, you will see two nulls at opposite sides, but in the back half of the polar diagram. This creates a second “lobe” that these two nulls surround, which is not as large as the front lobe. This characteristic is called a hypercardioid pattern. If the second lobe is reduced in size even further in comparison to the front lobe, then the term supercardioid pattern is generally used to describe this characteristic.
KEMAR
In addition to measuring polar plots from a hearing aid affixed to a coupler that is mounted on a pole, polar plots can also be obtained by affixing the hearing aid to a coupler that is imbedded inside the head of a KEMAR manikin. The manikin introduces into the test environment the average head shadow, body baffle, and pinna effects that would impinge on sound energy as it reaches the ear canal and can provide a more realistic representation of the potential benefits associated with directional microphone designs.
When measuring an omni-directional hearing aid placed on the right ear of a KEMAR manikin, the head shadow, body baffle and pinna effects create a certain “hyper-cardioid” directional effect all on their own. When this input environment is further altered by the addition of a directional microphone device, the hearing instruments favored sensitivity to sounds coming from the front and from that side of the head is further enhanced.
Considerations Regarding Conventional Polar Plot Testing
The next time you examine a polar plot, it would be worth keeping in mind the following factual elements:
- Polar plots are typically obtained in the presence of a single, pure-tone frequency.
It is probable that polar pattern results will vary as a function of the pure tone frequency used to obtain the result. As such, a single pure tone pattern may not be descriptive of the overall directional capability of a given instrument.
- Polar plots do not typically measure in the presence of multiple input sources.
The pure tone stimulus used during a polar plot measure is produced by a single sound field speaker. When you measure this polar plot, you are measuring the output that is produced by a single source of input, as that source of input impinges on the hearing aid from different angles. This is generally not the environmental condition we are interested in improving when we choose to fit a patient with a directional microphone. We are likely more interested in whether or not the directional microphone can provide some form of speech in noise or signal in noise advantage. Thus, measuring performance when at least two signals are present -- one signal to which the patient or person is focused on listening, and another signal coming from another direction which will act as a jamming signal to the initial signal – would provide a more useful result. Obviously, polar plots do not measure in such a condition.
- Polar plots can be less robust if the hearing instrument that you are measuring uses non-linear or compression amplification.
I will talk more about this particular characteristic in a few moments.
Methods of Quantifying Directional Advantage
Several methodologies have been developed over the years to equate the information measured within a polar diagram into some quantification of the advantage such performance may yield in terms of signal-to-noise improvement.
Directivity Index (DI)
One such quantification is the Directivity Index, or DI. To obtain a DI number, one compares the output measured in the polar diagram at 0 degree azimuth to the output measured in the polar diagram at all other angles of incidence. The overall ratio between these two values becomes the DI. The larger the DI, the more attenuating the directivity is relative to the output at 0 degrees. In the case of two microphone array devices, DIs of up to 6 dB have been measured (Killion, 1998).
Articulation Index-Directivity Index (AI-DI)
Another quantification is the AI-DI, or Articulation Index-Directivity Index, which is a further calculation of the DI based on the articulation index score methodology, or in Audioscan or Verifit vernacular, the speech intelligibility index (SII) weighted DI. By measuring the DI at four speech frequencies (0.5, 1, 2 and 4 kHz) and adjusting the AI based on the improved advantage that the DI offers at those frequencies, one can estimate the impact the directional microphone may have on overall speech intelligibility.
Unfortunately for most of us, because we do not have an anechoic chambers and polar plot measuring equipment in our clinics, neither the DI nor the AI-DI are calculations that can easily be made in our clinic. We must rely on other techniques for quantifying directional microphone advantage clinically.
Front-to-Back Ratio (FBR) Test
At the clinical level, there are two means by which one can quantify the potential advantage of a given directional microphone’s performance. One method is called the front-to-back ratio (FBR) test. By comparing the output levels measured across frequency for input stimuli coming from 0-degrees azimuth, to the output levels measured across frequency for input stimuli coming from the 180-degree azimuth, one can then calculate the FBR; the greater the FBR, the more potential for improvement in SNR. Importantly, however, if you conduct an FBR test on a compression hearing aid, the gain that is applied to these two separate measurements will be different, and thus, the gain becomes a second unintended variable when comparing these two output curve measurements as will be described later.
Speech-in-Noise (SIN) Test
A second clinical procedure is a speech-in-noise test, where you measure both the omnidirectional and directional modalities. Speech-in-noise tests create an environment where there is both a target signal and a jamming noise coming from different directions at the same time. If the directional mic provides some improvement in the SNR as it relates to these two spatially separated signals, then the speech-in-noise test result should be better with the directional mic on than off. Some examples of tests that could be used for this purpose are the SIN, QuickSIN, and HINT.
Compression Effects
Let me speak a bit more about compression in regard to directional microphone performance. The effects of compression on a polar plot or an FBR test were quantified through a FBR testing procedure utilized by Todd Ricketts (2000). In his research, data from two hearing instrument devices were obtained, first with compression off, and then with compression on.
In the traditional FBR measurement condition, where only one signal is presented sequentially during the 0-degree and 180-degree measures, the FBR result is less with compression ON than with compression OFF. This is likely due to the fact that when the 180-degree measures were obtained, the lower input signal coming from the directional microphone (compared to the 0-degree signal) caused the gain to go up, thus reducing the difference between the 0- and 180-degree measurement results.
In the modified measurement condition used in this study, two signals (one from a speaker at 0 degrees and one from a speaker at 180 degrees) were presented simultaneously for both the 0-degree and the 180-degree test. The test signal frequency was delivered from one speaker and a jamming frequency was delivered from the other speaker 100 Hz above the test frequency. This created an equal overall input “load” on the amplifier for both the 0-degree and 180-degree tests, thus “freezing” the gain for both tests. With gain no longer a variable during the test, the FBR results with compression ON and compression OFF are essentially the same. In other words, to obtain a more realistic FBR when measuring compression hearing aids, the front and rear input signals should be presented at the same time.
A Unique Way to Measure Directional Performance
This leads us to Audioscan’s approach to directional microphone measurement. By delivering two input signals simultaneously from different directions, and using Fast Fourier Transform (FFT) analysis, Audioscan equipment can quickly and accurately assess the directional effect of the system being measured while addressing the impact of compression on sequential FBR curves described previously. Clinicians using the Audioscan directional test will observe two frequency response curves representing the output of the system for test signals coming from the front and rear of the device at the same time.
If you examine the test box of a first generation Verifit system, you will immediately notice two speakers, one located in the upper left corner and one located in the upper right corner of the test box. To conduct an Audioscan directional test, you place the hearing aid attached to the coupler microphone such that that front and the rear mic ports of the hearing aid rest on an imaginary 45-degree angle line pointing toward the left speaker, with the front mic of the hearing instrument closest to the left speaker. If you orient the hearing instrument in this fashion, this creates a condition where the signal coming from the left speaker is directed at 0-degrees azimuth and the signal coming from the right speaker is directed towards the null of a typical hypercardioid pattern (Figure 1).
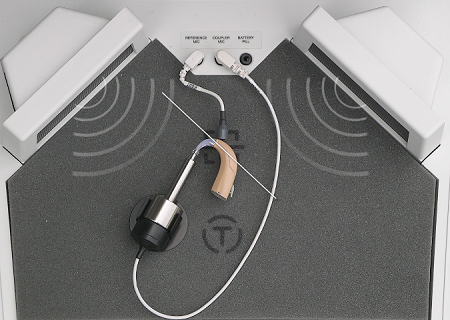
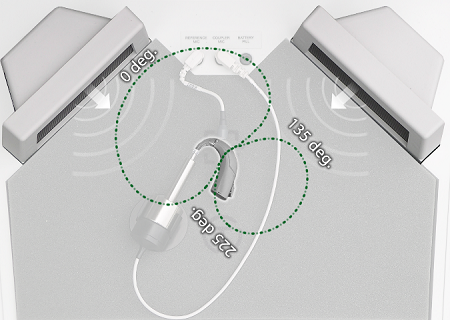
Figure 1. Recommended positioning for directional microphone verification in the Verifit.
In the Verift 2, both a binaural coupler and an “as-worn” hearing aid orientation is employed (Figure 2). This allows the tester to place both a right and left hearing instruments in the test box at the same time, and run right and left directional microphone tests without having to remove and replace monaural devices.
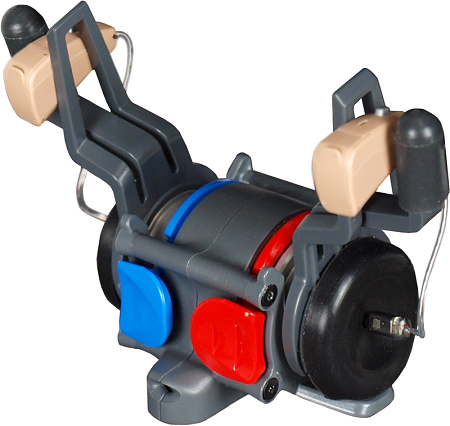
Figure 2. Verifit 2 binaural coupler.
For the directional test, the front speaker (0-degree azimuth speaker) is sitting in the front center of the test box, and both hearing aids are oriented to face it (Figure 3). This becomes the 0-degree speaker. Inside the lid of the test box are two additional speakers - one to provide the jamming signal for directional testing of the right aid and one to provide the jamming signal for directional testing of the left aid. When the lid of this test box is closed, the orientation of these jamming signals align with the null (left or right) of a typical hypercardioid pattern, as was the case with the original Verifit test box.
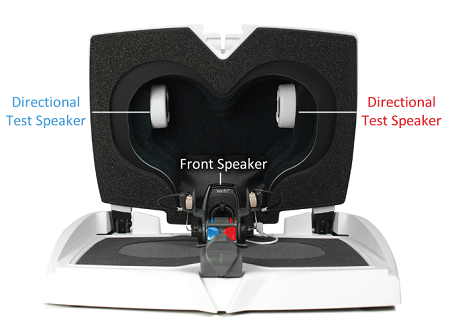
Figure 3. Recommended positioning for directional microphone verification in the Verifit 2.
In addition to orienting the hearing aids so that they are facing the front speaker, another important consideration in preparing for directional testing is to swivel and rotate the hearing aids, which are now attached to the coupler on a suspended stabilizer component until you get the front and rear microphones aligned on a horizontal line. In other words, the two mic ports should align to be parallel to the floorboard of the test box. Figure 4 shows an example of the correct orientation for directional testing of a behind-the-ear (BTE) hearing aid that is being prepared for directional testing inside the Verifit 2 test chamber.
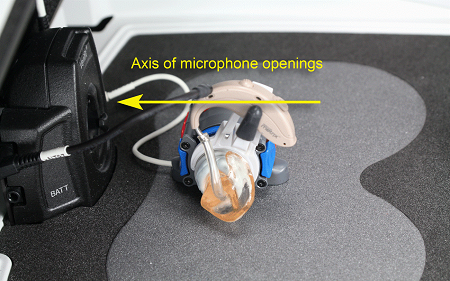
Figure 4. Orientation of a BTE for directional testing in the Verifit 2.
Figure 5 shows the correct orientation of the two microphones of an in-the-ear (ITE) hearing aid that is being prepared for directional testing in the Verifit 2 test chamber.
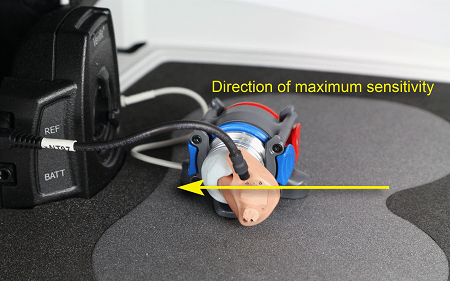
Figure 5. Orientation of an ITE for directional testing in the Verifit 2.
Audioscan’s directional test is performed by directing two broad band noise signals simultaneously - one from the front speaker and one from the appropriate rear (or jamming) speaker. These simultaneous signals are used to “prime” or prepare the hearing instrument for directional testing, particularly if the device has any form of automated features.
Periodically, there are short, rapidbursts of one or the other of these noises presented to the hearing aid independently from the front and rear speaker locations. These bursts are short enough in duration that the hearing instrument performance that was primed by the simultaneous input conditions will not change during the burst measurement moment. By using simultaneous input noises, we assure that the directional test result is unaffected by frequency compression and/or feedback managers that use phase cancellation as part of their system’s design.
Simultaneous Stimulus Conditions
There are two versions of simultaneous stimulus conditions to choose from within Audioscan technology. These are Noise + Noise or Speech + Noise.
Noise + Noise Directional Test
When the Noise + Noise test signal has been selected, the signal pulses on and off, rapidly alternating between speakers, and a single measurement is made during each pulse. Although the measurement intervals are equal in duration, the stimulus pulse from the rear speaker is kept on for an extended time. This is because adaptive directional hearing instruments look for the noise source and modify their polar pattern to aim the null toward it. The longer duration of noise coming from the jamming rear speaker, won’t affect the measured directional performance, but will ensure that adaptive products orient correctly.
Speech + Noise Directional Test
Since speech activated directional microphone technology is available in modern hearing instruments, this Noise + Noise stimulus condition would fail to automatically activate such a directional function. Thus, Audioscan also offers a Speech + Noise stimulus to ensure directional devices requiring the presence of speech in noise are appropriately activated.
When this stimulus type is selected, the ISTS (International Speech Test Speech) stimulus is presented from the front speaker while the noise stimulus is presented from the rear. At regular, alternating intervals, the speech is momentarily turned off and a short burst of broadband noise is presented in a rapidly alternating fashion from the front and rear speakers so that the two-curve measurement can be taken. This cycle repeats rapidly to produce curves that display the directional microphone performance of the hearing instrument. Note that the speech component is not part of the measurement, but is simply used as the primer to activate the appropriate hearing instrument behavior.
Video Demonstrations
We will now demonstrate a variety of directional microphone results and behaviors that one can induce using Audioscan’s two-signal, FFT measurement technology. The first video will demonstrate the effect one can expect to see when a hearing instrument switches from omni-directional to directional modality. All of these videos were recorded using the Verift 2 system.
Video 1. Omnidirectional to directional.
There is a test box directional screen that you will see on your equipment once you activate the directional mic test protocol. You would click on a test button to start it. In this case, it is a Noise in Noise test at 65 dB, and the hearing aid is currently set to its omnidirectional mode. In the video, you can see how the two measurement curves are overlapped in the omnidirectional condition as one would expect. But when we activate the directional mic through the programming software, you can see immediately that the two measurement curves representing output for signals from the two separate speaker locations separate. Once you click the green check in the operating box to the right, you will freeze those two curves.
Now you have a thick curve which represents the output that is being recorded at the coupler microphone for the signal that is coming from the 0-degree azimuth speaker. In addition to that, a second thin curve represents the output for the signal that is coming from the rear speaker. These two curves separated substantially when the directional microphone capability was activated. We can clearly see that once the directional microphone has been activated, there is a significant favoring of output for signals coming from the front of the hearing instrument versus signals coming from the jamming direction, which, in this case, is the null on the right side of the hearing instrument.
Directional Results as a Function of Input Level
The second demonstration will show you a directional result as the input level of the stimulus changes. Certain hearing instruments can change their directional performance as a function of input level.
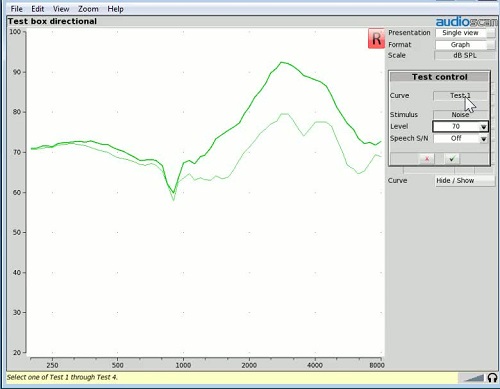
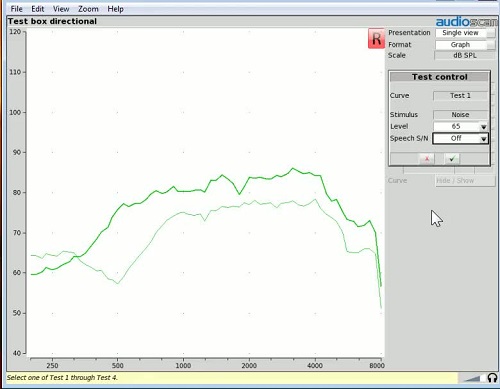
Video 2. Directional result as input level of stimulus changes.
Once again, you see the test box directional test. We start the test by clicking on the test button. In this case, we are generating a noise in noise test at 60 dB. At 60 dB, the front and rear curve separation seems to be from about 1500 Hz and lower. However, when we change the input level to 70 dB, now the curve separation seems to have extended down to about 750 Hz. In other words, the directional capability has expanded. When we change the input level to 80 dB, that curve separation expands even further into the low-frequency region. Clearly, the directional capabilities of this hearing instrument change as a function of input level.
Directional Results as a Function of SNR
In the third demonstration, we are measuring a directional hearing instrument which changes directional functionality as a function of SNR. When you choose a speech-in-noise test with Audioscan equipment, you will also have an opportunity to change the SNR at which the speech and the jamming signal are presented. The SNR can be adjusted from 0 to a favorable SNR of +12 dB.
Video 3. Changes to the directional functionality as a function of SNR.
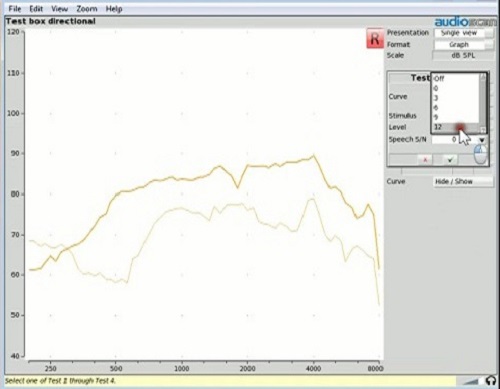
Now we are using a speech-in-noise test where we have the opportunity to control the SNR. The current SNR in this case is 0 dB. In this video, the hearing instrument starts off in omnidirectional mode, but through its internal analysis of the sound field, the system eventually activates the directional microphone, which can be verified by the subsequent front and rear curve separation that appears.
Now let’s change the signal to noise ratio to +12 dB, which is the other extreme provided by the equipment. We see that because the input signal already is providing 12 dB of favorable SNR, the decision of this particular hearing aid technology is to go back to the omnidirectional condition at which it started. The only thing that changed during this video demonstration was the SNR, and clearly this change in the test environment had an impact on the performance of the directional system.
Adaptive Directional Interaction
This fourth video demonstration captures the adaptive changes in the directional functionality that can occur in an automatic directional microphone system.
Video 4. Adaptive changes in the directional functionality of a hearing instrument
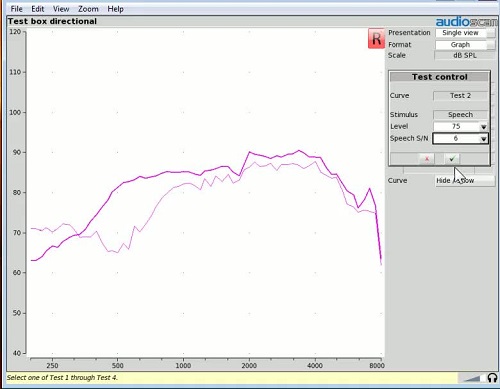
The video begins with a test using a speech-in-noise input stimulus at a 6 dB SNR and 75 dB input level. Clearly at the beginning of this test, the hearing aid is doing some thinking. It starts off in omnidirectional mode, but eventually the hearing aid algorithm begins to recognize that the input condition may require some directional capability.
Over a period of time, we can actively watch the hearing instrument analyze the incoming signal characteristics , make its decision on what needs to be done with the microphone mode in the device and then activate a solution based on that analysis, which in this case is to create a fairly dramatic directional microphone advantage.
Testing a Directional Mic Imbedded in a Remote Mic
In addition to these four test conditions that have just been demonstrated, there are other capabilities that are worth talking about and demonstrating. A relatively new feature provided with modern hearing instruments is the option of a remote microphone. These remote microphone devices are often also equipped with a directional microphone. This technology can also be verified with Audioscan equipment.
Remote microphones generally are paired to hearing instruments via some form of wireless or Bluetooth connection. These remote microphones can either be handheld, which would often be something that the hearing aid wearer might place on a table between themselves and a talker, or they can be clipped to the clothing of a talker, moving the microphone even closer to that source of input.
Directional remote microphone technologies can either be separate devices or in some cases, you will find that they are integrated into a wireless remote control so that a device the hearing instrument wearer might carry in their pocket to operate their hearing aids doubles as a remote microphone when such a need arises. If that remote microphone contains a directional mic, it too can be tested with the Verifit directional microphone test that we have just described. However, the physical setup needs to be a little different.
In Figure 6, you see a handheld remote microphone that is embedded inside a remote control. In this particular remote control, there are two microphone ports - a front-facing and a rear-facing mic port. When you lay this remote control on the table with the top facing the speaker, or if you have the person who is speaking holding it, this orientation should provide some form of a directional advantage.
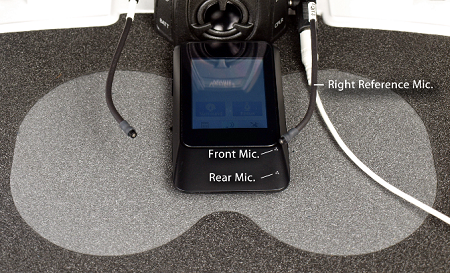
Figure 6. Positioning the remote mic in test box for directional testing of a right hearing aid.
This remote control has been placed in the same location in the Verifit 2 test box where you would normally see the paired coupler/hearing aid assembly located. We have removed that assembly temporarily from the test box and placed the remote control with the remote microphone in that location instead. We have also taken the reference microphone for the right hearing aid measurement and placed it near the front mic port of this directional microphone array. Note the white cable that is coming out of the test box and is off to the right (Figure 6). That is an extension cable which allows one to externally connect this binaural coupler/hearing aid assembly.
With this set up, we can stimulate the remote microphone in the test box with the directional mic stimulus, while measuring the output that stimulus produces in the coupler mic / hearing aid assembly located outside of the test box.
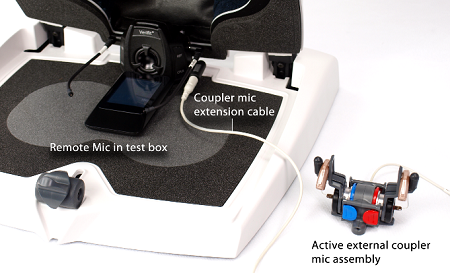
Figure 7. Placement of coupler mic / hearing aid assembly outside of the test box.
The first thing that we are going to show is the remote microphone setup in the surround sound condition, or in its omnidirectional configuration. We close the lid of the box and activate the two signals, one from the front facing speaker and one from the jamming speaker for this right hearing aid. We are measuring the output that is being produced by the hearing aid attached to the coupler microphone outside of the test box for signals received from the remote microphone that is located in the test box. As one would expect, in the omnidirectional condition that we have created, both the front and the rear measurement curves are overlapping, confirming the omnidirectional performance that that configuration should be delivering.
Once we have collected this result, we can go into the test box and shift the settings of the remote mic from surround to focus (which activates the directional microphone capability). We run the test again, and now the directional mic setting is activated, as indicated by the curve separation one would expect to see. It is possible with this test configuration to complete directional mic testing on remote microphone devices that you might be considering for use with your patient.
Directional Measurement Troubleshooting
As a way of helping to ensure that you consistently get solid and accurate test results with your Audioscan equipment, let’s look at some challenging measurements and review some of the reasons these findings may have occurred.
No Curve Separation
Say you have run a directional microphone test and you did not get curve separation the way you expected. Perhaps the two curves are overlapped, but you were expecting that they would be separated. If you get that kind of result, here are some possible reasons.
Intensity. Intensity level can play a role in how a directional microphone activates or whether or not it activates in some cases. Perhaps the intensity level that you are currently using to run the test is not sufficiently high enough to cause the directional microphone to activate, and therefore, all you would need to do is increase that intensity level. In so doing, the front and rear measurement curves may now separate, and you have not only verified that the directional microphone is working, but you have also verified that the hearing instrument’s directional system has level dependency in its design.
SNR. Another reason for absent curve separation is that your SNR may not be appropriate. In the video example we gave earlier, the directional microphone function disengaged when we had a +12 dB SNR coming into the hearing instrument, but it was fully engaged when we had a 0 dB SNR coming into the hearing instrument. If you do not have curve separation but you have a highly positive SNR defined in your input condition, you may want to decrease the SNR and see if you can get the directional microphone result that you expect by changing that ratio between the speech and noise signals.
Incorrect test placement. Another possible reason for not getting curve separation is that you have placed the hearing instruments incorrectly in the test box. For the Verifit Classic, the most common error is that you inadvertently placed the hearing aid in the test box so that the front microphone is not the one closest to the left speaker. Instead, the front microphone of the hearing aid is closest to the right speaker. If you do that, the two curves may indeed be flipped or backwards, or you might not measure anticipated separation between the measurement curves.
If you do not have the hearing aid sitting on that 45-degree angle line in the Verifit Classic test box or if you do not have the hearing aids’ microphones parallel to the floorboard of the test box on the Verifit 2, then the placement of the hearing aids may cause the two measurement curves to come together and you will not see separation. Check the placement of the hearing instruments to make sure they are properly positioned in the test box.
Directional features are not activated. Another reason for a lack of separation between the two simultaneous measurement curves is that the directional feature of the hearing aid has not been activated in the programming software. You might want to check that, and once you turn it on, then the curve separation should become evident.
Troubleshooting the hearing aid. You also can start to troubleshoot the hearing aid if you do not observe the anticipated directional effect during your measurements. For instance, if one or more of the hearing aid mic ports are plugged with dirt or debris, the curve separation may not be as robust as it was expected to be, or there may be no curve separation at all. You may want to clean the microphone ports and/or change the microphone screen cover on the hearing aid (if applicable) and determine whether or not debris is the cause of your problematic directional results.
Directional microphone does not work. The final possible cause for a lack of expected curve separation during the directional test is that the directional microphone simply is not working. Having a test like this and using this sort of analysis can help lead you to the conclusion that perhaps a hearing aid / microphone repair is required.
Curves are Reversed
Another difficult to interpret measurement situation may be where the curves are reversed, (the thick ‘front’ curve is at the lower level and the thin ‘rear’ curve is at the upper level). This could possibly be a result of backwards / reversed hearing aid placement inside the Verifit Classic test box. It is a little harder to place the hearing aid backwards inside the Verifit 2 test box.
To resolve the issue, check to make sure that the microphone orientation of the hearing aids in the test box is correct. If it is and the curves are reversed, the other possibility is that the directional microphone in the hearing aid is incorrectly wired or reverse wired. You might want to make sure that you have this issue is taken care of before you fit the hearing aids performing in this fashion.
Poorer Curve Separation than Initially Benchmarked
When conducting the directional test, perhaps you encounter a situation where there is curve separation, but the curve separation is not as robust or as obvious as when you had tested the hearing instruments earlier on. Baseline directional mic testing is a good thing to collect and save on any hearing instrument before you fit it so that you can benchmark the performance of the directional mic feature. If you later test the hearing instrument’s directional microphone capabilities, you will have something to which you can compare the results.
If the new test shows significantly less curve separation than the original benchmark result, here are some of the possible reasons for that:
- HA placement may be incorrect or different – Make sure that the two microphones are parallel to the floorboard of the test box in a Verifit 2 or sitting on the 45-degree angle line pointing at the left speaker in a Verifit Classic.
- Current coupling may not be equivalent to the original coupling. This possibility may arise particularly if you are using an ITE hearing instrument or trying to do a directional mic test where you have the earmold as part of the test result, and you have puttied the ITE aid or the earmold to an HA-1 styled coupler. The possibility then exists that you have a slit leak in the second test that you did not have in the first test conducted previously. Remove the instrument from the coupler and re-attach it, being careful to seal any vent on both the lateral and medial sides and avoid any slit leaks.
- One or more mic ports are compromised by debris, not to the point where it causes the two measurement curves to come together completely, but instead for the two curves to not separate as significantly as they once did. As discussed previously, to the extent possible consider cleaning any mic ports and/or install new microphone screens on the instrument should they appear to be saturated with dirt or debris.
- Microphone drift – As directional microphone hearing instruments get older, there is the potential for asymmetrical drift in the sensitivity of the two omnidirectional microphones. This poor curve separation at some later point in the use life of the hearing aid may be a documentation of microphone drift.
Real-Ear Directionality Test
The previously described Audioscan directional mic test can also be performed while the hearing instruments are worn on the ear. In Figure 8, you can see the front signal speaker for an on-ear test, which the patient is facing (i.e., 0-degree azimuth sound location). The second speaker which is plugged into the back of the Verifit unit is placed behind the patient’s head (i.e., 180 degrees azimuth sound location) and becomes the jamming speaker. The microphone that is being used for this measurement is the probe tube microphone located in either the right or left ear of the patient wearing the hearing aid equipped with the directional microphone.
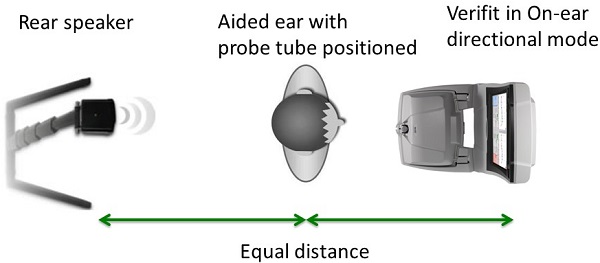
Figure 8. Setup for a directionality test using real-ear measurement.
One of the advantages of the on-ear directional microphone test versus the test box directional test is that while the measurement is being run in its active phase, you can move the rear speaker around the back of the patient’s head, and you can either find the null location directly by that movement or evaluate whether or not the null of the directional system moves as you move the speaker. (In other words, determine if the curve separation seems to be maintained as the jamming speaker angle changes.) You cannot assess this aspect of directional performance in the test box as the two speakers are affixed to the test box. There are other advantages to conducting on-ear directional measurements, including but not limited to ability to assess the impact of venting and microphone orientation on the directional effect of the hearing aid in an as-worn position on the client as described below.
Considerations for On-Ear Directional Mic Testing
There are some additional considerations that you will need to think about when you engage in doing directional mic testing using on-ear probe microphone measurements versus the test box approach.
Venting
The first and perhaps most obvious consideration with on-ear directional testing is the impact of venting. Directivity is something that can happen across the frequency spectrum, but might be influenced by the vent, particularly in the lower frequencies. This effect is likely due to the fact that the lower frequency sounds are passing through the vent in both directions. Direct sounds that are not being influenced by the directional microphone are reaching the probe mic via the vent, and some of the low frequency directivity is leaking out of the vent prior to being measured at the probe mic.
To give you an illustration of the potential effects of venting are on a directional mic test, here are two test results (Figure 9). The first test result was obtained by putting a probe tube in a patient’s ear and affixing a receiver-in-the-canal (RIC) directional hearing aid with an occluding dome to that patient’s ear.
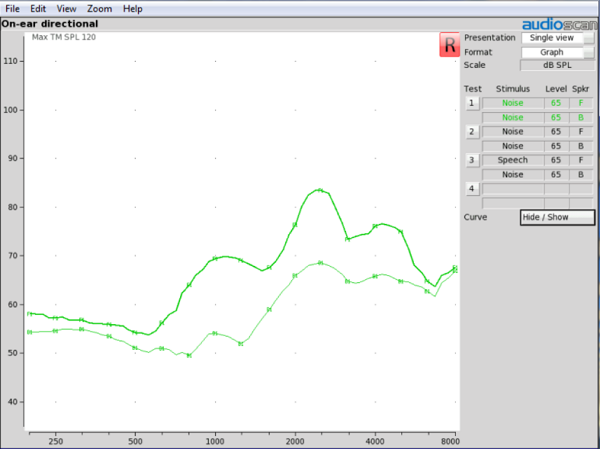
Figure 9. On-ear results of a RIC with a closed power dome.
Under the described measurement condition in the Noise + Noise directional test, we get clear separation between the 2 measurement curves indicating directional function for for the entire frequency range.
The next test, displayed in Figure 10, shows the same RIC hearing instrument, programmed with the same settings and measured on the same patient, but in this case we are using an open dome rather than a closed dome. The green curves on the figure are from the original test with the closed dome, to be used here as a reference.
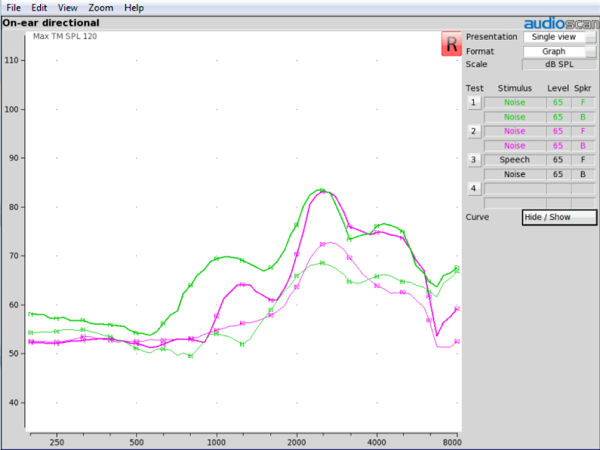
Figure 10. On-ear results of a RIC with an open dome.
If we focus on the purple curves in the figure obtained with the open dome coupling, you can now observe a lack of curve separation in the lower frequencies, in contrast to the previous closed dome measurement. At 1000 Hz, the directivity is much less than it was with the closed dome. At 2000 Hz, it was less than it was with the closed dome, and at 4000 Hz, there is an indication that it may be essentially equivalent. Overall, we see a trend that indicates a lack of measurable directivity in the low frequency region due to the increased venting present in the open dome condition, along with confirmation that a directional effect is still present in the higher frequency region.
This measurement result is very consistent with the findings obtained by Ricketts (2000), where he examined the effects on venting on the directivity index. The study determined that as the vent size is increased to an open condition, we see a significant loss of directivity in the 500 Hz frequency region, consistent with the results shown in Figure 10. Results also showed a trend for reduction of directivity at 1000 Hz, as well as a modest reduction at 2000 Hz, and a slight increase at 4000 Hz.
We can conclude, based on both the data shown here and Todd Ricketts’ data, that venting impacts directional functionality, particularly in the lower frequencies from 500 Hz to 1000 Hz. The largest effect of this venting impact is going to be seen in open mold conditions. However, even in the open mold condition, we still have directionality that is reaching the patient’s ear. There is still an advantage of using the directional microphone even in an open fitting condition, as long as that directional microphone is providing a directional advantage in the frequencies that are not being affected by the vent. In the middle and higher frequencies, directional functionality is still reaching the patient’s ear and still providing benefit to the patient. This is one of the reasons why a broadband, or multi-frequency directional test (like the test administered by a Verifit system) can be particularly useful.
Microphone Port Orientation
The next consideration one must think about when doing directional mic measures on ear is hearing aid mic port orientation. As you now understand, keeping the two hearing aid mic ports on the proper angle relative to the speakers in the test box is very important. However, if you are doing an on-ear test, microphone orientation is still important.
If you are fitting a custom product, manufacturers have made an effort through modeling of various anatomical characteristics of the ear impression to horizontally position the front and rear mic ports so as to maximize the likelihood of a directional effect when the hearing instrument is worn. However, some anatomical situations may make achieving horizontal microphone positioning more difficult.
When it comes to BTE or RIC products, the horizontal positioning of the front and rear microphone ports is, to some extent, under your control. For instance, in the case of a conventional BTE, the length of the tubing that you use on the ear mold will influence how that hearing instrument sits behind that patient’s ear and whether or not that final resting place is creating the horizontal microphone port positioning that you desire.
If you are using a RIC product, then the wire length of the receiver is going to play a role in determining whether or not the final resting position of that instrument is ideal in terms of horizontal microphone port positioning. If you are using a thin tube product, the selected thin tube length can also be an element that you can manipulate to try to achieve ideal mic port orientation.
Ricketts (2000) has provided us with some nomenclature to help define microphone orientation to achieve ideal positioning for directional microphone utility when the patient is wearing this hearing instrument.
If the tubing is not correctly sized (i.e., overly long) and the hearing instrument is resting far down behind the pinna, Ricketts (2000) defines the orientation with a negative degree number. Conversely, an overly short tubing length which might lead to a hearing instrument resting forward toward the front of the ear would be defined by a positive number. Once he created this nomenclature for documenting the position of the two mic ports relative to each other, directional measurements were conducted, both in ITE and BTE conditions at different frequencies, 500 Hz, 1000 Hz, 2000 Hz, and 4000 Hz. He wanted to determine the impact of microphone orientation on the directivity index.
Results indicated that for an ITE, up to a -20 orientation will have approximately less than a 1 dB impact on the directivity index for the frequencies 500 Hz and 2000 Hz in particular. For BTEs, as the angle of the two mic ports deviates from the desired horizontal location, particularly if the rear mic port is lower than the front mic port, performance of the directional microphone will be impacted, particularly in the higher frequencies.
We can see this sort of microphone orientation effect on directional test results with the Verifit, both on-ear and in the test box. For instance, figure 11 shows a result we obtained measuring a directional microphone hearing aid in the Verifit 2 test chamber with the two hearing aid microphone ports horizontal to the floorboard of the test box. You can see clear curve separation between the 2 green measurement curves across a wide range of frequencies.
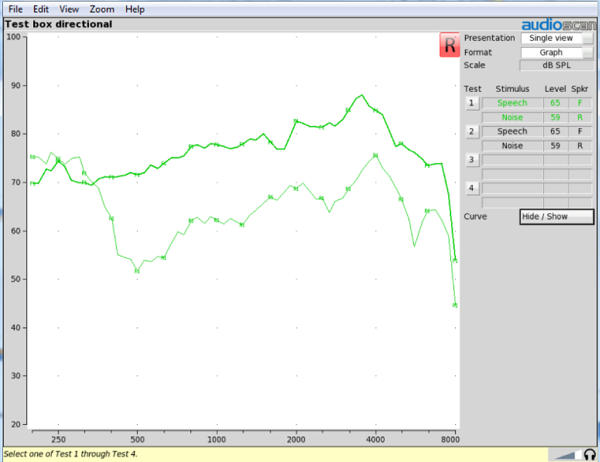
Figure 11. Directional test in the test box with horizontal mic port placement.
In Figure 12, we simply rotated the hearing aid in the test box such that the rear mic port was 22 degrees below the front mic port. Even in the test box, that adjustment to microphone port orientation had a substantial impact on curve separation in these critical frequency regions as shown in the purple curves. As you can see, you can easily simulate these microphone orientation considerations in a test box.
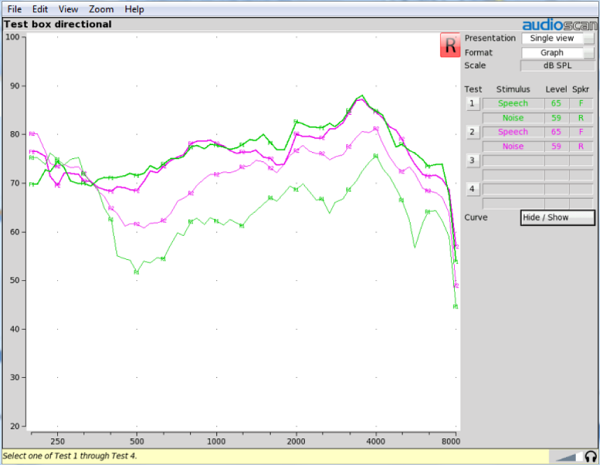
Figure 12 Directional test in the test box with -22 degree mic port placement.
Summary
Based on the information contained in this course, we should be able to conclude the following. First, it appears clear that directional microphones remain the most effective approach to improving SNR on head-worn hearing instrument devices today. Through the use of remote microphones that are also intended to improve the SNR, a directional microphone advantage can also be measured with the technology demonstrated in this course.
Second, through the use of Audioscan’s unique real-time two-input signal measurement capability, a clinician can capture a great deal of useful information about the functionality of a directional microphone hearing instrument. This information includes verifying that the directional microphone is working, verifying the activation of automatic features like adaptive directionality, along with the presence of level dependency and/or SNR dependency on the directional result. In addition, the system allows one to accurately and efficiently verify directional microphone effects across the frequency spectrum as opposed to a single pure-tone frequency, verify the directional microphone effects in a multiple-input environment (which is helpful for testing signal in noise advantages), and verify directional microphone effects while compression is still on. This is not something that can be easily done with any other test procedure.
Third, because of careful and controlled hearing aid orientation and input signal conditions, the test box directional test is both a very stable and very robust clinical measurement of directional microphone capability.
Fourth, this robust clinical measurement can also be done on-ear using a probe microphone rather than a coupler microphone. However, one must recognize the impact of unique on-ear considerations such as venting and hearing aid mic port orientation which can influence the results when compared to test box measures.
We hope that this directional microphone measurement course has enabled Audioscan equipment owners to utilize their device with greater skill and enthusiasm. In addition, we hope you will embrace this directional microphone test capability as a tool that can and should be used routinely in enhancing the effectiveness of your fittings.
References
Dillon, H. (2006, April). Hearing aid technology & the future. Presentation at the Acoustical Society of American conference. Honolulu, HI.
Fabry, D. (2005). Adaptive directional microphone technology and hearing aids: Theoretical and clinical implications. Hearing Review.
Killion, M.C., Schulien, R., Christensen, L., Fabry, D., & Revit, L. (1998). Real world performance of an ITE directional microphone. Hearing Journal, 51(4), 24-38.
Kochkin, S. (2003). On the issue of value: Hearing aid benefit, price, satisfaction, and brand repurchase rates. Hearing Review, 10(2),12-26.
Lybarger, S.F. & Lybarger, E.H. (2000). A historical overview. In R. Sandlin (Ed.), Textbook of hearing aid amplification: Technical and clinical considerations, 2nd edition. San Diego, California: Singular Thomson Learning.
Ricketts, T. (2000). Directivity quantification in hearing aids: fitting & measurement effects. Ear and Hearing, 21(1), 45-58.
Cite this Content as:
Smriga, D. (2015, October). The Verifit directional mic test: Evaluating modern directional microphone technologies. AudiologyOnline, Article 15371. Retrieved from https://www.audiologyonline.com