Learning Outcomes
After this course, learners will be able to:
- Describe the results of several surveys regarding hearing aid use and acceptance.
- Describe the relationship between level of technology and real-world hearing aid benefit.
- Describe how patient-centered care can be enhanced through the use of self assessment inventories.
- Describe how speech-in-noise and LDL testing can influence the hearing aid fitting.
- Describe the method to verify a validated prescription fitting algorithm using probe-mic measures.
V3.1: What are Hearing Aid Users Telling Us?
In this volume of Research QuickTakes, we’ll take a close look at what is driving benefit and satisfaction with hearing aids, and then dissect the everyday fitting and follow-up process, looking for areas where improvement might be possible. In this first section, we’ll examine some retrospective studies, which will help identify key areas that are driving hearing aid adoption, acceptance, benefit and satisfaction.
Written Reviews from HearingTracker
HearingTracker.com is a consumer website where hearing aid users have the option to write reviews regarding specific products, or comment on the use of hearing aids in general. The study we’ll review here was a retrospective design examining the data generated from 1378 online reviews during the period 2013 to 2019 (Bennett et al, 2021; Manchaiah et al, 2021). The research included a total of 1378 online hearing aid reviews. Of these, 1274 (92.5%) of the consumers indicated owning bilateral hearing aids. The respondents indicated having between 0 and 10 years of experience using hearing aids (mean 4.8; SD 4.1). Over two-thirds indicated that they owned hearing aid models classified as the highest level of technology. The majority appeared satisfied with their hearing aids, with 36.5% and 43.1% self-reporting “Very Good” or “Good” respectively—this total of ~80% overall satisfaction is consistent with past findings from MarkeTrak (Carr, 2021).
Qualitative data (open text responses) were analyzed using automated topic modeling software to identify themes, domains and clusters. Two domains were identified: Device Acquisition and Device Use. Each domain had three clusters. For Device Acquisition (52.7% of all responses) the clusters were: Finding the right provider, Device and price-point; Selecting a hearing aid to suit the hearing loss; and, Attaining physical fit and device management skills (see Figure 1).
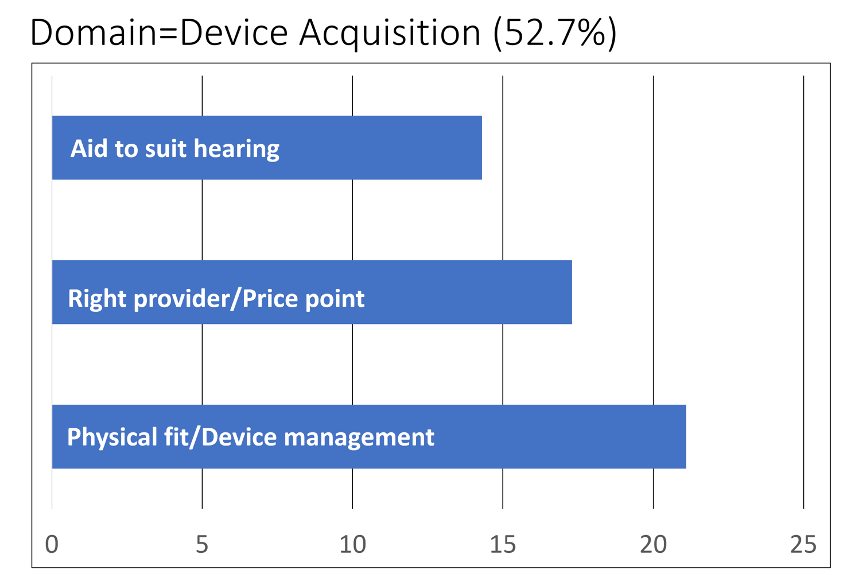
Figure 1. Three clusters identified for the domain of Device Acquisition (adapted from Bennett et al, 2021).
The domain Device Use (47.3% of all responses) also included three clusters: Smartphone streaming to hearing aids; Hearing aid adjustment using smartphone; and Hearing in noise (see Figure 2).
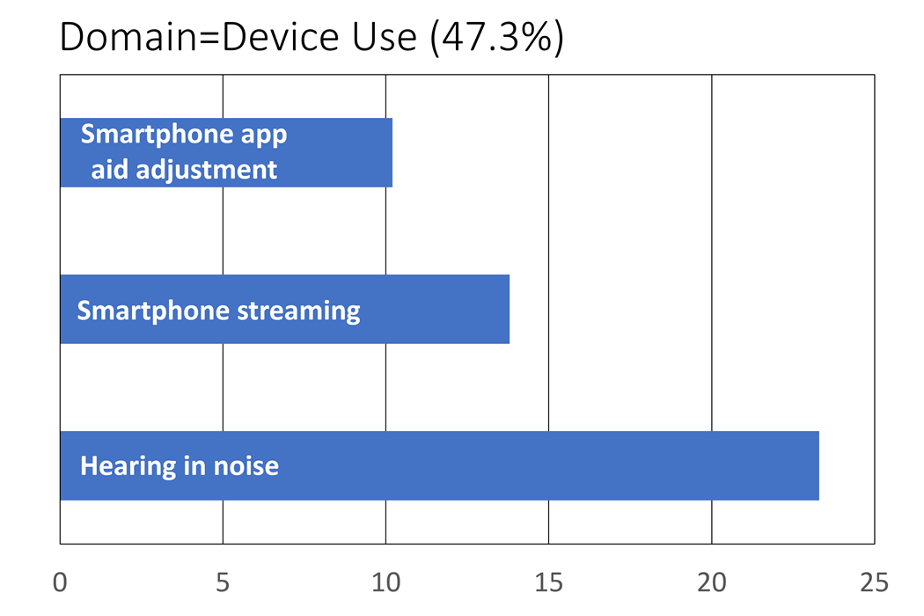
Figure 2. Three clusters identified for the domain of Device Use (adapted from Bennett et al, 2021).
For each cluster, the software analysis of the written responses identified key words that appeared frequently. Some of the most commonly used words by the consumers in their reviews for the six different clusters are shown below.
- Right provider, device and price point: cost, Costco, return, price, warranty, service.
- Hearing aid to suit hearing loss: loss, year, previous, severe, improvement.
- Physical fit and device management: ear, battery, dome, life, rechargeable, canal.
- Smartphone streaming: phone, call, stream, Bluetooth, connect, music.
- Adjustment using smartphone: app, control, volume, remote, reboot, treble.
- Hearing in background noise: noisy, noise, conversation, restaurant, loud, understand.
Note that one of the clusters relates to device use and management (22% of all responses).
The authors discuss this relative to earlier research that has been conducted in this area (Bennett et al, 2018). This was a previous study where hearing aid owners and clinicians identified unique items describing the knowledge and skills required for hearing aid management. They found that there were six themes: (1) Daily Hearing Aid Use; (2) Hearing Aid Maintenance and Repairs; (3) Learning to Come to Terms with Hearing Aids; (4) Communication Strategies; (5) Working with Your Clinician and (6) Advanced Hearing Aid Knowledge. Hearing aid users considered these six items to be equally important, suggesting that hearing care providers (HCPs) need to take a patient-centered approach to deliver hearing aid related services, to ensure that each patient has received appropriate guidance and training.
Comparing Adherents vs. Non-Adherents
Previous research has suggested that factors which will positively influence older adults’ decision to try hearing aids include: perceived hearing difficulties, positive attitudes toward hearing aids, support from significant others, and increasing age. The focus of a recent study was on the differences between older adults who complied with a clinical recommendation for hearing-aid acquisition (adherents) and those who did not (non-adherents) (Humes, 2021). All participants were first-time hearing aid users and volunteers for a larger research study.
Following the complete audiologic evaluation, prior to hearing aid use, a series of unaided measures were completed: sound-field speech-in-noise testing, acceptable noise level (ANL), the Communication Profile of Hearing Impairment (CPHI), the Expected Consequences of Hearing Aid Ownership (ECHO), and an abbreviated version of the Glasgow Hearing Aid Benefit Profile (GHABP). At 1-month post-fitting, the participants completed several outcome measures: Hearing Aid Performance Inventory (HAPI), the Satisfaction with Amplification in Daily Life (SADL) the GHABP, and a satisfaction survey based on MarkeTrak. They also received (unaided and aided) the Connected Speech Test (CST).
At the end of the last session (one month post-fitting), participants were asked if they wanted to keep their hearing aids or return them for a full refund. Of the 105 new users, 84 chose to keep their hearing aids. So, how did the adherents (80%) differ from the 20% of non-adherents?
- There were no significant differences between the adherents and non-adherents for education level, income level, or duration of hearing loss.
- There was no difference between groups for the unaided ANL or for speech recognition in noise (CST; unaided and aided).
- The adherents had greater hearing loss.
- For the ECHO, non-adherents showed lower expectations for hearing aids. For the CPHI, non-adherents reported better communication performance and better adjustment to hearing problems, but also had significantly poorer awareness of communication-performance problems, poorer use of verbal and nonverbal communication strategies, and more denial of communication difficulties.
- And not surprisingly, for the GHABP, HAPI and SADL, adherents reported significantly more benefit and satisfaction.
The author mentions that the differences noted between the two groups must be tempered by the small number of participants who rejected their devices, and the fact that all outcomes were obtained at only one month post-fitting. Humes (2021) goes on to say, however, that previous work from their research group suggests that similar performance on outcome measures would have been observed over a post-fitting period of up to 2 years (Humes et al, 2004).
One of the findings from this retrospective study (Humes, 2021), which was fairly predictable was that the adherents had more hearing loss. Previous work from this research group, however, has shown that the audiogram only is a partial indication of hearing aid uptake and benefit (Humes, 2020). As part of a larger study, these researchers compared each participant’s classification of degree of hearing loss, i.e., normal, mild or moderate (based on the World Health Organization Hearing Impairment [WHO-HI] grade) to their self-reported unaided and aided scores on the Hearing Handicap Inventory for the Elderly (HHIE). This comparison was conducted for a large group (n=194) who had been fitted bilaterally with hearing aids based on best practice (e.g., verified NAL-NL2 fitting). The results are displayed in Figure 3.
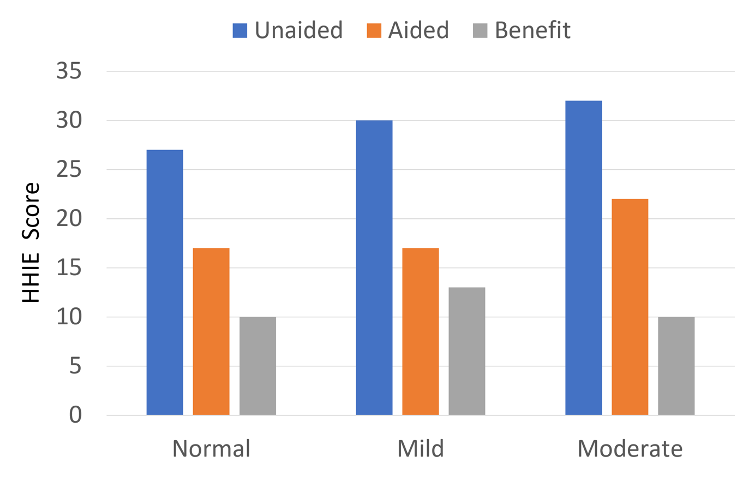
Figure 3. Shown are HHIE findings for three groups varying in their WHO-HI classification of degree of hearing loss (adapted from Humes, 2020).
As shown in Figure 3, as expected, there was a slight increase (more handicap) as the hearing loss became worse. What stands out, however, is that the benefit from hearing aid use based on the HHIE self-report was no greater for the individuals classified as having as “moderate” hearing loss by the WHO-HI, than those who were classified as “normal hearing.” This reinforces the importance of including self-assessment measures, such as the HHIE as part of the routine hearing aid fitting process.
Beaver Dam Offspring Study
A final hearing aid retrospective study that we’ll discuss is related to the much-referenced landmark population-based Epidemiology of Hearing Loss Study of 1993-1995, designed to measure the prevalence of hearing loss in adults aged 48-92 years, residing in Beaver Dam, Wisconsin—often simply referred to as the Beaver Dam study. Of the 4,541 eligible people, 3,753 (82.6%) participated, with the average age of 65.8 years (57.7% were women).
The Beaver Dam Offspring Study (Weycker et al, 2021) was research to investigate hearing, vision, and olfaction in the children of the participants in the original Beaver Dam study. The purpose was to measure the 10-year incidence of hearing aid adoption in a sample of primarily middle-age adults with high-frequency hearing loss, and identify factors associated with hearing aid adoption. This second study included 579 adults (ages 34–80 years) who all had a high-frequency pure-tone average >25 dB HL (3–8 kHz). Most participants (75%) were aged between 45 and 65 years. In addition to hearing threshold testing, word recognition measures in both quiet and in background noise were conducted for all participants.
The number of individuals who adopted hearing aids within the 10-year period was 69. The mean high-frequency PTA for this group was 41.3 dB. Factors significantly associated with adoption using a multivariable model included: higher education, worse high-frequency pure-tone average, self-reported hearing handicap (screening versions of the HHIE, a self-report measure discussed earlier), the use of closed captioning, and answering “yes” to the question “Do friends and relatives think you have a hearing problem?” It is interesting to note, that while self-report of hearing handicap was significantly associated with hearing aid adoption, self-report of hearing loss was not. Unlike some other similar studies, clinical word recognition measures in background noise were not significantly associated, perhaps because the hearing losses were relatively mild. Effects of age and sex also were not significant.
The authors suggest that If hearing health care providers have a better idea of factors related to hearing aid adoption and readiness among patients for hearing aid adoption, they can provide timely and appropriate targeted intervention.
V3.2: Does the Level of Technology Matter?
Speaking of “targeted intervention,” when hearing aids are selected, the level of technology is usually a topic to be considered. It’s meaningful to take a look at the research which has studied the relationship between the technology of the instruments (processing and algorithms) and the benefit that subsequently is obtained by the patient. It would seem reasonable that the products loaded with all the latest technical advances would also provide the most benefit, but do we know this to be true? And what about features that are not specifically processing related, such as form factor, streaming, user adjustability and rechargeability?
A Bit of History
As recent as the early 1980s, most manufacturers had hearing aid models that differed in gain and maximum power, but other than that, the portfolio was fairly similar. As the years passed, we started to see more unique features introduced, more aggressive marketing surrounding these features, and a layering of products within a company, which then encouraged researchers to carefully examine if these marketing claims were all true. Was there really a good, better, best? Early research focused on three different features.
Wide dynamic range compression (WDRC). Fueled by the development of the K-Amp, hearing aid processing that received considerable scrutiny in the early 1990s was WDRC. Although input-controlled automatic gain control (AGCi) hearing aids had been available for decades, kneepoints in the 40-50 dB SPL range were something new, and certainly much different than the traditional linear fittings used by most. Research comparing WDRC to linear processing for speech understanding was launched at several independent sites. The results of course, which are well known today, were that WDRC will improve audibility (and intelligibility) for soft inputs, and will do no worse than linear for average and loud inputs. Today, it is difficult to find a hearing aid that is not WDRC (or at least can be programmed as such), and it usually is not possible to meet prescriptive targets for soft, average and loud inputs for the NAL-NL2 or the DSLv5.0 without the use of WDRC.
Number of channels. Multichannel products also were a hot topic in the 1990s. How many channels were enough? Were two better than one? Three better than two? Bragging rights among manufacturers were important. This was when we first started seeing different technology levels of products within a given manufacturer, most notably differentiating by the number of channels: 1 channel=entry-level, 2 channels=mid-level, and 3 channels=premier. Several studies during this period suggested that for the purposes of shaping the frequency response, restoring audibility and optimizing speech recognition, something around 8 channels would be adequate. Today, however, it is common to have hearing aids with 20, 30, 40 or more (overlapping) channels. And of course, just to make things confusing, there currently is a product on the market advertised as “channel free,” whatever that means.
Digital processing. The introduction of digital hearing aids in the late 1990s was the next feature to prompt strong promotional claims, from both manufacturers and hearing care providers (HCPs), which in turn encouraged researchers to initiate clinical studies to determine if these new digital products truly were superior. Perhaps the most notable project was from the University of Iowa, where Ruth Bentler’s team not only compared the new digital products to comparative analog devices, but also to a body aid and a speaking tube (Bentler and Duve, 2000). Like our discussion of channels, the “is-digital-better” issue soon became moot, as all manufactures had digital products, and very quickly phased out the analog devices.
Levels of Technology
As hearing aid technology progressed in the 2000s, it was common for most all manufactures to offer different “levels” of the same product, each higher level having more advanced technology (and a greater price tag). HCPs then followed this lead, and laid out their products, also differing significantly in price, based on the level of technology, much like mattresses are sold. This approach has been ripe for research, and especially of interest to an organization such as the Department of Veteran’s Affairs (VA), who spend millions of dollars on hearing aids each month, which led to the VA-funded research on this topic conducted by Robyn Cox and colleagues (Cox et al, 2014).
Basic and premier products were compared from two different manufacturers. All four products were fitted to NAL-NL2 targets, and the participants used the products in the real world for one month. The premier model had more channels (e.g., 16 vs. 8) and more levels of noise reduction. All models from both manufacturers had adaptive directional processing. The participants received speech-in-noise testing, completed four different self-assessment scales following the real-world experience, and also maintained a diary, noting positive and negative experiences with the products.
The results of the speech-in-noise recognition testing are shown in Figure 4. Note that there is no difference between manufacturers or levels of technology—not too surprising, given that all four products had, more or less, the same directional technology (and were programmed to the same NAL-NL2 prescription).
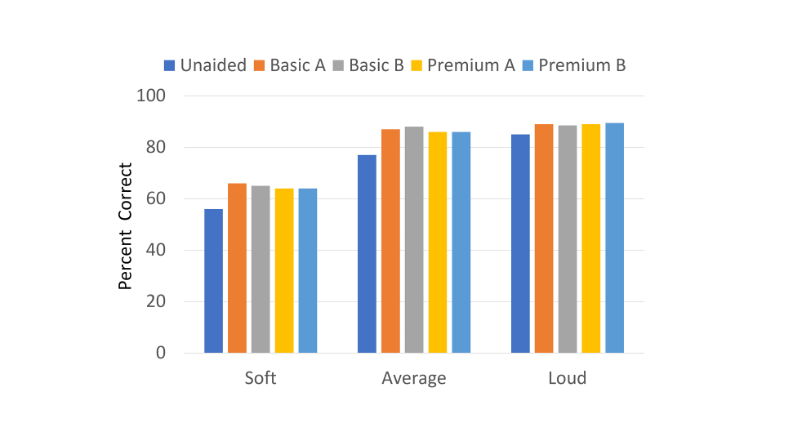
Figure 4. Results of the speech recognition testing for Basic and Premier products for three different input levels.
But what about the real world? Did differences emerge? The results for the abbreviated profile of hearing aid benefit (APHAB) are shown in Figure 5. As with the speech recognition findings, observe the remarkably similar results for all four products. Similar findings also were observed for the other self-assessment inventories, even for the DOSO, a scale specifically designed to detect device differences. One significant finding, indirectly related to the purpose of the study, was that for all four products on the Hearing Quality of Life Scale, the average rating was “A Good Deal Better.” To this point, there had been surprisingly little peer-reviewed documentation that the use of hearing aids does indeed improve the users quality of life.
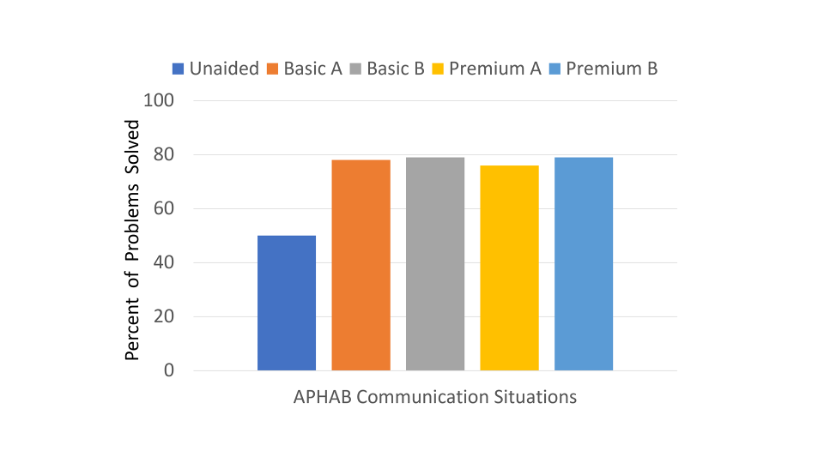
Figure 5. Results for the APHAB real-world ratings for the Basic model compared to the Premier from two different manufacturers (A and B). (Adapted from Cox, 2014).
Follow-up Research
Hearing aid technology, of course, is always changing. What was the premier model in the year 2014, might be the basic product five years later. For that reason, we have seen several basic vs. premium studies since the original work from Robyn Cox’s lab. One well-designed comparative study was from the University of Iowa (Wu et al, 2019). Participants were 54 older adults fitted bilaterally with basic and premium products. Clinical testing was conducted for both models with noise reduction and directionality turned on and also turned off (total of four conditions). For each condition, participants wore the hearing for 5 weeks. Outcome measures included speech understanding, listening effort, sound quality, localization and satisfaction. Unique to this study was that real-world reports included ecological momentary assessment (EMA), and also completion of smartphone-delivered surveys.
The findings of the study are displayed in Figure 6 (upper and lower panel), and summarized as follows:
- In general, in laboratory testing, Features-On was better than Features-Off, and for speech understanding, Premium was better than Basic.
- In the real world, for nearly all measures, Features-On was better than Features-Off, but Premium was rated the same as Basic.
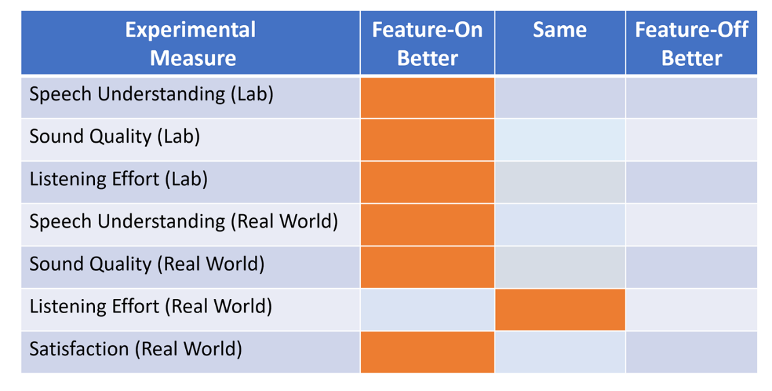
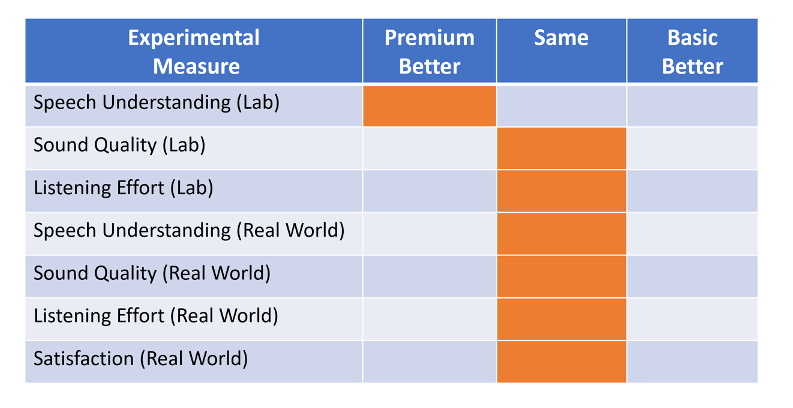
Figure 6. Summary of laboratory and real-world outcome measures. Orange shading indicates outcome for a given metric. Top panel: Results when Feature-On was compared to Feature-Off. Bottom panel: Results when the premium model was compared to the basic model (Adapted from Wu et al, 2019).
The authors conclude that the differences between Premium and Basic may be too subtle for older hearing-impaired adults to detect in real-world listening.
More Recent Findings
The level-of-technology comparative research continues. In 2021, researchers from the University of Tennessee published work where they compared basic to premier in two different studies, one with experienced users, and the other with new users of hearing aids (Hausladen et al, 2021; Plyler et al, 2021). The outcome measures obtained from the participants were similar for both studies, and included: acceptable noise level (ANL) test, speech recognition in noise (QuickSIN and HINT), listening environment demands via data logging, the self-report Speech, Spatial and Qualities (SSQ-12) questionnaire, and listener preference.
In general, the results were similar for both groups. Differences observed, however, in both studies were that the individuals who preferred premium had a larger (worse) ANL, and spent more time in speech-in-noise listening situations. There also was a preference for premium in both studies, but it was the greatest (74% of participants) for the new hearing aid users.
One finding from the experienced user’s study, not discussed by the authors, but displayed in their data, was the difference in QuickSIN scores for those who preferred premium vs. those who preferred basic technology. Shown in Figure 7 are the mean QuickSIN scores for the two different groups when they were tested with both the premium and the basic instruments. Observe that in both cases, there is a sizeable difference (~4-5 dB) in the SNR—that is, on average, individuals who preferred premium had substantially poorer performance understanding speech in background noise. One interpretation of this, is that the advanced processing of the premium product helped move the SNR to a more favorable level, which enabled them to at least “get by” in some difficult listening situations.
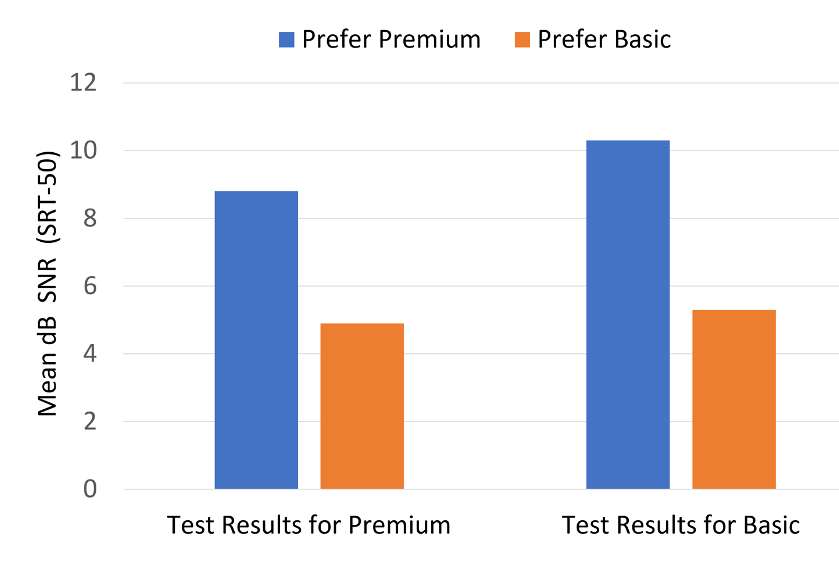
Figure 7. Displayed are the mean SNR values for the individuals preferring premium compared to those preferring basic. QuickSIN results are shown for testing that was completed while fitted with both the premium and basic models (based on data from Plyler et al, 2021).
A Different Look at Technology Levels
The final study related to hearing aid technology levels that we’ll discuss, is the recent research from Western University (Saleh et al, 2021). One important factor that has changed since the early levels-of-technology research, is that today, for many manufacturers, the signal processing (directional technology, noise reduction, signal classification, etc) is very similar for the basic model and for the premium device. So much so, that there is little reason to experimentally compare them. Rather, what separates the technology levels (and price points) tends to be features such as rechargeability, streaming, smartphone adjustments, and other user-comfort applications. That was exactly what was studied the Western University comparative research.
In a single-blinded crossover trial, aided behavioral outcomes that were measured were loudness ratings, speech recognition (sentences and syllables), and speech quality. Preference between hearing aids was assessed with a 7-point Likert scale. Group concept mapping was utilized to investigate preference results. Participants generated statements based on what influenced their preferences, which were then sorted into themes that were then rated for degree of importance on a 1-5 scale.
The results of the laboratory testing, much like previous research, found no difference between premium and basic technology for sentence recognition in noise, consonant recognition in noise, loudness ratings, or speech quality. Regarding the participants comments following real-world use, the findings revealed a total of nine distinct clusters: sound quality and intelligibility, comfort and appearance, ease of use, user control, complex factors, streaming, convenience and connectivity, acoustic feedback, and multi-environment functionality.
Following the field trial with both devices, only 17% of the participants preferred the basic technology. Not only did the majority favor the premium hearing aids, but 52% had a rating of “strong preference” (on a 7-point scale). Perhaps not surprisingly, the clusters that were rated the highest for both groups were sound quality and intelligibility, comfort and appearance, and ease of use. Clusters that differed significantly in their importance rating between groups (i.e., rated considerably higher for the “prefer premium” group) were:
- Having access to smartphone application-based user-controlled settings.
- The ability to stream calls and music.
- Convenience features such as accessory compatibility.
These research findings support what already is known by many HCPs. While providing optimum understanding for speech, and high-fidelity sound quality remain the most important factors when selecting hearing aids, for the most part this can be achieved with today’s entry or mid-level products. The premium models, however, provide many other features, which a large percent of hearing aid users rate as important.
V3.3: A Patient-Centered Approach
We’ve taken a look at what hearing aid users are telling us, and also have examined the importance of hearing aid features, and how they might drive satisfaction. Recall that the Western University (Ontario, Canada) group, used a unique approach, group concept mapping, to investigate hearing aid preferences (Saleh et al, 2021). To review, participants generated statements based on what influenced their preferences, which were then sorted into themes that were rated for degree of importance on a 1-5 scale. What emerged was nine distinct clusters. Regardless of the participant’s hearing aid preference (Premier vs. Basic), however, the three clusters that were rated the highest were sound quality and intelligibility, comfort and appearance, and ease of use. The #1 factor, sound quality and intelligibility, will be the focus of the remaining sections of this paper.
Guidelines and Standards
Our theme for this entire volume has been “Getting it right.” How do we do this? Fortunately, we have had considerable help in this area over the years, as several groups and organizations have provided hearing aid fitting guidelines. Starting about 30 years ago, and presented in roughly chronological order, we have had guidelines from the Vanderbilt/VA Consensus, the Independent Hearing Aid Fitting Forum (IHAFF), the ASHA, the AAA, the International Society of Audiology, and many other country-specific documents. So while we have had many guidelines, we did not have a standard—that was, until 2021. The Audiology Practice Standards Organization (APSO) published the first hearing aid fitting standard (for adults) in the summer of 2021. For those of you not familiar with this standard, we have included a copy at the end of this article.
You might ask, what is the difference between guidelines and a standard? This is a common question, which was answered by audiologist John Coverstone in a recent article (Mueller et al, 2021):
“A guideline is a document that describes how (that’s a key word) a procedure may be performed—often with multiple options . . . A guideline “guides” clinicians in how they should perform procedures. A clinical standard, on the other hand, is more of a what document. Standards guide us as to what we should be doing with a specific patient in a specific circumstance. We label them a standard because we expect all providers to come to the same conclusion given a specific set of criteria . . . Standards don’t address best outcomes; they address minimum acceptable practices.”
We think that that all makes good sense. “Minimal acceptable practices” seems to be a reasonable and achievable goal, and we’ll discuss some of the specific items of the standard which are particularly critical for an effective hearing aid fitting.
Patient-Centered Care
Item #2 of the APSO standard states in part: Patient-centered and family-centered care is provided. The patient is encouraged to include communication partners (e.g., family members, significant others, companions) throughout the selection, fitting, and follow-up process.
A reasonable question would be, isn’t patient care always patient-centered care? Some might say, maybe not. Or, maybe we could make it more patient-centered. The Institute of Medicine defines patient-centered care as: Providing care that is respectful of, and responsive to, individual patient preferences, needs and values, and ensuring that patient values guide all clinical decisions, requiring a true partnership between individuals and their healthcare providers.
A recent article reviewed factors surrounding patient-centered, or, the term used in the article, person-centered care (Vonberg, 2022). As reported, several studies related to hearing aids consistently have concluded that patient focus is critical. In one survey, many consumers buying hearing aids viewed the health care provider’s manner of communication and engagement as at least as important as their ability to test hearing and fit hearing devices. Consider the typical hearing aid selection process, where we need to employ consideration of the individual’s needs and preferences, effective communication, along with joint decision-making.
Research has shown that attention to patient-centered care improves trust, increases satisfaction and improves health outcomes and quality of life. While there has been a strong focus on patient-centered care in medicine in general for the past decade or so, the emergence of internet sales, OTC and DTC hearing aids has sparked increased interest in this practice among HCPs. That is, what do we have to offer for the patient who walks in the door already owning hearing aids?
Regardless of the patient’s hearing aid history, or where they purchased their hearing aids, for effective patient-centered care it’s important to collect background information prior to approaching the hearing and selection, fitting, and/or adjustment and counseling process. While this information-gathering can be conducted informally, it is much more effective when validated pre-fitting self-assessment intake scales are used. There are many available, and they have been summarized extensively in audiology textbooks (e.g., Mueller et al, 2014; Ricketts et al, 2019). We’ll provide our three favorites here, which cover different hearing-related domains, and are easy to administer and score.
Hearing Handicap Inventory for the Elderly/Adults (HHIE/A)
Perhaps the oldest and most well-known self-assessment scale related to the pre-fitting of hearing aids is the HHIE. As the name suggests, this scale assesses handicap—specifically related to the emotional and social aspects of having a hearing loss. There have been some modifications to the HHIE scale over the years:
- HHIE: The original 25-item questionnaire. Designed for the “elderly”—people 65 and older.
- HHIE-S: S=Screening. A modification of the HHIE containing only 10 items.
- HHIA: A=Adult. A 25-item of the HHIE for individuals younger than 65 years.
- HHIA-S: S=Screening. A modification of the HHIA containing only 10 items.
Research has shown the shortened versions have comparable reliability and validity with the longer 25-item version, with an adequate internal consistency. For clinical use, therefore, we recommend the 10-item versions of both the HHIE and the HHIA. If we look at the two different 10-item versions, there are only two items that are different between the elderly and adult scales:
Question #3
- HHIE: Do you have difficulty understanding when someone speaks in a whisper?
- HHIA: Does a hearing problem cause you difficulty hearing/understanding coworkers, clients, or customers?
Question #6
- HHIE: Does a hearing problem cause you to attend religious services less often than you would like?
- HHIA: Does a hearing problem cause you problems in the movies or theater?
As illustrated by these items from the scales, the 65-year age cut-off between the two scales is arbitrary, depending on lifestyle. One feature of the HHIE that has contributed to its popularity is that it is very easy to administer and score. It is recommended that it be delivered face-to-face to help prevent patients from skipping questions because of the belief it is not applicable to them. In this regard, the instructions also state, “Do not skip a question if you avoid a situation because of your hearing loss.” For each of the 10 questions of the HHIE/A-S, the patient has the choice of three answers:
- Yes (scored 4 points)
- Sometimes (scored 2 points)
- No (scored 0 points)
Once completed, the scores for the 10 items simply are added, with 40 representing the highest (worse) score, a significant handicap. A separate score can be calculated for each of the two different sub-scales (emotional and social), although typically, just the overall score is used (especially for the screening version).
The general guidelines for interpreting the results are:
- 0–8: No significant perception of a hearing handicap
- 10–22: Mild to moderate perception of a hearing handicap
- >22: Perception of a severe handicap
While the overall score is important, what probably is most useful for patient-centered care is to review with the patients the specific questions where they indicated there was either a social or emotional problem. All the HHIE/A forms are open-access, and easily can be accessed via a Google search. A revised HHIE/A has been developed in the past few years, although has yet to become commonly used in the clinic (Cassarly et al, 2020).
Abbreviated Profile of Hearing Aid Benefit (APHAB)
The second scale we recommend focuses on disability, rather than handicap. The APHAB is composed of 24 items that are scored in four subscales (six questions each) (Cox & Alexander, 1995). The four subscales are:
- Ease of Communication (EC): The strain of communicating under relatively favorable conditions: “I have difficulty hearing a conversation when I’m with one of my family at home.”
- Reverberation (RV): Communication in reverberant rooms such as classrooms: “When I am talking with someone across a large empty room, I understand the words.”
- Background Noise (BN): Communication in settings with high background noise levels: “When I am listening to the news on the car radio and family members are talking, I have trouble hearing the news.”
- Aversiveness (AV): The unpleasantness of environmental sounds: “The sounds of running water, such as a toilet flushing or a shower, are uncomfortably loud.”
The APHAB can be administered as a paper and pencil test, or more commonly using a computer software version—the APHAB is included in the Questionnaire Module of the NOAH software. Scoring software also is available from the University of Memphis Hearing Aid Research Lab. The 24 items of the APHAB are scored on a seven-point scale. A percent value, shown on the form, is designated for each letter answer. There are norms published for both aided and unaided, and even for older individuals with normal hearing (https://harlmemphis.org/abbreviated-profile-of-hearing-aid-benefit-aphab/).
As mentioned, the APHAB is a measure of disability, and therefore, as part of the patient-centered process, it is helpful to compare the patient’s self-report on this scale, to other patient-specific information collected during the pre-fitting process (which we will be talking about shortly in this article):
- Do the EC subscale problems agree with the pure-tone audiogram and the unaided SII.
- Does the BN subscale score agree with the QuickSIN findings?
- Does the AV subscale score agree with the patient’s LDLs?
- Do the patient’s problem areas identified on the APHAB (e.g., lectures, grocery store, in car, etc.) agree with the items nominated on the COSI? The COSI is the next pre-fitting scale that we will discuss.
Client Oriented Scale of Improvement (COSI)
The COSI is probably the most commonly used self-assessment outcome measure among clinicians, however, it also is very useful for formalizing the specific listening goals a patient has for hearing aids, to engage in joint decision making, and, therefore, can be an important aspect of patient-centered care (Dillon et al, 1997).
One issue related to most all standardized self-assessment scales is that the items on the scale are not always relevant for the hearing aid user. Asking about understanding speech at church or at a noisy restaurant is not useful if the patient does not go to either. The COSI was designed to eliminate irrelevancy—and when used correctly, it does. It allows patients to identify and rank order listening goals that are most important to them as an individual. In short, the COSI allows patients to design their own questionnaire.
The process begins by having the patient identify up to five specific listening situations in which he or she would like to hear better. It is important to stress these are listening situations, and not necessarily just communication. For some patients, the listening goals may all focus on communication, but for other listeners (e.g., a patient with a severe hearing loss), the goal may be to better hear when the doorbell rings. Some patients will happily list six or seven problem listening situations, but for other patients, it is a struggle to come up with two. We suggest having at least three.
It is important to make each item as specific as possible. “Hearing in background noise” would not be specific enough. After some questioning, this could be narrowed to “Hearing my friends while playing cribbage at the bar at the Elk’s club.” Once one situation is identified, you then move on and establish other situations. After all situations have been identified, it is then helpful to go back, review all situations, and have the patient rank order them. Simply place a 1 for most important, 2 for the second most important, and so on in the box to the left of the item. Often, the item that the patient mentions first is something that just happened recently and is not really the most important.
On occasion, a patient will seem to only focus on the most difficult situations, often situations where even normal hearing individuals have difficulty. This can be a problem for three reasons: (1) These situations maybe are not really the most important, (2) These situations probably occur infrequently, and (3) It will be difficult to meet the patient’s expectations as these are the very situations where we expect the least benefit from amplification. It is important to encourage the patient to nominate at least some “common” problems—listening situations that occur fairly frequently.
The pre-fitting COSI is not scored, but rather, used as a counseling tool. After hearing aid use, the COSI is then used again as an outcome measure, when it then can be scored—we’ll talk about that later in this paper. Unlike any other scale, it certainly is possible that after seeing hundreds of patients, no two COSIs will look the same. To assist in the overall pre-fitting needs assessment, it also is helpful to have the patient rate their expectations for their COSI items. An example of this is shown in Figure 8. The COSI form can be obtained from the National Acoustical Laboratories (https://www.designeraudiology.com/wp-content/uploads/2016/02/COSI-Questionnaire.pdf).
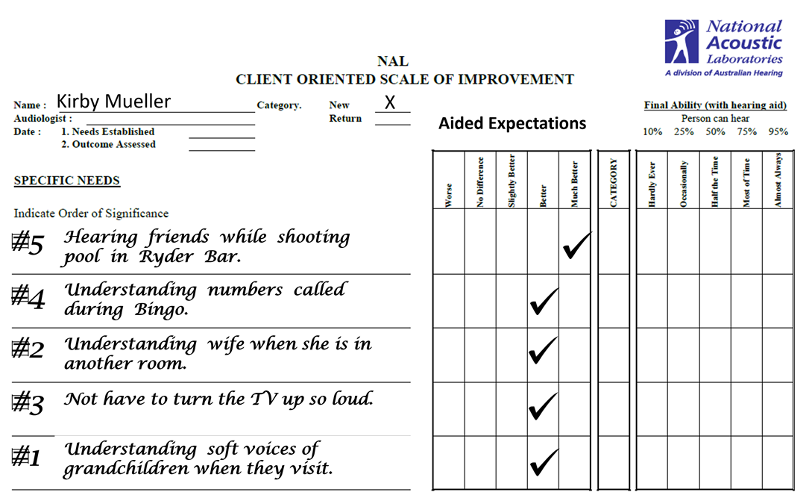
Figure 8. COSI form completed during initial intake appointment, prior to hearing aid selection. Patient nominated five situations for which he would like improvement, then rank ordered them (numbers on left of chart). Expected performance for each item, following the use of hearing aids, was then rated.
Providing patient-centered care when fitting hearing aids always has been the standard fitting practice, but with the emergence of hearing aid internet sales, DTC products and OTC devices, it has become even more critical. Using the APSO standard as a framework, we can initiate procedures into our fitting routines, such as the use of pre-fitting self-assessment inventories, that will enhance our patient-centered practices, and hopefully have the end of result of enhanced patient benefit and satisfaction.
V3.4: Importance of Pre-Fitting Testing
In addition to the self-assessment pre-fitting measures, we’ll move on to the other testing that is conducted to provide necessary guidance for the selection and fitting process. More specifically, what is required beyond the routine audiologic diagnostic examination? Certainly, tests such as speech recognition in background noise, loudness measures, noise annoyance, and central auditory processing immediately come to mind. In recent years, many hearing care providers (HCPs) have added cognitive testing to this battery. To keep it simple, however, for this paper, we’ll only talk about the two most critical measures, which happen to be the two specifically mentioned in the APSO Standard (Mueller et al, 2021):
APSO Standard: #4. Pre-fitting testing includes assessment of speech recognition in noise, unless clinically inappropriate, and frequency-specific loudness discomfort levels. Other validated measures of auditory and nonauditory abilities are considered, as appropriate for the individual patient.
Speech Recognition in Background Noise
Given that survey after survey has documented that speech understanding in background noise is the leading factor prompting individuals to search out hearing aids, it is only logical that this would be a primary test conducted on all, or nearly all hearing aid candidates. Not only is this measure a reflection of what leads to hearing aid use, it also is strongly related to satisfaction. In a recent systematic review, six types of behavioral pre-fitting measures were evaluated (Davidson et al, 2021). There were 1342 articles identified, and after specific inclusion criteria were applied, 21 studies were included in the final analysis. The pre-fitting tests that showed significant correlations with satisfaction were the speech-in-noise tests. Interestingly, but maybe not surprisingly, two tests that historically have been used to predict benefit with hearing aids, degree of hearing loss and speech recognition in quiet, were not correlated with hearing aid satisfaction.
There are many reasons why speech-recognition-in-noise is part of the APSO standard, and should be part of every hearing aid fitting procedure:
- Provides information for the treatment plan, selection of devices and accessories.
- Identifies asymmetry which can influence hearing aid selection.
- Provides information for both pre-fitting and post-fitting counseling—establishes boundaries for realistic expectations.
- Can identify “hidden hearing loss.”
- Can serve as screening test for central auditory processing issues.
- Adds credibility and patient trust. The patient is given a test that directly relates to their chief complaint.
Quick Speech-In-Noise Test (QuickSIN)
There are at least 5 or 6 validated speech-in-noise tests that can be used clinically—some single syllables, some single words, and some words in sentences (See Mueller et al, 2014 for review). For our discussion here, we’ll recommend using the QuickSIN, as it’s the most well-known and readily available, as it has been installed on many computer-based audiometers. And as the name indicates, it is quick! A QuickSIN list consists of six sentences, 5 key words in each sentence. The SNR for each sentence (background=4-talker babble) is prerecorded, with the background noise going from +25 to 0 dB in 5 dB steps. Some general rules for administering the test:
- Each ear is tested separately under earphones.
- Audibility is important. Testing is conducted at the patient’s “Loud But Okay” level, slightly below their LDL, usually around 75-80 dB HL.
- Two lists (12 sentences, 60 key words) are presented to each ear. The two scores are then averaged to obtain single SNR Loss for each ear.
- To ensure homogeneity, QuickSIN Lists 4, 5,13 and 16 should not be used.
The traditional scoring of the QuickSIN is “SNR-Loss.” That is, for a given patient, how does his or her 50% correct point (SRT-50) differ from someone with normal hearing—the average person with normal hearing misses 2 of the 30 key words in the six sentences. For example, if a patient’s QuickSIN score (SNR-Loss) was 8 dB (a common finding for someone being fitted with hearing aids), this means that for this person to perform as someone with normal hearing, the background noise would have to be reduced by 8 dB (or, the speech increased by 8 dB). As mentioned earlier, these findings are essential for pre- and post-fitting counseling (e.g., what local restaurants have a typical SNR that is more favorable than 8 dB)?
The general values and terms used to interpret QuickSIN findings are as follows: 0-3 dB—Normal/Near normal; 4-7 dB—Mild SNR Loss; 8-15 dB—Moderate SNR Loss; and >15 dB—Severe SNR loss. The value of the results of speech-in-noise testing is considerable when hearing aids are selected and fitted. As we reviewed in Quick Takes Volume 1.2, in a study of 3430 veterans (only 6% had normal hearing), only 7% had a normal speech-in-noise score (Wilson, 2011). Interestingly, but not surprising, 50% of these individuals had speech-in-quiet scores (NU-6) of 90% or better. Clearly, if one worked in a very busy office or clinic, and only had time to conduct one speech test, the obvious choice would be speech-in-noise, rather than speech-in-quiet.
Loudness Discomfort Level (LDL) Testing
The second pre-fitting test that specifically is mentioned in the APSO standard is LDL measures (sometimes referred to UCLs). This loudness assessment is provide fitting targets to ensure that the output of the hearing aids are programmed correctly. Fortunately, it is not any more difficult than the Goldilocks porridge principle: Not too loud, not too soft, but just right! This only can be accomplished by measuring individual frequency-specific LDLs, and here are two reasons why:
- Research has shown that it is very difficult to predict LDLs correctly from the pure-tone thresholds. For example, one study of 508 ears of people with confirmed sensorineural hearing loss found that for individuals with a 50 dB loss (common when fitting hearing aids), LDLs varied from ~80 dB to 125 dB HL—only 32% were within 5 dB of average (~100 dB) (Bentler and Cooley, 2002). One easily could make a 20 dB mistake or more by predicting from the hearing loss.
- The second reason relates to what might be an alternative to measuring LDLs. The NAL-NL2 and the DSLv5 do have prescribed MPO values as part of their fitting algorithm. Some might think of using this short-cut for output selection. A recent clinical study has shown that this can be risky, if you rely on the manufacturer’s settings (Mueller et al, 2021). These researchers entered a typical downward-sloping hearing loss into the software of the six leading manufactures. They then selected NAL-NL2 as the fitting algorithm. One would think that the subsequent output settings for all six manufacturers would be the same—the values prescribed by the NAL-NL2 formula (which, across key frequencies, were 98 to 104 dB, re:2-cc coupler). This was far from the case, however, and the large disparity is shown in Figure 9. This Figure shows the plus or minus deviation from the NAL-NL2 for each manufacturer, which is the center horizontal line.
As shown in Figure 9, one product is ~5 dB above the NAL-NL2, and another is only ~5 dB below the NAL (a reasonable conservative approach), but the others vary substantially from the NAL-NL2 prescription values. If we look at the extremes, Aid D vs. Aid E, we see a curious difference in the software MPO settings of about 25 dB. They all can’t be “right!” Clearly, setting the MPO correctly is a job for the HCP, not the manufacturer, and the only way to get this right is to conduct LDL measures.
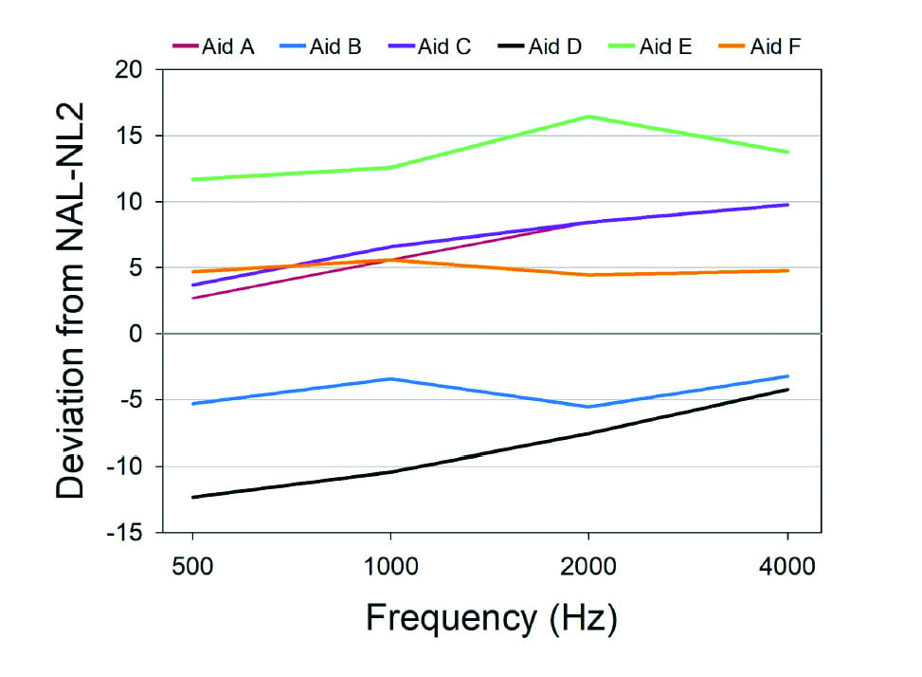
Figure 9. MPO values (deviation from NAL-NL2) displayed in the software for each of six manufacturers for an NAL-NL2 fitting, compared to the true prescribed MPO values in the NAL-NL2 stand-alone software.
Measuring the LDL
The measurement of individual LDLs is a relatively simple procedure, only takes a few minutes, but for accuracy, reliability and effectiveness, a few general guidelines must be followed (see review in Mueller et al, 2014):
- Testing is conducted using earphones, and is frequency and ear specific. The input signal is a pulsed pure tone, the same as used for threshold determination. There is no value in a speech LDL, as it does not assist in the programming of the hearing aids.
- It usually is most convenient to do the measure at the same time as the routine diagnostic, as the patient is already set-up for testing, and accustomed to hearing pulsed pure tones. This also allows for pre-programming the MPO prior to the patient’s hearing aid fitting appointment.
- For a typical audiogram, it usually is adequate to only test two frequencies/ear. The two frequencies selected should be at the lower and higher boundaries of the key frequencies that are being amplified (e.g., you would not do LDL testing at 500 Hz for an open fitting).
- An ascending method is used, either 2- or 5-dB steps. It is critical that the patient is provided a chart of loudness anchors, which they will then use for their responses (See Figure 10). The test signal is increased until a #7 response is given, which is the LDL. Conduct two runs to ensure reliability.
- The instructions are very important, and should be read to the patient (See Figure 11). The patient needs to know that we are looking for the point where sounds are “first uncomfortable,” not what is “tolerable.”
- Research has shown that if the procedures outlined here are used, test-retest for the LDL measure will be ~2.5 dB, about the same as for pure-tone threshold measures (Palmer & Lindley, 1998).
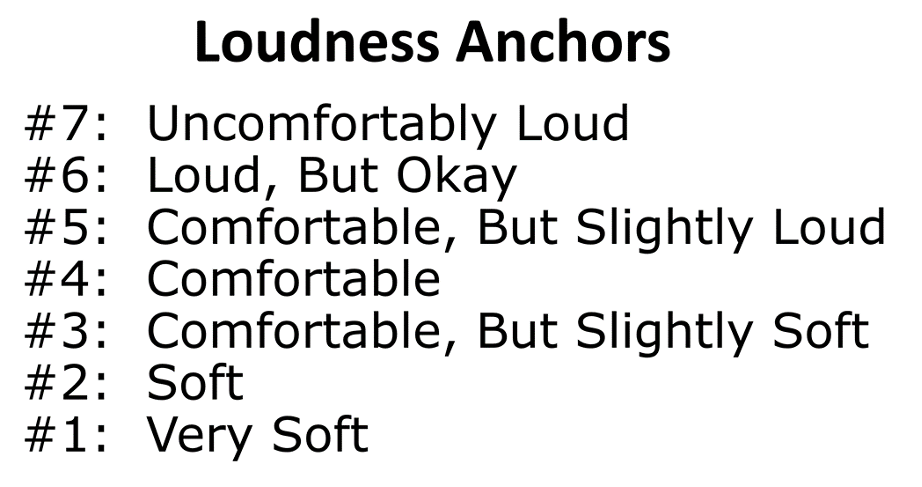
Figure 10. Loudness anchors for conducting LDL measures. Inform the patient that it is okay to repeat a category, and okay to skip a category (from the Hearing Aid Research Lab of the University of Memphis).
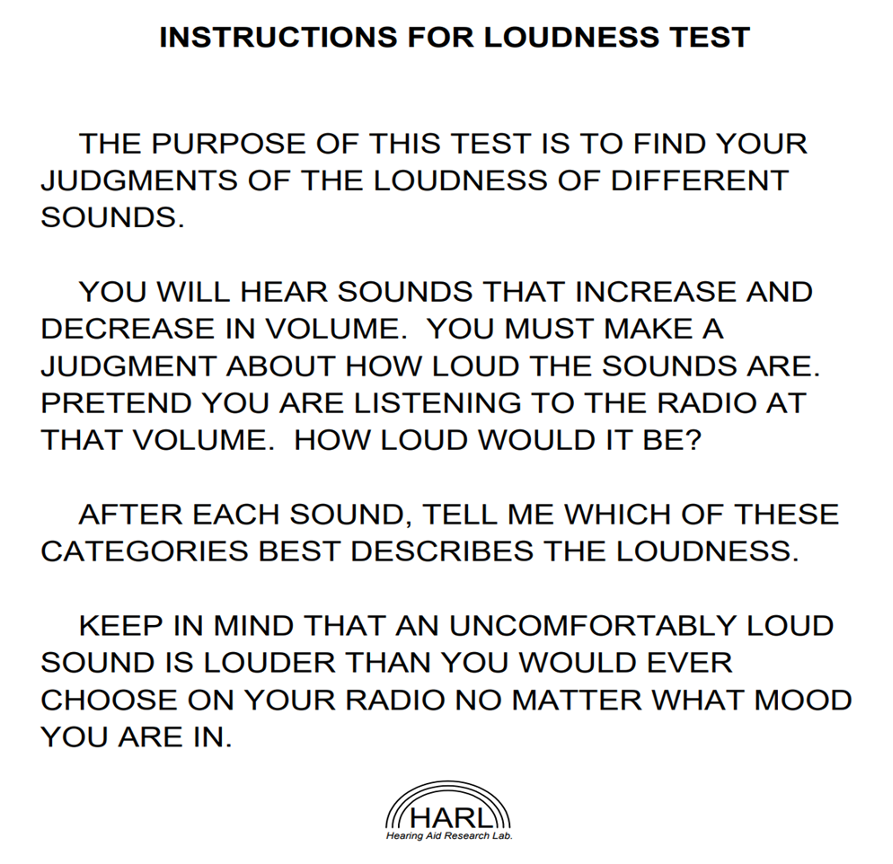
Figure 11. Instructions to patient for conducting LDL measures. Inform the patient that it is okay to repeat a category, and okay to skip a category. (from the Hearing Aid Research Lab of the University of Memphis).
Programming the Hearing Aids
So what happens next? You now have the patient’s frequency-specific LDLs, so it’s time to program the MPO. First, however, we need to use a little math, and convert the HL levels to 2-cc coupler values. This is accomplished using the reference equivalent threshold sound pressure levels (RETSPLs). The same values used when insert earphones are calibrated. These tend to vary a little from study to study, but here are some average values (insert earphones) that work well (which will be added to the HL LDL values): 500 Hz=8 dB, 1000 Hz=3 dB, 2000 Hz=5 dB, 3000 Hz=3 dB, and 4000 Hz=7 dB.
We’ll take a hypothetical patient, with a typical downward sloping loss, whose LDLs are 92 dB at 1000 Hz, and 104 dB at 3000 Hz. So, for 1000 Hz, we’ll add the RETSPL of 3 dB and obtain a 2-cc coupler value of 95 dB SPL. For 3000 Hz, which also has a 3 dB RETSPL, we’ll add this to the HL LDL of 104 dB, and obtain the 2-cc coupler value of 107 dB. Armed with these 2-cc coupler values, we then go to “MPO Programming” in the software, and adjust the frequency-specific handles so that we obtain our desired 2-cc coupler output levels (See Figure 12). Surrounding frequencies are adjusted accordingly to obtain a smooth output curve.
All pretty simple. In true Goldilocks fashion, the MPO is programmed low enough so that loud sounds are not uncomfortable, yet high enough so that important headroom is maintained. This can be done before the patient comes in for the hearing aid fitting. And indeed, this is why we call it a hearing aid fitting!
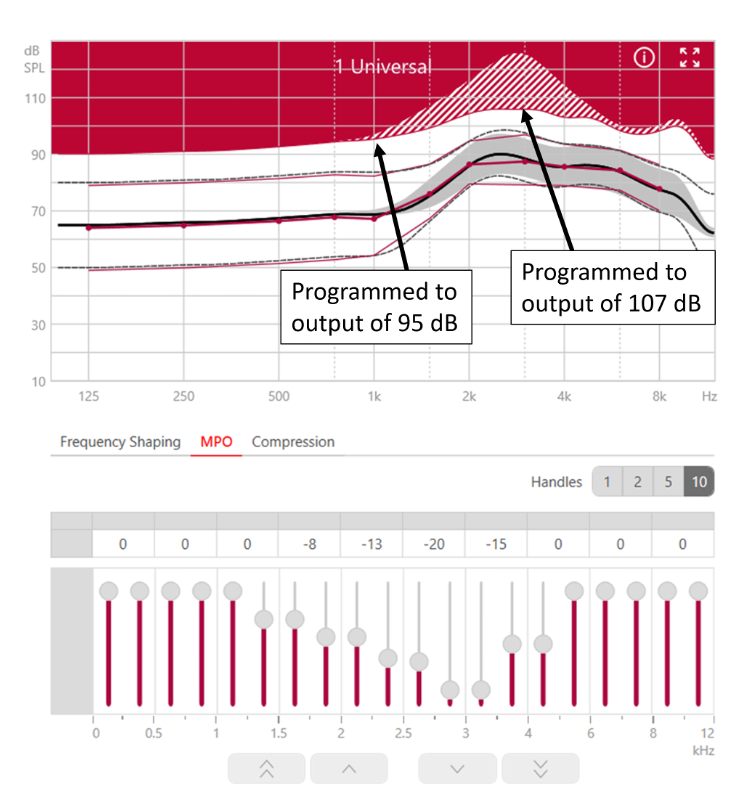
Figure 12. Screen shot of Connexx software illustrating the programming of the MPO (based on the patient’s LDLs) using the output handles in the software.
Conclusions – What we Think this Research Means
You probably are not surprised to hear that we think a well-fitted hearing aid requires the HCP do a few things. The first, clearly illustrated in the MPO study cited above, is that only an HCP, who takes the time to measure the individual’s LDL, enters that information into the fitting software and then customizes the MPO to the individual’s LDL, can consistently come close to optimizing patient outcomes.
The second conclusion is, given the prevalence of the complaint, conducting unaided speech in noise testing with the QuickSIN is well worth your time. When you can talk to patients in a relatable way about how they currently perform in adverse listening situations, what their expectations are with hearing aids, and you provide some expert insights on how you expect them to perform in noise with hearing aids, it goes a long way toward optimizing outcomes.
V3.5: Verification of Gain and Output
As we have traveled through the hearing aid fitting process in this Volume of Quick Takes, we have discussed the candidate, the treatment plan, pre-fitting testing, and levels of technology. We now are at the point of the verification of hearing aid gain and output—what many consider to be the most important step. As reviewed by Mueller (2017), there sometimes is confusion, and maybe even overlap between the terms verification and validation. It’s true, that if you simply look up the definitions of these two terms, you’ll find them to be very similar. But in the world of quality control (and the fitting of hearing aids) they tend to mean different things. Verification typically is used when discussing if specific design goals were met (e.g., the correct ear canal SPL), whereas validation is used to describe whether the end user obtained what they wanted or needed (e.g., benefit and satisfaction when using hearing aids in the real world). Simply put:
• Verification: Are we building the system right?
• Validation: Are we building the right system?
We’ll talk about hearing aid validation in the next section of this paper. For the moment, the topic is verification, and let’s again start by looking at what the APSO Standard has to say on this topic (complete APSO standard at the end of this article):
#10. Hearing aids are fitted so that various input levels of speech result in verified ear canal output that meets the frequency-specific targets provided by a validated prescriptive method. The frequency-specific maximum power output is adjusted to optimize the patient’s residual dynamic range and ensure that the output does not exceed the patient’s loudness discomfort levels.
Prescriptive Fitting Algorithms
To state the obvious, to verify something, there must be a gold standard that is used as the reference. We actually have several goals when we fit hearing aids, including good audibility, optimizing speech understanding, appropriate loudness, good sound quality, and a fitting that is acceptable to the average patient. Fortunately for us, smart people have put all these fitting goals into a pot, stirred them up, and created a reasonable blending that can be tailored to individual patients based on their hearing loss. Of course, we are referring to validated prescriptive fitting approaches, and today we have two, the NAL-NL2 and the DSLv5. And by using the term validated, we are referring to evidence-based findings that the fitting method provides optimum levels of benefit and satisfaction, which nearly always highly correlates to good audibility and speech understanding.
Verification to Fitting Targets
As we mentioned, the starting point for verification is to select a validated prescriptive fitting method, so that research-based SPL targets are available. The most commonly used method in the U.S., for adults, is the NAL-NL2. The goal, therefore is to obtain a real-ear output that is reasonably close to that prescribed by these targets. This is accomplished with probe-microphone measures, using a real-speech input and ear canal SPL as the definitive measure, sometimes referred to as “speech mapping.” In Figure 13, a sample fitting screen is shown, which displays the patient’s thresholds, the fitting targets, the LDLs, the LTASS and the spectrum of the amplified speech signal (30th percentile to 99th percentile).
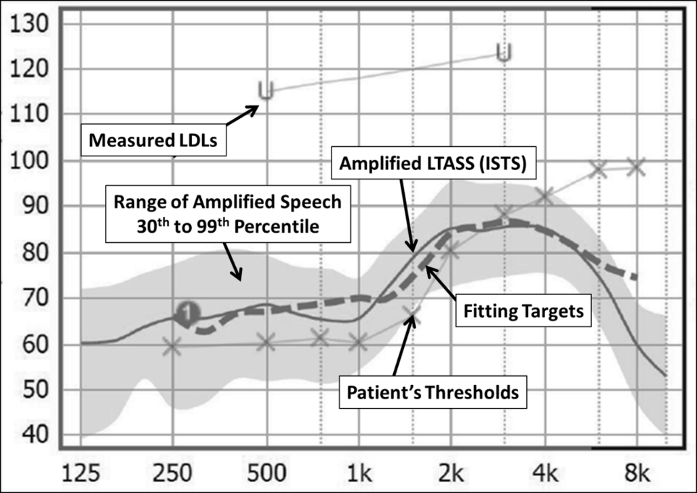
Figure 13. Typical probe-mic fitting screen showing patient’s thresholds and LDLs (converted to ear canal SPL), the prescriptive fitting target, the amplified LTASS and the spectrum of the input speech signal.
A brief review of the general procedure for conducting the testing is as follows (Mueller et al, 2017):
- Pre-program the hearing aids to the manufacturer’s NAL-NL2 fitting. Note in the probe-mic software if this is an experienced or new user, a unilateral or bilateral fitting.
- Position the patient appropriately, with probe-microphones inserted—simultaneous bilateral testing is possible if desired.
- Select the appropriate calibrated speech signal input. The most commonly used, available on all probe-mic equipment, is the international speech test signal (ISTS). “Live speech mapping” is not an acceptable input for verification. It can be used for marketing and counseling after the hearing aids have been fitted appropriately.
- Conduct verification for the the inputs of 55, 65 and 75 dB SPL. Continue programming until the output is at least within 5 dB at each frequency and has a general contour consistent with the targets. Some probe-mic systems automatically will calculate rms error for the target fit.
- The order of testing that is the most efficient is first 55 dB SPL, then 75 dB SPL, and conclude with the 65 dB SPL input signal, which should already be very close to target, if the outputs for the 55 and 75 dB SPL inputs are okay.
Intuitively, it would seem reasonable that all HCPs would follow a verification procedure similar to what we have outlined here—after all, these very procedures have been published in fitting guidelines for over 30 years. Unfortunately, that doesn’t seem to be the case, which then begs the question, what is the alternative approach? The common thought is that many HCPs use the proprietary fitting of their favorite manufacturer, without any verification (the proprietary targets are not stored on probe-microphone equipment). Comparing proprietary-target-fittings to NAL-target-fittings has been a popular research topic over the years. The findings consistently have been in favor of the NAL fitting for speech understanding, speech quality, real-world benefit and satisfaction, and patient preference. This was verified recently in a systematic review, showing that a fit-to-prescriptive target was superior for: speech understanding in quiet and in noise, speech quality, and self-reported listening ability (Almufarrij et al, 2021).
The harm that can be done by using a proprietary fitting was perhaps best illustrated in a clinical study by Levitt and Flexer (2012). These researchers selected the premier hearing aids of the six major manufacturers, and tested them programmed to each manufacturer’s proprietary fitting, and also when the hearing aids were programmed to the verified NAL. For comparison, they also conducted testing with a 12-year-old analog product (programmed to the NAL). Participants were experienced hearing aid users with mild-to-moderate hearing loss. The speech-in-noise test used was the QuickSIN, scored in SNR-Loss, which we just discussed earlier.
The results of the testing for both programmed conditions are shown in Figure 14. What immediately is obvious is that the participants were much better able to understand in background noise when the products were programmed to the NAL. For some instruments, like HA-3, the difference was as large as ~10 dB SNR (in general, we think of 1 dB SNR to equate to 10-15% speech understanding). To put this into a practical perspective, if a patient was at a restaurant wearing hearing aids programmed to a proprietary fit, the background noise would have to be turned down 10 dB before he could understand as well as if he simply had been fitted to NAL targets.
These results easily could influence the patient’s socialization, which we know is linked to dementia. With the proprietary fittings, we would predict that with HA-3, HA-4 and HA-5, the user would avoid restaurants and social events where the SNR was not +15 dB or better, which essentially is all restaurants and events.
Also observe, that the old analog hearing aids (which did not have directionality or noise reduction) outperformed the new premier digital hearing aids when they were programmed to the proprietary algorithm. This clearly shows that the programming of the hearing aids can be more important than the technology available.
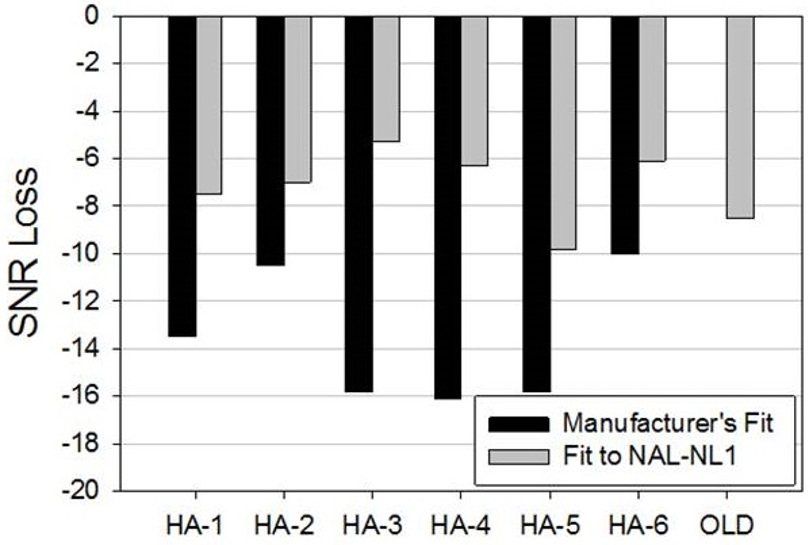
Figure 14. Mean QuickSin findings for participants who were fitted with 6 different pairs of hearing aids programmed to both the manufacturer’s proprietary fitting and the NAL prescriptive method. SNR loss (compared to normal hearing) is shown—the lower the bar the poorer the mean performance.
Providing Appropriate Audibility
It’s only appropriate to start off this section with the much-repeated 1980 quote from audiologist David Pascoe(1980):
“Although it is true that mere detection of a sound does not ensure its recognition, it is even more true, that without detection the probabilities of correct identification are greatly diminished.”
Perhaps one reason why this quote lives on is that today, four decades after it was first published, hearing aids are still often fitted in a manner that does not provide sufficient audibility, especially for soft-speech inputs. Calculations of audibility frequently are ignored. Why is this?
As we have already discussed, verification of input-specific targets is part of the fitting process, and to some degree, this is linked to audibility. More so for the DSLv5 for children, than for fitting algorithms for adults, such as the NAL-NL2. Even though, as part of the verification process, we adjust the output to match the speech targets, it is important to also view audibility separately. In Figure 15, we show an example of how audibility for average speech can be evaluated. This was a patient initially fitted by an HCP using a proprietary approach, with no verification. The left Panel of Figure 15 shows the output of her hearing aid at the onset of the visit. Observe that at 2000 Hz, the LTASS already is falling below target, and for 3000 Hz and above, not even the peaks of speech are audible. The right Panel shows the findings following re-programming. Note that the LTASS meets target, and even at 6000 Hz, 5-10 dB of the peaks of speech are audible.
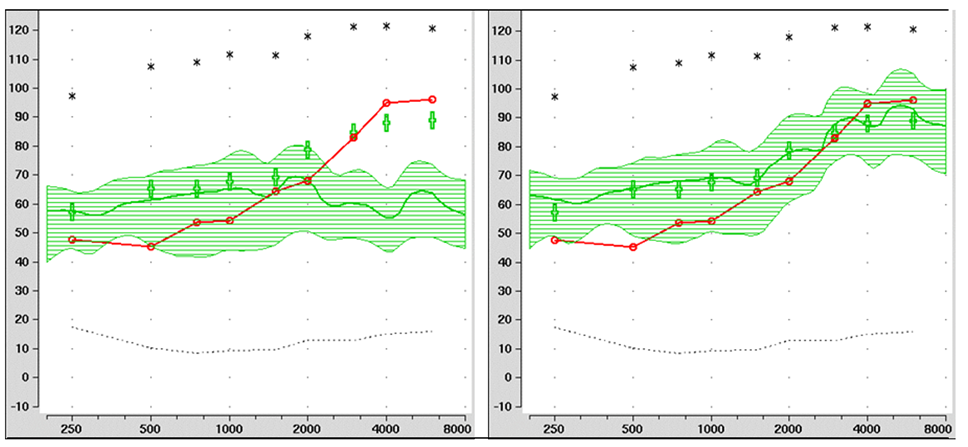
Figure 15. Example of a poorly-fit hearing aid (left panel) with limited audibility present, compared to the same hearing aid after re-programming, establishing good audibility through 6000 Hz (right panel). Figure courtesy of Dr. Lori Zitelli, University of Pittsburgh.
Methods to calculate the audibility of speech have been available since the 1940s—most notably the Articulation Index (AI), which in recent years has become the Speech Intelligibility Index (SII). A simplified clinical procedure also has been available for 30 years—a count-the-dot audiogram, which has been modified to agree with the SII calculations (Killion & Mueller, 2010). Today, most probe-mic systems will calculate the SII (unaided and aided) for all input levels, and with some equipment, also provide the SII that would be present for a perfect target match. It of course is not the goal to obtain an SII of 100% (i.e., 1.00), as this isn’t needed for good speech understanding. In general, for adults with a typical downward sloping mild-to-moderate hearing loss, for a 65 dB SPL input, we would be looking for an SII around .65 to .75 (for adults). The rules are somewhat different for children, and charts are available which provide guidance (Bagatto et al, 2011).
It is tempting for the HCP to program more gain in the highs when it is obvious that speech is not as audible as it seems it should be. Some reasons why more audibility is not always better, especially in the high frequencies:
- It may lead to acoustic feedback, prompting the patient to turn down gain for all frequencies.
- It may lead to too much loudness, prompting the patient to turn down gain for all frequencies.
- It may cause unacceptable sound quality.
- If cochlear dead regions are present, it may lead to unacceptable distortions—speech recognition may become worse rather than better.
Real-ear Verification of the MPO
A final step in the verification process is to verify the real-ear MPO. This is accomplished using a swept tone (85 or 90 dB SPL) rather than the ISTS. Earlier, we talked about the MPO Goldilock’s principle—not too high (below the LDL), but not too low (maximize headroom). We also talked about how the MPO programming handles can be used in the fitting software to obtain an MPO that matches the patient’s frequency-specific LDLs. The verification procedure, therefore, simply is to ensure that our LDL measurements and programming are correct.
An example is shown in Figure 16. Observe the upper orange curve, which falls about 5 dB below the LDL—exactly where we want the MPO to be. Most of the time, no further programming is needed. On some occasions, however, there will be unexpected peaks or dips, and minor frequency-specific re-programming of the MPO is needed.
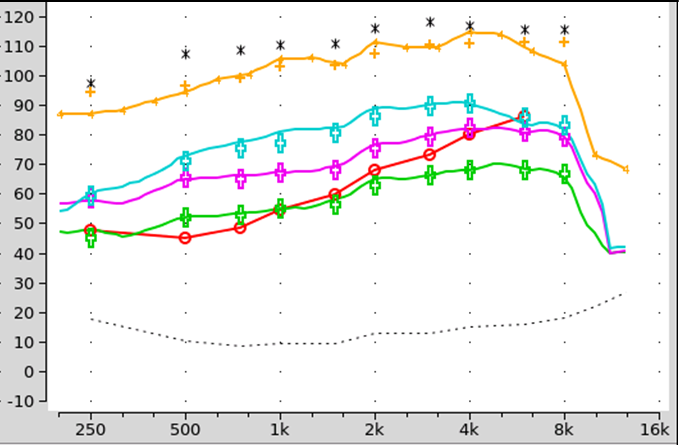
Figure 16. See orange curve on top of chart: Example of how a swept tone can be used to document the MPO settings of the hearing aid, ensuring that the maximum output is high enough to provide adequate headroom, but below the patient’s LDLs.
Conclusions - What this Research Means
Real-ear hearing aid verification should be embraced. It’s what we do better than anyone else. We own the ear canal! Verification to a validated algorithm is not only good for the patient, but good for our profession. Down the road, it just might be what separates us from Aisle 7 of the neighborhood pharmacy.
V3.6: Validation of the Fitting
This is our final section, and fittingly, the focus is on validation, one of the final steps in the overall hearing aid fitting process. A bit earlier, we talked a little regarding how verification and validation are different. Here is a cookie example that you might like (adapted from Mueller 2017): Let's say that one Saturday afternoon you decided to make some cookies just like mom used to make. Luckily, you have her recipe. You follow it very carefully, putting in exactly the right amount of each of the nine different ingredients, and baking them for precisely 10 minutes at 375 degrees. All of that is verification. Are you building the system (cookie, hearing aid) right? Validation is when you take the first bite of the finished product.
It’s now time to see how the finished product works. Here is what is stated in the APSO fitting standard (see entire standard at the end of this paper):
#14. Hearing aid outcome measures are conducted. These may include validated self-assessment or communication inventories and aided speech recognition assessment.
Aided Speech-in-Noise
As we have discussed before, most patients walk in the door to buy hearing aids with the complaint of “I can’t understand speech very well in background noise.” Their expectation, of course, is that after spending considerable money on hearing aids, this problem will be mostly solved. As part of the overall validation process, therefore, it is useful to conduct aided speech-in-noise testing on the day of the fitting (see Taylor and Mueller, 2021 for review). Importantly, this is not conducted for the purposes of tweaking the gain and output—that already has been accomplished with the probe-microphone speech mapping procedure. Rather, the purpose of this aided testing is to provide the patient a listening experience that demonstrates to them that hearing aids really do work in background noise, a “shot in the arm,” and to collect data for counseling regarding realistic expectations.
The test that works very well for this validation procedure is the QuickSIN, which we already have reviewed. The speech-in-noise validation protocol we recommend is as follows:
- Construct a chart as shown in Figure 17. Results (percent correct) can be annotated by using a “U” for unaided and an “A” for aided.
- This testing normally is conducted soundfield in the audiometric test booth, but could be conducted in a quiet clinic office (with careful SPL measurements of the QuickSIN signal).
- First, conduct the testing with the patient unaided. Present two lists of the QuickSIN at 50-55 dB SPL, which would be 35-40 dB HL for most audiometers.
- There are 5 key words for each sentence, so for two lists, there are 10. For each SNR-level, calculate the percent correct for these 10 key words for the 2 sentences. Record these for each SNR on the chart—see the “U” symbols in Figure 17.
- Repeat the procedure with the patient aided bilaterally. Record these scores on the chart. See the “A” symbols in Figure 17.
- Review the results with the patient, using real-world situations to describe performance for each SNR tested.
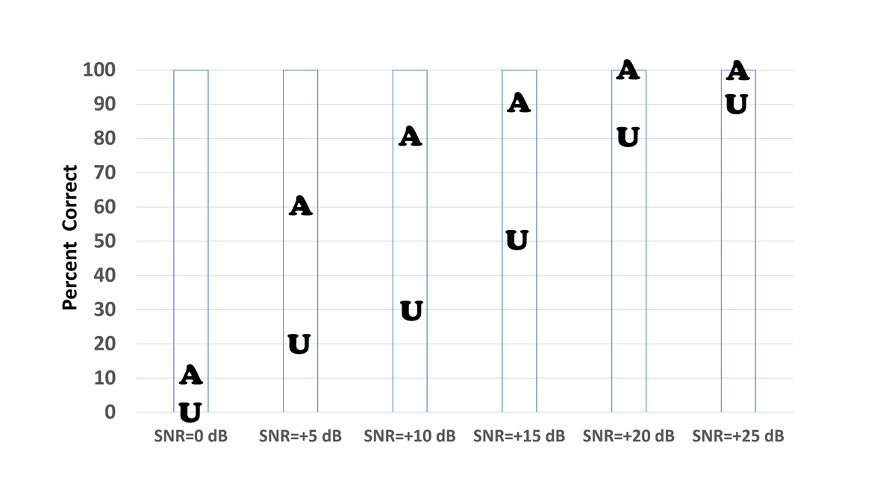
Figure 17. Shown are the unaided and aided QuickSin scores (percent correct for key works; two lists used, 10 key words/each SNR) for a given patient for six different SNRs.
The results shown in Figure 17 are fairly typical. We would first point out to the patient that when there is minimal noise (SNR=+25) he does okay without hearing aids, and when it is extremely noisy (SNR=0 dB), hearing aids probably won’t help—adding that people with normal hearing also tend to score around 0% when this amount of noise is present. The focus of the discussion would be related to the SNRs where significant benefit from hearing aids is present, as these are the SNRs (+5 dB to +10 dB) that are most often encountered in the real world. This completed chart also is then useful to bring out for counseling regarding realistic expectations during post-fitting visits.
Aided Loudness Ratings
A second behavioral validation test that can be conducted on the day of the fitting is aided loudness ratings (Mueller, 1999). The programming of gain to meet prescriptive fittings should make aided soft sounds soft, and aided average-level sounds comfortable. And, the LDL measures and subsequent MPO programming should make aided loud sounds loud (but okay). This easily can be validated delivering speech to the patient while aided bilaterally. It can be conducted in a test booth (soundfield SPL values must be known), but is most efficiently accomplished using the probe-mic equipment. The patient already has a reference microphones at the ear, so we know the input intensity in SPL. The protocol we recommend is as follows:
- The patient is aided bilaterally, with the hearing aids programmed appropriately to validated targets.
- Provide the patient with the loudness anchors chart. This is the same chart that was used for the unaided LDL measures, so should be familiar to the patient (we’ll give you another look at it in Figure 18).
- Deliver a 45 dB SPL continuous speech signal (the ISTS works well). An acceptable rating is a #1, #2, or #3.
- Deliver a 65 dB SPL continuous speech signal. An acceptable rating is #3, #4, or #5.
- Deliver an 85 dB SPL continuous speech signal. An acceptable rating is #5 or #6. Patients are sometimes startled by this loud signal, and immediately give a #7 rating. Confirm that it truly is uncomfortable (it usually isn’t) and then retest.
If the verification steps we outlined earlier were followed, nearly always the appropriate loudness ratings will be obtained. If not, minor tweaking of output might be required.
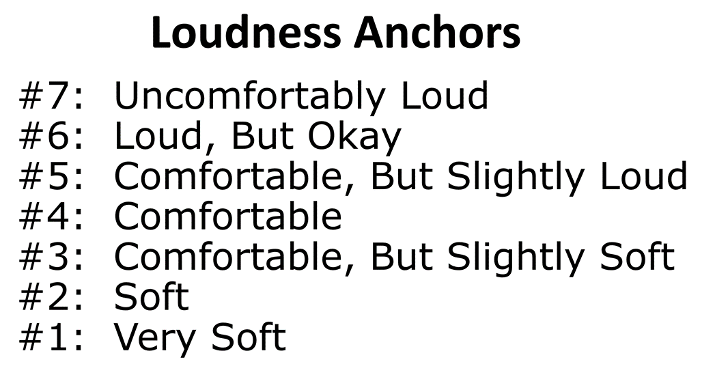
Figure 18. Loudness anchors for conducting aided loudness judgments.
Real-World Self-Assessment
We are now going to focus on self-report validation measures. Recall that earlier we encouraged the use of some type of formal questionnaire to be completed by the patients that relates to their hearing difficulty and communication needs. Many of these same pre-fitting tools are used as outcome measures in the validation stage. The results of these outcome measures are useful in and of themselves, and when compared to pre-fitting test results, they allow us to determine the benefit afforded by the intervention.
These outcome measures allow us to quantify the impact of the management or treatment scheme. They can be useful for answering the following important clinical questions:
- How did the intervention (hearing aids) impact the individual?
- Did the management improve the communication abilities of the individual?
- Did our intervention improve the person’s overall lifestyle?
- And most important clinically, did we meet our intervention goals that were identified during the hearing needs assessment?
In addition to the goals that we just mentioned, there are other reasons why real-world outcome measures are part of the APSO standard, and should be routine in all hearing aid fittings (Ricketts et al, 2019):
- For largely economic reasons, health care is becoming more consumer-driven. In this evolving system, the consumer decides what treatment is selected and when it is complete.
- Self-report measures of outcome are gaining importance, due in part to the fact that many real-world experiences simply cannot be measured effectively in laboratory conditions. Many “features” of hearing aids require a real-world experience to validate. For example, assessing speech perception in noise in an office, even with a defensible signal-to-noise ratio, is rarely perceived by patients as bearing any resemblance to their own experiences.
- Finally, if you choose not to use outcome measures, it is likely that your patients will find other ways to report their satisfaction, or lack of satisfaction. There are several Internet sites devoted to rating doctors and other health care providers, and we suspect that these will become even more commonly used in upcoming years.
Most of the earlier outcome inventories were more general assessments of success, whereas current tools focus on specific domains of benefit or success and are typically developed to be used as open-ended (or user-specified) or closed-ended tools, or both. There probably are at least 10 different self-assessment inventories, used as an outcome measures in research and by various HCPs (see Ricketts et al, 2019, for review). We have selected three to discuss here. Because each inventory provides somewhat different information, each one is uniquely useful in specific situations.
The Client Orientated Scale of Improvement (COSI)
As reviewed earlier, the process begins at the time of the fitting, by having the patient identify up to five specific listening situations in which he or she would like to hear better. It is important to stress these are listening situations, and not necessarily just communication. Some patients will happily list six or seven problem listening situations, but for other patients, it is a struggle to come up with two. We suggest having at least three. After all situations have been identified, it is then helpful to go back, review all situations, and have the patient rank order them. Simply place a 1 for most important, 2 for the second most important, and so on in the box to the left of the item.
Shown in Figure 19 is the completed COSI for a patient (a new hearing aid user) following 3-weeks of hearing aid use (the same patient who rated his expectations earlier). All in all, we would consider this a successful fitting, as we are obtaining at least some benefit for all listening conditions. Note that the two items where a rating of only “Slightly Better” was obtained are listening conditions where even someone with normal hearing has difficultly. Interestingly, the COSI listening situation he nominated last, but in the end was rated #1 (hearing grandchildren), was a situation with a “Much Better” rating.
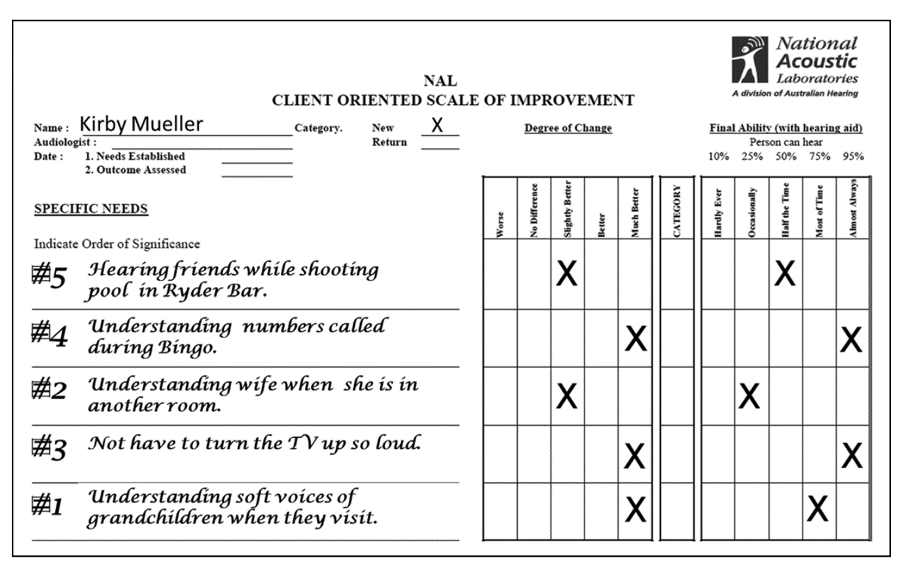
Figure 19. Completed COSI form following three weeks of hearing aid use. Patient rated both “Degree of Change” and “Final Ability.”
Abbreviated Profile of Hearing Aid Benefit (APHAB)
The second scale we recommend, developed by Robyn Cox and colleagues focuses on disability (Cox and Alexander, 1995). The APHAB is composed of 24 items that are scored in four subscales (six questions each):
- Ease of Communication (EC): The strain of communicating under relatively favorable conditions.
- Reverberation (RV): Communication in reverberant rooms such as classrooms.
- Background Noise (BN).
- Aversiveness (AV): The unpleasantness of environmental sounds.
The APHAB can be administered as a paper and pencil test, or more commonly using a computer software version—the APHAB is included in the Questionnaire Module of the NOAH software. Scoring software also is available from the University of Memphis Hearing Aid Research Lab. The 24 items of the APHAB are scored on a seven-point scale. A percent value, shown on the form, is designated for each letter answer.
As we’ve already discussed, the unaided APHAB can be administered before the fitting to assist in establishing fitting goals. It is also possible to have the patient complete the APHAB for “unaided” on their follow-up visit. It is helpful to have both unaided and aided scores, as then benefit can be calculated. There are norms published for aided, unaided and for benefit. There also are norms for older individuals with normal hearing. It is always comforting to the patient (and the HCP too) to inform him or her that with their hearing aids, they are performing equal to someone with normal hearing. The norms can be found at: https://harlmemphis.org/abbreviated-profile-of-hearing-aid-benefit-aphab/).
The International Outcome Inventory for Hearing Aids (IOI-HA)
The IOI-HA is a short inventory used to quantify the effectiveness of hearing aid treatment (Cox and Alexander, 2002). This inventory is unique in that it addresses several domains related to hearing aid use, and is the outcome measure that is available in the greatest number of different languages, allowing for hearing aid outcome comparisons around the world. It can be useful for clinical comparisons across groups based on differences in clinical setting, treatment option, or specific HCPs. Alternatively, it can be used as a very quick way to evaluate patient outcomes to reinforce the positive impact of our services.
While many self-assessment inventories have several questions related to only one domain, the IOI-HA consists of seven items that focus on different domains of hearing aid outcomes, but only one question/domain. The domains assessed are:
- Benefit from hearing aids
- Daily use
- Satisfaction with amplification
- Impact of using hearing aids on significant others
- Residual activity limitation
- Residual participation restriction
- Impact on quality of life
The inventory is meant to be given in paper-and-pencil form. It is very self-explanatory, and there are no formal instructions. To score the outcome, each answer is given a number value 1 (worst) through 5 (best). For this measure, a higher score is indicative of a better outcome. The general norms are shown in Figure 20. The shaded box indicates what would be considered “acceptable”. The 7 categories (on the X-axis) represent the domains mentioned earlier.
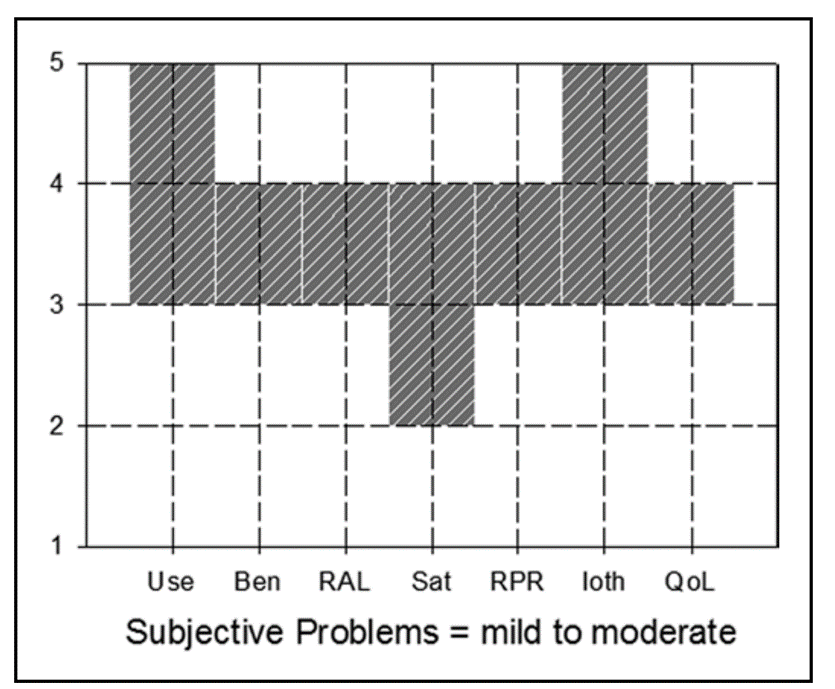
Figure 20. Norms for the IOI-HA. Acceptable ratings are anything within the shaded boxes. The labels on the X-axis are the seven domains (left-to-right): Use, Benefit, Residual activity limitation, Satisfaction, Residual participation restriction, Impact on significant others, and Impact on quality of life.
The IOI-HA is a quick way to obtain a general overview of how the patients feel about their hearing aid settings and how they are doing with them. For example, you might consider having every patient in your clinic fill out the IOI-HA each time they return to the office for follow-up visits while they are waiting for their appointments. By looking over the survey before seeing patients, you can focus your questions on their specific problem areas.
The survey can help clinicians go straight to their patients’ issues and spend more time on counseling after adjusting the hearing aid settings. This particular scale requires very little time to administer and score. A PDF version of the scale in English and for all translations, and all normative data can be found at: https://www.memphis.edu/ausp/harl/downloads/. Remember an important point—simply giving your patients an outcome measure and asking about satisfaction improves satisfaction.
Conclusions – What We Think the Research Means
In our conclusion for an earlier section of the article (V 3.3) we celebrated the virtues of validated self-reports. There is no reason to repeat that here, except to say that by taking the time to gather both a pre-fitting and post-fitting score on your validated self-report is really the only way to know you are meeting the needs of the individual in a concise and repeatable way. We hope you take the time to add one or more of the self-reports reviewed here.
The Bottom Line
We have many hearing aid fitting guidelines and at least one standard. These were laboriously developed by many of the best thinkers in our profession. We owe it to our patients to follow them. The recent evidence-based APSO standard is provided for your review.
HEARING AID FITTING STANDARD FOR ADULT & GERIATRIC PATIENTS
- The hearing aid selection and fitting process is based on a comprehensive, valid audiological assessment. Each step of the selection and fitting process and the rationale is documented, where appropriate.
- Patient communication is conducted in a clear, empathetic manner consistent with the patient's communication mode, comprehension, and their health literacy level. Patient-centered and family-centered care is provided. The patient is encouraged to include communication partners (e.g., family members, significant others, companions) throughout the selection, fitting, and follow-up process.
- A needs assessment is conducted in determining candidacy and in making individualized amplification recommendations. A needs assessment includes audiologic, physical, communication, listening, self-assessment, and other pertinent factors affecting patient outcomes.
- Pre-fitting testing includes assessment of speech recognition in noise, unless clinically inappropriate, and frequency-specific loudness discomfort levels. Other validated measures of auditory and nonauditory abilities are considered, as appropriate for the individual patient.
- Fitting of bilateral hearing aids is the recommended protocol if the patient is a candidate for hearing aids in both ears and it is supported by the needs assessment.
- The hearing aid style and the ear coupling are chosen to be appropriate for the degree and configuration of the hearing loss. Style and coupling should reflect any physical limitations of the patient. Patient input regarding acceptable styles is taken into account.
- The recommended hearing aids include signal processing and features that support the patient’s listening needs. They have the appropriate gain and output, including reserve gain, to meet frequency-specific fitting targets as defined by a validated prescriptive method.
- Assistive technology and accessories are considered to facilitate accessibility to other devices and to satisfy the patient’s listening and communication needs.
- An assessment of initial product quality is completed, using standard electroacoustic measures to verify either manufacturer or published specifications.
- Hearing aids are fitted so that various input levels of speech result in verified ear canal output that meets the frequency-specific targets provided by a validated prescriptive method. The frequency specific maximum power output is adjusted to optimize the patient’s residual dynamic range and ensure that the output does not exceed the patient’s loudness discomfort levels.
- Following individualized verification of hearing aid gain and output, if the fitting is not acceptable to the patient, minor deviations in gain and output may be necessary.
- Orientation is device- and patient-centered and includes use, care, and maintenance of the hearing aid(s) and accessories.
- Counseling is conducted to ensure appropriate adjustment to amplification and to address other concerns regarding communication. Additional rehabilitative audiology is recommended if deemed appropriate.
- Hearing aid outcome measures are conducted. These may include validated self-assessment or communication inventories and aided speech recognition assessment.
- Short- and long-term follow-up is conducted to ensure that post-fitting needs are addressed. This includes updated audiological assessment, hearing aid adjustments, and routine maintenance as needed to ensure the devices are functioning properly and appropriately for the patient.
References can be found at: https://www.audiologystandards.org/standards/display.php?id=102
References
Almufarrij, I., Dillon, H., & Munro, K. (2021). Does probe-tube verification of real-ear hearing aid amplification characteristics improve outcomes in adults? A systematic review and meta-analysis. Trends in Hearing. https://doi.org/10.1177/2331216521999563
Bagatto, M., Moodie, S., & Malandrino, A. (2011). The University of Western Ontario Pediatric Audiological Monitoring Protocol (UWO PedAMP). Trends in Hearing. https://doi.org/10.1177/1084713811420304
Bennett, R. J., Meyer, C., Eikelboom, R., & Atlas, M. (2018). Investigating the knowledge, skills, and tasks required for hearing aid management: Perspectives of clinicians and hearing aid owners. American Journal of Audiology, 27(1), 67–84.
Bennett, R. J., Swanepoel, D. W., Ratinaud, P., Bailey, A., Pennebaker, J. W., & Manchaiah, V. (2021). Hearing aid acquisition and ownership: What can we learn from online consumer reviews? International Journal of Audiology, 60(11), 917-926.
Bentler, R. A., & Duve, M. R. (2000). Comparison of hearing aids over the 20th century. Ear and Hearing, 21, 625-639.
Bentler, R., & Cooley, L. (2002). An examination of several characteristics that affect the prediction of OSPL90 in hearing aids. Ear and Hearing, 22(1), 58-64.
Cassarly, C., Matthews, L., Simpson, A., & Dubno, J. (2020). The Revised Hearing Handicap Inventory and Screening Tool Based on Psychometric Reevaluation of the Hearing Handicap Inventories for the Elderly and Adults. Ear and Hearing, 41(1), 95-105.
Cox, R. M., & Alexander, G. C. (1995). The abbreviated profile of hearing aid benefit. Ear and Hearing, 16(2), 176-186.
Cox, R. M., & Alexander, G. (2002). The International Outcome Inventory for Hearing Aids (IOI-HA): Psychometric properties of the English version. International Journal of Audiology, 41(1), 30-35.
Cox, R., Johnson, J., & Xu, J. (2014). Impact of advanced hearing aid technology on speech understanding for older listeners with mild to moderate, adult-onset, sensorineural hearing loss. Gerontology, 60, 557-568.
Davidson, A., Marrone, N., Wong, B., & Musiek, F. (2021). Predicting Hearing Aid Satisfaction in Adults: A Systematic Review of Speech-in-noise Tests and Other Behavioral Measures. Ear and Hearing, 42(6), 1485-1498.
Dillon, H., James, A., & Ginis, J. (1997). Client Oriented Scale of Improvement (COSI) and its relationship to several other measures of benefit and satisfaction provided by hearing aids. Journal of the American Academy of Audiology, 8(1), 27-43.
Hausladen, J., Plyler, P. N., Clausen, B., Fincher, A., Norris, S., & Russell, T. (2021). Effect of Hearing Aid Technology Level on New Hearing Aid Users. Journal of the American Academy of Audiology. doi: 10.1055/a-1673-9989.
Humes, L. E., Wilson, D. L., Barlow, N. N., Garner, C. B., & Amos, N. E. (2002). Longitudinal changes in hearing-aid satisfaction and usage in the elderly over a period of one or two years after hearing delivery. Ear and Hearing, 23, 428–437.
Humes, L. E. (2020). What is "normal hearing" for older adults and can "normal-hearing older adults" benefit from hearing care intervention? Hearing Review, 27(7), 12-18.
Humes, L. E. (2021). Differences between older adults who do and do not try hearing aids and between those who keep and return the devices. Trends in Hearing, 25, 1-18.
Killion, M. C., & Mueller, H. G. (2010). Twenty years later: A new count-the-dots method. Hearing Journal, 63(1), 10-17.
Leavitt, R., & Flexer, C. (2012). The importance of audibility in successful amplification of hearing loss. Hearing Review, 19(13), 20-23.
Manchaiah, V., Picou, E., Bailey, A., & Hansapani, R. (2021). Consumer Ratings of the Most Desirable Hearing Aid Attributes. Journal of the American Academy of Audiology, 32(8), 537-546.
Mueller, H. G. (1999). Just make it audible, comfortable and loud but okay. The Hearing Journal, 52(1), 10-17.
Mueller, H. G. (2017, November). 20Q: Hearing aid verification - can you afford not to? AudiologyOnline, Article 21716. Retrieved from www.audiologyonline.com
Mueller, H. G., Ricketts, T., & Bentler, R. (2014). Modern Hearing Aids. San Diego: Plural Publishing.
Mueller, H. G., Ricketts, T. A., & Bentler, R. (2017). Speech Mapping and Probe-Microphone Measures. San Diego: Plural Publishing.
Mueller, H. G., Coverstone, J., Galster, J., Jorgensen, L., & Picou, E. (2021). 20Q: The new hearing aid fitting standard - A roundtable discussion. AudiologyOnline, Article 27938. Available at www.audiologyonline.com
Mueller, G., Stangl, E., & Wu, Y.-H. (2021). Comparing MPOs from six different hearing aid manufacturers: Headroom considerations. Hearing Review, 28(4), 10-16.
Palmer, C., & Lindley, G. (1998). Reliability of the contour test in a population of adults with hearing loss. Journal of the American Academy of Audiology, 9(3), 209-215.
Pascoe, D. (1980). Clinical Implications of Nonverbal Methods of Hearing Aid Selection and Fitting. Seminars in Hearing, 1(3), 217-228.
Plyler, P. N., Hausladen, J., Capps, M., & Cox, M. A. (2021). Effect of Hearing Aid Technology Level and Individual Characteristics on Listener Outcome Measures. Journal of Speech, Language, and Hearing Research, 64(8), 3317-3329.
Ricketts, T., Bentler, R., & Mueller, H. G. (2019). Essentials of Modern Hearing Aids. San Diego: Plural Publishing.
Saleh, H., Folkeard, P., Van Eeckhoutte, M., & Scollie, S. (2021). Premium versus entry-level hearing aids: Using group concept mapping to investigate the drivers of preference. International Journal of Audiology. DOI: 10.1080/14992027.2021.2009923
Taylor, B., & Mueller, H. G. (2021). Fitting and Dispensing Hearing Aids. Plural Publishing.
Vonberg, J. (2022). How to transition your practice to person-centered care. Hearing Review, 29(4), 12-16.
Weycker, J. M., Dillard, L. K., Pinto, A., Fischer, M., Cruickshanks, K. J., & Tweed, T. S. (2021). Factors Affecting Hearing Aid Adoption by Adults With High-Frequency Hearing Loss: The Beaver Dam Offspring Study. American Journal of Audiology, 30(8), 1-9.
Wilson, R. H. (2011). Clinical Experience with the Words-in-Noise Test on 3430 Veterans: Comparisons with Pure-Tone Thresholds and Word Recognition in Quiet. Journal of the American Academy of Audiology, 22(7), 405-423.
Wu, Y. H., Stangl, E., Chipara, O., Hasan, S., DeVries, S., & Oleson, J. (2019). Efficacy and effectiveness of advanced hearing aid directional and noise reduction technologies for older adults with mild to moderate hearing loss. Ear and Hearing, 40(4), 805-822.
Citation
Taylor, B. & Mueller, H. G. (2023). Research QuickTakes Volume 3: optimizing the hearing aid fitting process. AudiologyOnline, Article 28682. Retrieved from https://www.audiologyonline.com