Learning Outcomes
After this course learners will be able to:
- Describe the “dB window of acceptance” when matching a prescriptive target.
- Describe the expected venting leakage when fitting instant-fit tips and domes.
- Describe fitting errors that could result by using the MPO selected by the fitting software.
- Describe the accuracy of various signal classification systems.
- Describe the mistakes that could be made if a verified fitting target was not used.
Introduction
In the everyday practice of fitting hearing aids, we develop many beliefs, about both the technology and the fitting procedures. Some of these beliefs are based on things we think we learned in school, things we might have read, things we have heard from a rep, things from our fitting experiences, or things we just believe to be true because we always have. But for most of us, not all of them really are true.
Misconceptions also are common in the world of diagnostic audiology. For example, many believe that when a hearing loss is truly sensorineural, air and bone conduction thresholds should match (no air-bone gap). Careful analysis has shown, however, that in actual clinical testing, this only will happen for both ears (500 to 4000 Hz) 1 out of 250,000 patients (Margolis, 2008). Even if you are seeing as many as 10 patients/day, you can only expect this to happen once every 100 years!
We might not have hearing aid fitting misconceptions quite this dramatic, but we believe that several indeed do exist, and we’ll discuss many of them in this Volume 4 of Research QuickTakes. In this first section our focus will be on the practice of adjusting gain and output to a validated prescriptive target.
V4.1: When is a “Fit-to-Target” a “Fit-to-Target”?
In a sense it’s little ironic, that in previous Volumes of QuickTakes, we’ve discussed the importance of matching output to a validated fitting target, and now we’re going to say that, well, it doesn’t really have to be a perfect match, although this needs some explaining—stick with us. The whole notion of fitting to a prescriptive target means that we have prescriptive fitting methods, so let’s start with that.
Prescriptive Fittings
Using the patient’s hearing loss as a basis of a mathematical model to determine appropriate hearing aid fitting gain and output is not a new concept—with the “Lybarger ½ gain-rule” of 1944 setting the pace (Lybarger, 1944). Over the years there have been dozens of other methods proposed, some named after people (e.g., Berger, Bragg, Libby, Shapiro, Victoreen) and others named after places (e.g., Cambridge, Central Institute for the Deaf [CID], Memphis State University [MSU], and the National Acoustic Laboratories [NAL]). The name of a few attempts to describe what the method does (e.g., Desired Sensation Level [DSL], Prescription of Gain and Output [POGO], Visual Input/Output Locator Algorithm [VIOLA]), and one method simply is named after a figure (FIG6). Today, there really are only two survivors (at least in the U.S.): the National Acoustic Laboratories (current version NAL-NL2) and the Desired Sensation Level method (current version DSLv5.0). These are commonly referred to the validated methods, as there is substantial background research involving their development, use, and the benefit obtained when they are applied. The use of the term validated also is to differentiate them from manufacturer-based proprietary fitting algorithms, available in the fitting software of most all hearing aids, which are not validated (at least not in refereed publications). Considerable research has shown the improved patient benefit of using the validated methods vs. the proprietary fittings (see Mueller, 2020, for review), so our discussion here only relates to the NAL and DSL methods.
Verification of Fitting Targets
For many reasons, it is difficult to predict the output in the real ear for a given hearing aid fitting algorithm. For over 30 years, therefore, hearing aid fitting guidelines have specified that all fittings should be verified using probe-microphone real-ear measures (Mueller, 2020). This “verification” nearly always involves considerable changes in the hearing aid programming following the initial programming (which we discuss in section 4.5). Today, verification is accomplished by using a real-speech signal, shaped to mimic the international long-term average speech spectrum (ILTASS). Hearing aid output is adjusted to match input-specific fitting targets across frequencies for soft (50-55 dB SPL), average (60-65 dB SPL) and loud (75-80 dB SPL) inputs. While this verification procedure has been written into all fitting guidelines that have been published by professional organizations, and a recent APSO standard (Mueller et al, 2021a), compliance among hearing care professionals (HCPs) is poor—a topic we addressed in QuickTakes Volume 3.5. Somewhat ironically, as we stated earlier, our potential misconception for this QuickTakes issue is not related to those who are not doing the testing, but rather, our topic only applies to the prudent HCPs who are involved with the probe-mic verification process.
Match-to-Target
For some, it is tempting to think of the fitting target as a specific value—a dot or line on the fitting screen. It isn’t. What is commonly displayed by probe-mic equipment manufacturers is the center point of the range of the target. Here is a football analogy, that doesn’t require a lot knowledge about football. A team can score three points by kicking the ball in between the goal posts (separated by 18 feet, 6 inches, extending 35 feet above the 10-foot crossbar), located on each end of the playing field. Think of these uprights as “the target.” If the kicked ball goes directly through the middle of the two posts, the team scores 3 points. If the kicked ball just barely goes through, only an inch or so inside the right or left goal post . . . the team still scores 3 points!
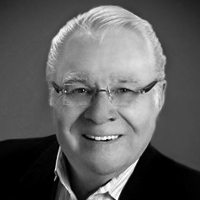
One of the original goals of the NAL prescriptive algorithm was to place average speech at the average patient’s preferred listening level for all key speech frequencies. We know of course, that as the hearing loss becomes greater, the preferred listening level also increases, and that this change will vary depending on the configuration of the audiogram and the person’s loudness growth function. During the development of NAL-NL2, researchers compared use-gain data to what would have been prescribed by NAL-NL1 (Keidser and Dillon, 2006). A simplified illustration of these results are shown in Figure 1 (n=189, 60 dB SPL input).
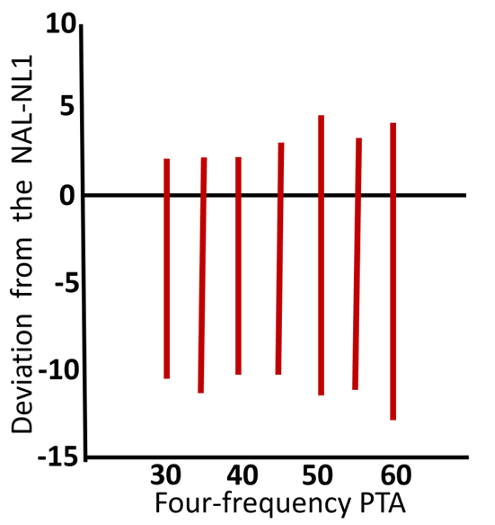
Figure 1. Vertical bars represent the range of preferred gain referenced to NAL-NL1 (0 dB horizontal line) for different levels of hearing loss (based on 4-frequency PTA). Adapted from Keidser and Dillon (2006).
Observe that in general, for all hearing loss levels, preferred use-gain tended to fall slightly below the NAL-NL1 targets, and this was then accounted for in the NAL-NL2 modification. By lowering prescribed gain by ~3 dB, the authors reported that approximately 60% of the preferred levels were within +/- 3 dB of target. But more important for our discussion here, notice that for all the average hearing loss levels, the range of preferred gain was ~12 to 16 dB, simply reflecting the fact that different individuals have different loudness growth functions and loudness preferences.
So, how big is the range that we should consider as our fitting target? For clinical verification, it is reasonable to consider the range to be 10 dB; +/- 5 dB from the center point shown on the fitting screen. This value, in fact, has been written into some fitting guidelines. In other words, going back to our football analogy, an output that falls 5 dB below the target line on the fitting screen is not 5 dB below target—it’s a fit-to-target! The decision to consider this the “final fitting” of course is made in tandem with feedback from the patient regarding their preferred listening level.
Why +/- 5 dB? In research with prescriptive methods, it is common to program the hearing aids so that the rms fitting error across frequencies is no larger than 2–3 dB (Mueller, 2005). Cox and Alexander (1990) found, however, that differences among prescriptions were preserved if the rms error for the match to target was 5 dB or less. Additionally, similar research found that benefit and satisfaction was not significantly reduced until the rms error (at 1000, 2000, and 4000 Hz) reached 6 dB or more (Baumfield and Dillon, 2001). The +/- 5 dB range, therefore, has some reasonable background supporting evidence.
Some probe-mic equipment will help assist in making target-match decisions, by showing the dB error across frequencies, as shown in Figure 2. The bold vertical bars used by this manufacturer are for +/- 3dB, but it’s also easy to see by the tracing if the values are within +/- 5 dB (which it is not, in the 3000 Hz region).
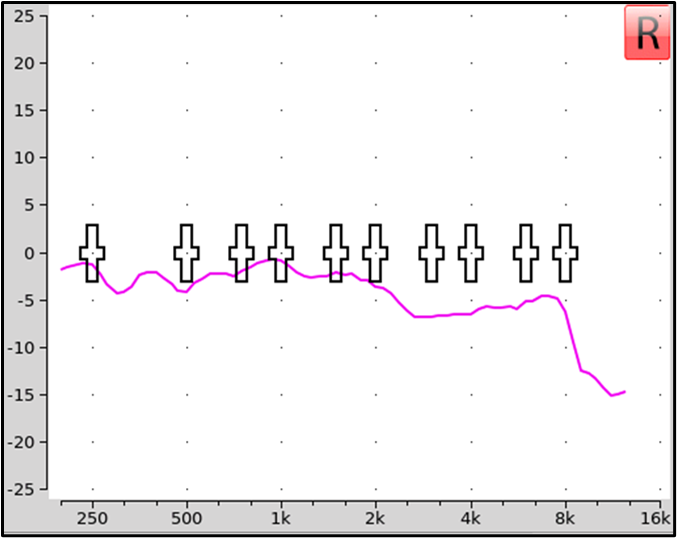
Figure 2. An example of a probe-mic manufacturer that automatically calculates dB error for match to target. In this example, the vertical bars represent +/- 3 dB, although clinically, +/- 5 dB commonly is considered acceptable.
Using Clinical Reason
The +/- 5 dB rule is a good general guideline, but as with many things associated with fitting hearing aids, clinical savvy still needs to be applied. For example, consider the two fittings shown in Figure 3. In the top panel, we show a very close fit-to-target (green curve) and a comparative fitting that falls about 5 dB below targets (blue curve). The blue curve is within the +/- 5 dB guideline, and seems like a reasonable fitting. It could be that this is the patient’s long-term use-gain level, or it could be that after some experience he will want some additional gain, and perhaps end up at the center or above-center of the prescribed fitting range (See QuickTakes Volume 2.3 regarding the role of acclimatization in the fitting process). The key here is that the output curve follows the prescribed contour, and therefore, an increase in overall gain will move all frequencies closer to the center of the target range.
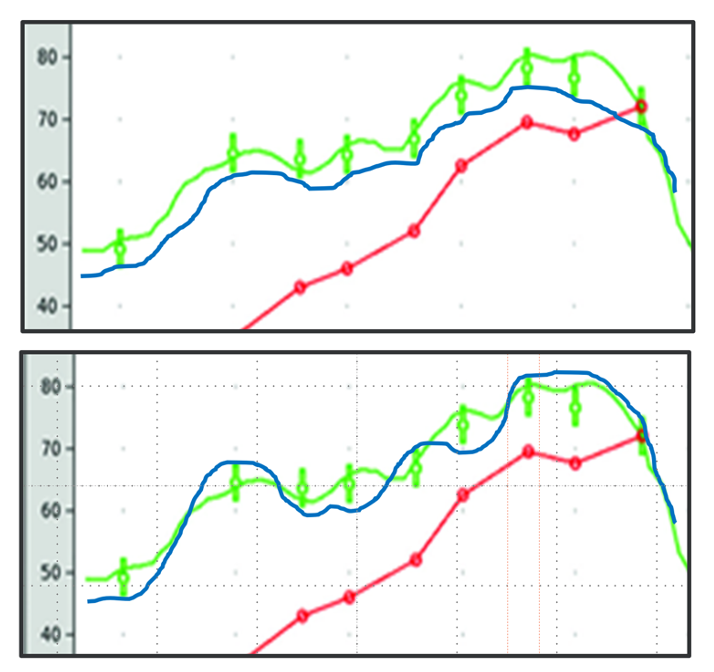
Figure 3. Example of two different fittings that miss target by ~5 dB at most frequencies (see blue curves; green curve is best fit to target). The top panel would be considered “acceptable,” whereas the bottom panel requires more programming.
The lower panel in Figure 2 shows the same fit-to-target output (green curve). The comparative fitting (blue curve) is considerably different than shown in the top panel, although it does pass the +/- 5 dB fitting criterion. We wouldn’t consider this fitting acceptable, however, as a gain change the patient might make (up or down) to obtain a better perception of speech for a specific frequency range, will move the output further from target for other frequencies.
Mean RMS Error
Probe-mic equipment will also provide some calculations which help us evaluate the “goodness” of the fitting—see Mueller and Pumford, 2022, for review. While it is fairly easy during testing to observe if the +/- 5 dB fitting range rule is being met, some probe-mic equipment will automatically calculate the root mean square (RMS) fitting error (e.g., key frequencies 500 to 4000 Hz are common, but others can be selected). The RMS is the square root of the arithmetic mean of the squares of a set of numbers. For example, if your fitting error for four key frequencies was 4 dB, 2 dB, 3 dB and 5 dB, the squares of these numbers are: 16, 4, 9 and 25. Summed they total 54, and the mean (54 divided by 4) = 13.5. The square root of 13.5 is 3.7 dB, which would be your RMS error. In general, we want to see the mean RMS error at 5 dB or lower. In case your probe-mic equipment doesn’t calculate rms error, and your skills at measuring the square root of numbers is a little rusty, you’ll be pleased to know that the mean absolute error (an average value disregarding + and -) will be quite close to the average rms error (3.5 dB vs. 3.7 dB in our example above).
Just like the +/- 5 dB fitting rule, however, we also have to use a little clinical savvy when viewing the mean RMS error. For example, let’s take a patient where you have fitting errors of 2 dB, 1 dB, 2 dB and 9 dB. This will give us a “passing” <5 dB mean RMS error of 4.7 dB, however, most of us would not be happy with the 9 dB mistake at 4000 Hz.
Speech Intelligibility Index (SII)
Another method to loosely grade the fitting is to observe the SII, automatically calculated after each run by most probe-mic equipment (Mueller and Pumford, 2022). Like the fit-to-target range, there also are some misconceptions about the SII, most notably that bigger is always better. A good starting point for understanding the SII is to review what would be expected for “good” fittings. Those numbers were provided by Earl Johnson and Harvey Dillon (2011) for five different (sensorineural) hearing losses for a 65-dB input for both the NAL-NL2 and the DSLv5.0. They are summarized in Table 1, which shows the SII that would be obtained for a perfect match to the respective fitting targets.
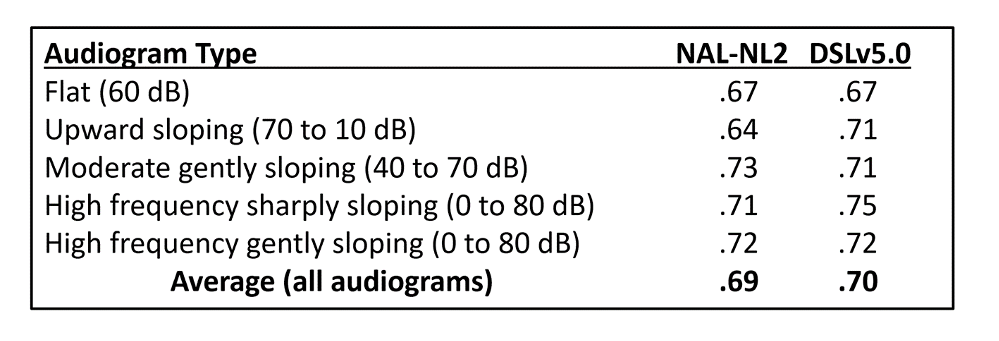
Table 1. The SII that would be obtained for a perfect prescriptive match to a fitting target for five different audiograms (65 dB SPL input).
When viewing Table 1, two things become obvious. First, from the SII perspective, there is little difference between the two fitting methods, the biggest difference was for the upward sloping configuration, when the DSL algorithm resulted in .07 greater SII than the NAL. The second observation is that for fitting to average-level inputs, an SII around .70 or a little higher should be expected.
As we mentioned earlier, once you have reached the desired SII range for a given hearing loss, a bigger SII is not necessarily better. The temptation to raise gain above desired fitting targets tends to be the most common when there is a precipitous downward-sloping hearing loss, going from 10-20 dB in the low frequencies to 70-80 dB in the highs. When this configuration exists, it is common that the center of the fitting range (target displayed on screen) is below the patient’s threshold in the high frequencies. Intuitively, this doesn’t seem right, and increasing gain (and the SII) is tempting. Some reasons why this probably isn’t a good idea include (Mueller et al, 2017):
- It will cause an inappropriate overall loudness perception, causing the wearer to turn down gain for all frequencies.
- With this type of hearing loss, effective audibility must be considered. More audibility might not result in improved speech understanding, especially if cochlear dead regions exist.
- The increased gain in this area could cause unacceptable speech quality, again causing the wearer to turn down gain for all frequencies.
Pediatric Patients and the SII
To this point we’ve focused on adult hearing aid users, but it’s important to mention that considerable work also has been done regarding the SII for the pediatric patients. Leading the charge in this area, are the folks from Western University, who have constructed handy charts that can be used to determine if a child’s fitting meets their data collected from “acceptable” fittings (falls within the 95% confidence interval) based on the pure-tone average (as the average PTA increases, the expected SII becomes smaller, as the audibility range is shrinking). As with adults these charts are intended to be used as a supplement to the standard +/- 5 dB fit-to-target for soft and average speech inputs. The charts can be found at https://www.dslio.com/wp-content/uploads/2014/03/2_UWO_PedAMP_v1.0_for_printing_Revision_2_Dec_11.pdf
Conclusions—What We Think the Research Means
It is ironic that many HCPs conduct no real-ear verification at all, and yet our first misconception for this QuickTakes Volume is focused on HCPs who are a bit too persnickety regarding the exact match to target. Primarily because of the way it is displayed on the fitting screen of most probe-mic equipment, it is easy to think of the “target” as a given number, rather than a range. Research has shown, however, that for individuals with the same general hearing loss, the amount of gain required for preferred listening levels varies by over 10 dB. Hence, when we are matching the output of hearing aids to a prescriptive target, we must remember that this is an average. The generally accepted range of the fitting target is 10 dB, +/- 5 dB from center of the target, commonly displayed on the fitting screen. We also reviewed research regarding the use of mean RMS error and the SII as supplemental tools for determining the overall “goodness” of the fitting. Finally, at the end of the day, it is ultimately up to the HCP to determine that the smoothness of the hearing aid’s frequency response is a relatively faithful, +/- 5dB match of the prescriptive target.
V4.2: Venting Considerations When Using Instant-Fit Tips and Domes
Recently, on a popular internet forum for hearing care professionals (HCPs), an audiology student posed the question: “In the everyday practice of fitting hearing aids, how do you decide when to use the manufacturer’s instant fit eartips, or when to have a custom earmold made?” There were over 20 responses, expressing very different beliefs, with little supportive data. And, in keeping with this Volume of QuickTakes, it was obvious that there are some serious misconception about earmolds, instant-fit eartips and venting floating around.
For the most part, our audiologic decisions regarding the type of earmold/eartip that we select are based on the patient’s hearing loss in the lower frequencies: the greater the loss, the more we want the fitting to be “closed,” preventing the leakage of amplified low frequencies due to venting. If the patient has normal or near-normal hearing in the low frequencies, then the general thinking is that the fitting should be mostly “open,” to allow for all sounds to have a direct pathway to the eardrum. Other factors, such as unwanted pressure, comfort, feedback or the occlusion effect also come into play on occasion, but for the most part, the closed-to-open continuum initially is based on the patient’s low-frequency hearing loss.
Venting Effects
What do we know about venting effects? There have been dozens of articles, monographs and book chapters written on this topic, comparing short vs long, skinny vs. fat, internal vs. external, diagonal vs. parallel, resonance vs. inertance, and much more. Many of us cut our earmold acoustics teeth on the Monograph published by Robyn Cox in 1979. Considerable data on earmold acoustics also were made available by research from the National Acoustic Laboratories (NAL). At one time or another most of us have seen the chart shown in Figure 1 from the NAL’s Harvey Dillon (1985), which shows the expected amount of low-frequency venting for different earmold styles. If we use 500 Hz as the key frequency of interest (which it often is in clinical practice), note that vent effects for occluded and a 1mm vent would only be 1-2 dB, this increases to ~4 dB for a 2mm vent, ~12 dB for a 3.5 mm vent, and ~23 dB for an open (tube) fitting.
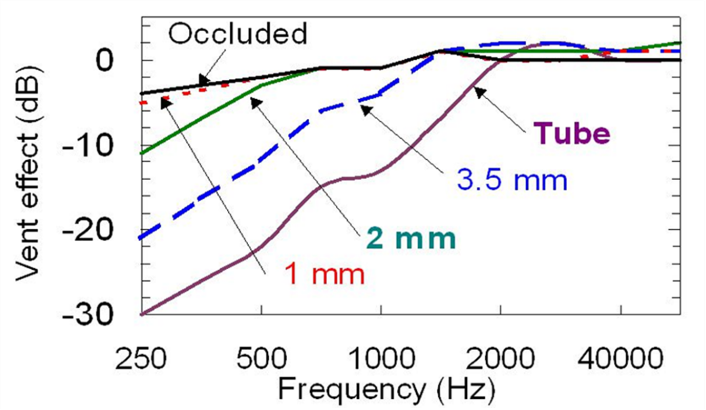
Figure 4. Example of venting effects of different types of hearing aid earmolds (adapted from Dillon, 1985).
Potential Programming Error
Most manufacturers, in their fitting software, provide the option of selecting the “tightness” of the fitting. This will alter the initial programming of the hearing aids, as if it is known that “X dB” will leak out of the ear at a given frequency, then “X dB” more has to be added to the programmed output to reach a given fitting target. Now, if the HCP conducts probe-mic verification, this initial software fitting has little importance, as the hearing aid output will be adjusted to match target regardless of what the manufacturer initially programs. However, if probe-mic verification is not conducted, this could have a significant impact on the fitting.
An example of how earmold selection in the software affects the programmed output is illustrated in Figure 5. Shown are the simulations for a mild-moderate hearing loss, 40 dB in the low frequencies gently sloping to 70 dB in the high frequencies. The top panel is the programmed output when “closed” was selected in the software, the bottom panel is the output programmed when “open” was selected. The differences for key frequencies are shown on the bottom panel. Interestingly, the values shown are nearly identical to the venting effect displayed in Figure 4 for an open fitting. From a practical standpoint, what we can extract from Figure 5 is that if we told the software that we were using a closed fitting, but unknown to us the eartip had significant unintended leakage, and it really was an open fitting, our patient would be “under-fit” by the values shown on the lower panel. Could that actually happen? Most certainly—read on!
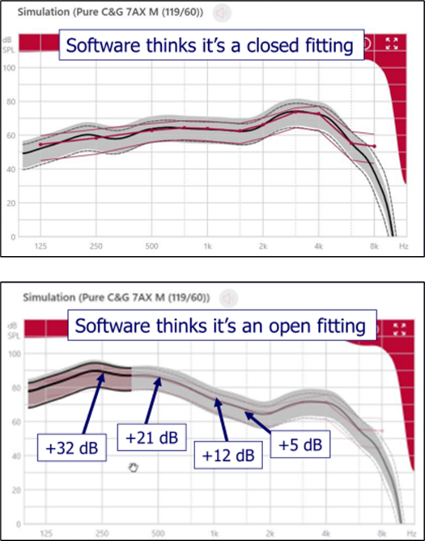
Figure 5. Software display showing automatic hearing aid programing for a hearing loss sloping from 40 dB to 70 dB. Top panel is when “closed fitting” was selected in the software. The bottom panel is when “open fitting” was selected. The numbers on the bottom panel reflect the frequency-specific difference between to two fittings.
Leakage from Instant-Fit Tips
Ever since receiver-in-canal (RIC) BTE hearing aids have become popular, manufacturers have provided fitting tips that can be used with these instruments. Initially, these tips were just for open fittings, but soon, most all manufacturers provided a family of tips ranging from open, to partially open to “closed,” even using terms like “double-dome” to suggest very closed. But if something simply is labeled closed, is it really closed?
Essentially all types of earmolds have some degree of venting due to what is referred to as “slit leak.” That is, the leakage that occurs around the circumference of the earmold/eartip, where it makes contact with the wall of the earcanal. The greater the lateral-to-medial contact distance, the less effect slit leak will have. A custom mold might have a contact distance of 8-10mm or so. The contact distance for instant-fit ear pieces usually is much less, and moreover, in general, their construction allows for a looser fit. Increased vented from what we see in Figure 4 would be expected.
Fortunately, this has been studied. Recent research has examined both the insertion loss (REOR subtracted from the REUR), and the venting effects of five different instant-fit tips: open, tulip, 2-mm vent, 1-mm vent and double-dome closed (Balling et al, 2019; See Figure 6).
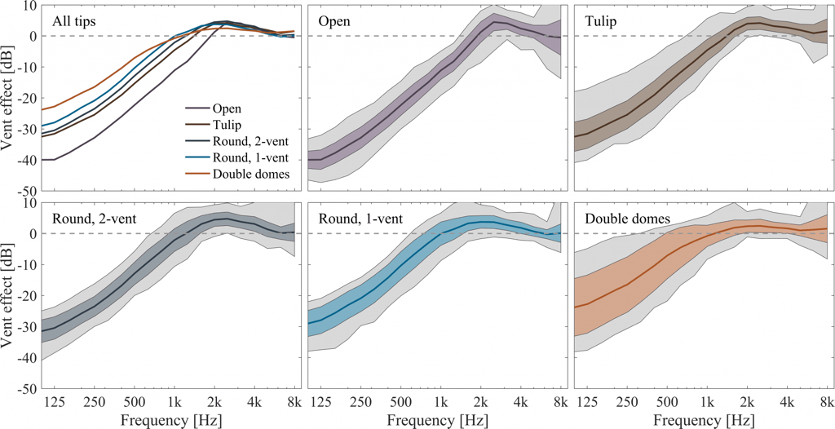
Figure 6. The mean and range of vent effects for five different types of instant-fit ear tips and domes (adapted from Balling et al, 2019).
The findings were quite different than what we have seen in the past for custom earmolds. Perhaps the most alarming are the findings for the tightest fitting dome of the group, the double domes. Historically, we would expect no more than ~2-3 dB of venting in the lows for a tightly fitted traditional earmold (See Figure 4). However, as shown in Figure 6, the instant-fit double dome has ~8 dB of venting at 500 Hz, and ~16 dB for 250 Hz. Again, going back to Figure 4, this is similar to the leakage we would expect for a vent of 3.5 mm!
Effects on Signal Processing
We already mentioned that unexpected venting could influence a target match, but there also can be negative consequences regarding directional processing and digital noise reduction. One study carefully examined how different earmold configurations would affect directional benefit, as measured by hearing impaired listeners SRT-50 performance for a speech in noise test (Froehlich & Littmann, 2019). Four different earmolds were used, differing in the degree of tightness. This is illustrated in the top panel of Figure 7. These are the average REOG findings for the four different earmolds used in the study.
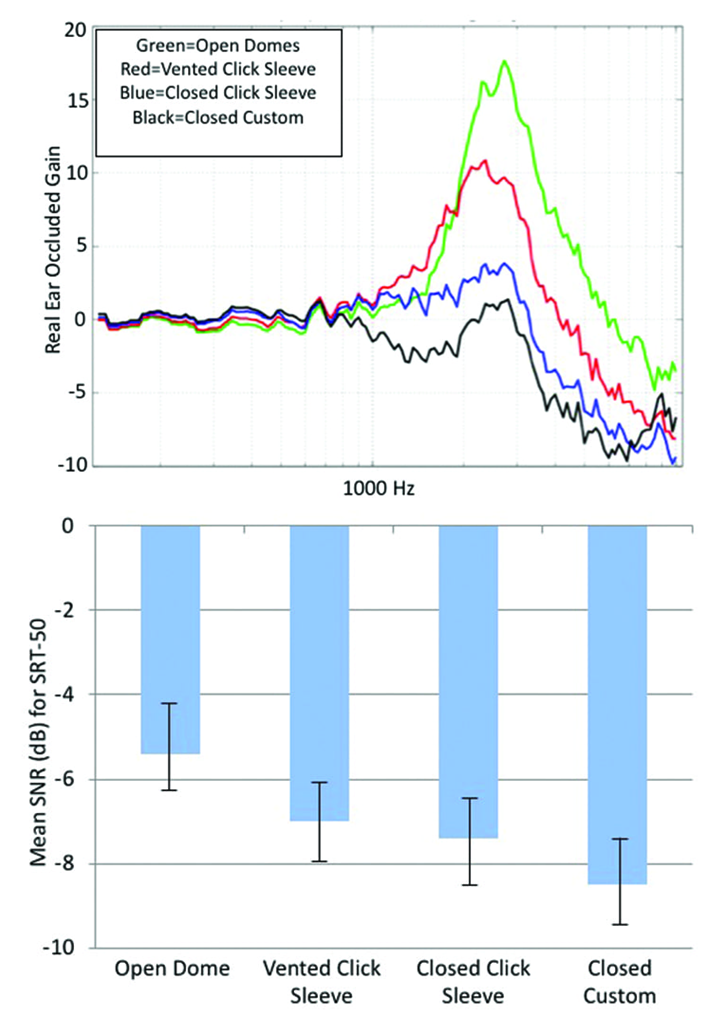
Figure 7. Top panel: The mean of REOGs of four different earmolds used in this research. Bottom panel: Mean SRT-50 findings for a speech-in-noise test with the participants fitted with the four different ear coupling systems (more negative values indicate improved performance).
The REOG is assessed with the hearing aid turned off, and measures the degree of occlusion/attenuation for a given earmold. For an open fitting, we would expect it to look very similar to the REUG—ear canal resonance and concha effects are maintained—and this is what we see for the top green curve. For a tight fitting, we would not only expect the earcanal resonance to be gone, but also attenuation effects—the earmold is acting as an ear plug. This is what we see in the blue and black curves.
More specific to our discussion here are the SRT-50 results shown in the bottom panel of Figure 7. As the earmold is opened, there is a systematic change in performance (poorer), which nicely follows the progression shown in the REOGs in the top panel. From most-open to most-closed we see an SNR improvement of ~3 dB. This advantage could improve speech understanding by 30-50%, which clearly points out the importance of proper earmold selection. The REOG is a great tool to assess the “tightness” of the fit, and should be a routine probe-mic measure.
The tightness of the fit also can have a significant impact on the effectiveness of the hearing aid’s noise reduction features. As we know, most annoying background noises, including background speech, tend to have dominant low-frequency components. If a patient is fitted with a fairly open earmold, either intentionally or unintentionally with an instant fit product, it is very likely that they will not observe the expected noise reduction effect. This is for two reasons. First, there may be very little low-frequency gain (due to venting)—we can’t “take away” gain that isn’t there. Secondly, if the fitting is mostly open, noise has a direct path to the eardrum (see the REOGs in the top panel of Figure 7). It’s important to keep this in mind when doing post-fitting counseling or tweaking of the programming. A good example would be the patient complaint of engine/road noise while driving a car. Given that this is predominantly low frequency, it is probable that changing the programing of the DNR (e.g., going from mild to strong) will have no effect when an open fitting is in place.
Conclusions—What We Think the Research Means
There are two main points here, both of which are potential misconceptions. The first, and main focus, is that instant-fit tips are much more open than commonly believed. Don’t be led astray by the label of “closed” -- even double dome ear tips, which purport to be closed, could perform more like a more open ear tip. A second issue is that it’s easy to forget the degree that an open vs closed earmold has on the benefit of sophisticated signal processing. As the research we just reviewed revealed, a sophisticated directional product with bilateral beamforming, designed to provide a 6 dB SNR advantage, may only have a 3 dB advantage with an open fitting—no better than a directional product of 50 years ago!
Finally, we believe that to ensure venting and signal processing are both “doing what you want them to do” it is best to fit devices with custom earmolds, including RIC molds when necessary, and then verify target-match with probe-mic measures. At a minimum, rely on the real-ear occluded response (REOR) to have a better understanding of how a slit-leak vent might get in the way of good noise reduction and directional performance.
V4.3: Does the Default Fitting Software Get the MPO Setting Right?
In the halcyon days of linear amplification and peak-clipping output control, there was considerable concern regarding the setting of the maximum power output (MPO) of hearing aids. In those days, the main concern was keeping the output low enough, so that the patient didn’t have to turn down gain to make loud sounds okay (Mueller & Bentler, 1994). With the birth of wide dynamic range compression (WDRC) this became somewhat less of a problem, as input signals were compressed starting as low as 40-50 dB SPL. Today, of course, WDRC is present in nearly all hearing aids, and we don’t hear so much about MPO selection—in fact, some hearing care professionals (HCPs) make no changes to the default automatically-programed hearing aid output settings (e.g., adjustment of the AGCo kneepoints). There seems to be an assumption that somehow, the “software knows” the best output setting. The focus of this section of this Volume of QuickTakes is to explain why this assumption is wrong, and can be risky.
Penalty for Making a Mistake
Getting the output right is a lot like the porridge tasting experiences of Goldilocks. It can’t be too high, and it can’t be too low. What are the expected consequences if the setting is too high? Here are the three most common:
- Patients will turn down gain. They will then not have appropriate audibility for soft and average inputs and will conclude that hearing aids don’t work very well.
- Patients only will use their hearing aids when they know no loud sounds will exist, missing out on amplification for the majority of listening situations, and will conclude that maybe hearing aids are not needed at all.
- Patients will have some initial negative experiences, and simply stop using their hearing aids.
None of these are good. So, is the solution to simply set the MPO low? This too has negative consequences, and here are the most common:
- Speech may sound distorted, as it often will be at the maximum output level.
- Speech may not have the necessary dynamics, as the peaks will be “clipped.” Music will sound “dull.”
- The range of loudness perceptions will be limited—average and loud inputs may only differ by a few dB following processing.
- For some speech-in-noise listening situations (where the input is a positive SNR), a low output setting could make the real-world SNR more adverse, by reducing the output of the speech more than that of the noise.
Again, none of these are good. Regarding the final point above, consider this scenario. Mary, who wears bilateral hearing aids, goes out to a noisy restaurant with her friend Jane. Mary has a mild-to-moderate loss and has LDLs around 105 dB (~108 dB re: 2-cc coupler). For whatever reason, however, the fitting software set her MPO to 85 dB (re: 2-cc coupler). The background noise in the restaurant is 75 dB SPL, and the gain of Mary’s hearing aids then places this noise at the 85 dB MPO. When talking to Mary, Jane raises her voice to 80 dB, to rise above the noise, and creates an SNR of +5 dB—an SNR that should allow for speech understanding, even for Mary. But . . . because of the inappropriately low MPO setting of Mary’s hearing aids, Jane’s voice also is limited at 85 dB, and the result is an SNR of 0 dB, not +5 dB. When Mary walks into her HCPs office on Monday morning and describes the problem she had in the restaurant, will the HCP’s first treatment strategy be to raise the MPO?
Software MPO Selection
As mentioned, it’s common for many HCPs to trust that the software will select the appropriate MPO for a given patient. There is of course an obvious problem with this, as we discussed in QuickTakes Volume 3.4, in that LDLs for the same hearing loss vary greatly. Research has shown that for common sensorineural hearing losses of 40-60 dB, patients’ LDLs will vary by 50 dB, with only ~1/3 within +/- 5 dB of the average (Bentler & Cooley, 2001). But there appears to be even bigger problems than this. Research from 2008 examined the default settings for the six leading companies Mueller et al, 2008). The results showed that for some frequencies, default MPO values differed by as much as 18-21 dB among manufacturers for the same audiogram, and for some manufactures, the measured 2-cc coupler MPO was significantly different than that displayed in the fitting software.
Fitting software changes frequently, and this study has been repeated recently (Mueller et al, 2021b). Premier mini-BTE receiver-in-canal (RIC) hearing aids from the Big Six hearing aid manufactures were used. MPO measures, using a 90 dB SPL swept tone were conducted in the text box using the HA-1 2-cc coupler with TRIC adapter of the Audioscan Verifit2. The hearing aids were programmed for the audiogram shown in Figure 8, to the default settings for each manufacturer’s NAL-NL2 algorithm. Also shown on the Figure 8 audiogram are the “NAL predicted” LDLs, taken from the NAL-NL2 stand-alone software.
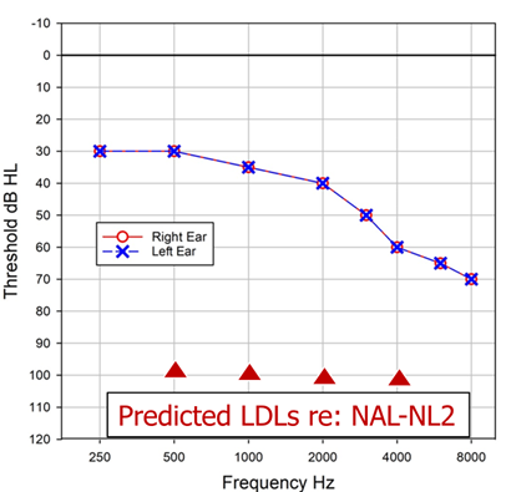
Figure 8. Audiogram used to program all hearing aids. Also shown are the predicted LDLs from the NAL-NL2 stand-alone software.
The hearing aids were all programmed for the standard audiogram to the manufacturer’s default NAL-NL2 fitting algorithm. The MPO measured findings for the six different products for this testing are shown in Figure 9. Consider that based on the audiogram, we would expect this patient’s LDLs to be around 100-105 dB, yet, except for one product (top orange tracing) the maximum output is much lower. In fact, notice that several of the products have MPOs around 80 dB SPL—limiting useful headroom by 20 dB or more—illustrating that the unfortunate case study we presented earlier has a high probability of occurring. The authors concluded after some empirical testing that these low MPOs were due to limiting from the WDRC, not the AGCo kneepoints (i.e., they found that the MPO increased significantly with increase in gain, which doesn’t happen with AGCo limiting). Additionally, they report that the underlying issue was that the manufacturer’s NAL-NL2 default fitting was not the true NAL-NL2; an under-fitting to the NAL-NL2 of 10 dB or more was present for all the products except for the one product, that not surprisingly, also had the reasonable MPO, the top orange curve. This under-fitting of the NAL prescription, of course, often has been reported in the literature before (see Mueller, 2020, for review). Now, we would expect that if the HCP did probe-mic measures, and programmed the hearing aids to the true NAL-NL2 based on the targets of the probe-mic equipment, we then would observe more appropriate MPO values. But what if . . . a probe-mic fit-to-target never happened?
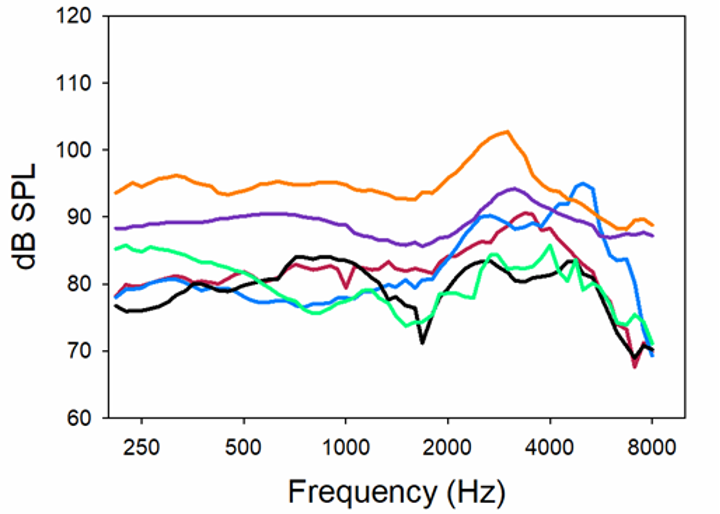
Figure 9. MPO (90 dB swept pure tone) for six different premier products programmed to the respective manufacturer’s default NAL-NL2 for the audiogram shown in Figure 8 (adapted from Mueller et al, 2021b).
In a second part of this same research study (Mueller et al, 2021b), the researchers examined what MPO software setting was selected for an NAL-NL2 fitting by each of the manufacturers for the sample audiogram (See Figure 8). As we mentioned, the predicted MPO values from the NAL-NL2 software are shown on the audiogram, so logically, we would expect values close to these. But this was not the case.
Figure 10 illustrates the deviation of the manufacturer’s software values from the expected NAL-NL2 MPO prescription (stand-alone software) for the six products. As shown, one product is ~5 dB above the NAL-NL2, and another is ~5 dB below, but the others vary substantially from the NAL-NL2 prescription values. If we look at the extremes, Aid D vs. Aid E, we see a curious difference in the software-specified MPO settings of about 25 dB. Recall that the researchers did not enter LDLs, so this difference is not related to the fitting software using, or not using entered LDL values. These data, along with the other findings of this research clearly show that it’s very risky to rely on software default MPO settings.
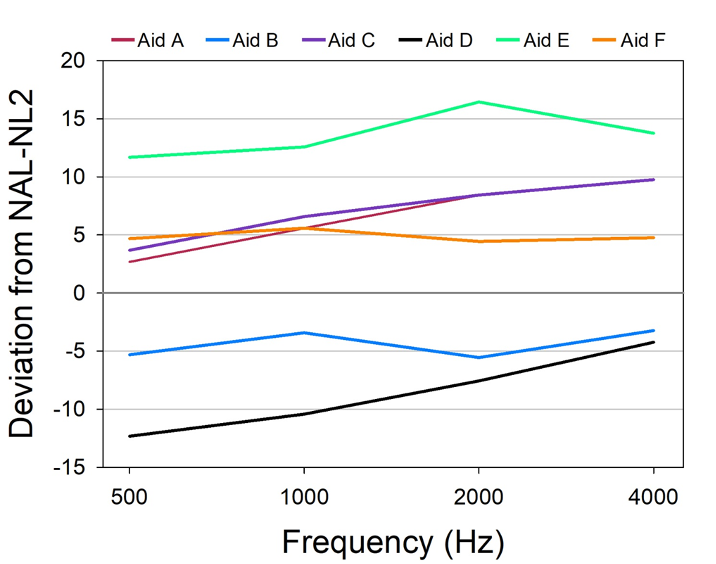
Figure 10. MPO values (deviation for the prescribed NAL-NL2) shown in the fitting software for six different premier hearing aids for an NAL-NL2 figure. Audiogram entered was that shown in Figure 8. No LDLs were entered (adapted from Mueller et al, 2021b).
The Solution
The solution to the haphazard results of a software-driven fitting, is simply to follow published fitting guidelines and what is stated in the APSO hearing aid fitting standard (Mueller et al, 2021a). The recommended procedure to determine the optimum MPO settings for a given patient is to first measure his or her frequency-specific LDLs (pulsed pure tones; two or three frequencies/ear), convert these HL values from HL to 2-cc coupler using the appropriate RETSPLs, and then use these converted values to set the desired MPO (usually controlled by the kneepoints of the output compression—AGCo; see Research QuickTakes Volume 3.4 for software example).
Modern hearing aids have multiple output compression channels, so the MPO can be shaped much the same way as we program gain to match prescriptive targets. The MPO settings then can be verified with probe-mic measures using the REAR85; subjective loudness judgments also can be conducted (Mueller et al, 2017; Taylor and Mueller, 2012; Cox, 1995). The REAR85 usually is measured with the hearing aids set to “use-gain,” in some cases, with the gain set just-below-feedback, or at max-gain if no feedback is present. The goal is to have the REAR85 values fall just slightly below the measured LDLs (which will be displayed in earcanal SPL on the probe-mic display, assuming that they were entered). This setting also should result in a loudness rating of “Loud, But Okay” from the patient for running speech. If the MPO is lower than desired, and it is determined that this is because of the WDRC, it may be possible to increase gain-for-loud (the 75-dB-SPL speech input signal), and still have “okay” patient loudness perceptions.
Conclusions—What We Think the Research Means
We all can agree that he programming that hearing aid fitting software automatically provides is helpful in making the overall fitting process more efficient. Often this is referred to as “first fit,” which is an appropriate term, as typically, it is far removed from the desired “final fit.” The research we have reviewed has shown this is particularly true for the setting of the MPO.
It is somewhat ironic, that for many years research regarding the setting of the MPO focused on not making loud sounds too loud. In fact, with the advent of OTC devices, there is a renewed outcry that when MPOs are too high, patient harm can occur. We believe those worries about MPO being set too high in OTC devices, while possible, are a bit overstated. In contrast, today the biggest concern might be making loud sounds too soft, reducing valuable headroom, which can affect performance in adverse signal to noise ratio listening conditions. The overall hearing aid fitting goal is straightforward: soft sounds need to be audible and loud sounds need to be loud, but not uncomfortably loud— the patient’s entire residual dynamic range should be used. Clearly, this will not happen automatically, and careful programming by the HCP is critical.
V4.4: How Accurate are Hearing Aid Environmental Classification Systems?
A question asked by many audiologists over the decades is this: should hearing aids have the same gain, output and feature activation for all listening situations? Probably not is the usual answer. Early efforts regarding the modification of the hearing aid frequency response focused on less gain for listening situations with background noise, usually the most dominant in the low frequencies. Noted acoustic engineer Samuel Lybarger reported on a hearing aid feature to reduce low-frequency gain as early as 1947. The most notable “special feature,” a hearing aid with a directional microphone, was introduced in the U.S. in 1971, and was studied extensively in the 1970s. Overall findings revealed benefit for speech understanding in background noise (Mueller, 1981). The directional microphone provided a natural roll-off of low frequencies, and of course, also reduced background sounds (to a small degree) from behind the user. Today’s hearing aids accomplish the same effect, in a much more effective and sophisticated way using two omnidirectional microphones.
In addition to directional technology, various types of noise reduction strategies also were introduced over the years with the same principle of reducing low-frequency noise (using input compression; sometimes termed “BILL” processing: Bass Increase Low Levels). Once digital hearing aids were introduced, this was accomplished much more effectively using modulation-based detection algorithms. An underlying issue, however, was that some of these listening-in-noise features needed to “switched on” by the hearing aid user. This led to manufacturers offering hearing aids with multiple programs—the notion was that a patient could have a listening in quiet program, a listening in noise program, and maybe a third program for music. While the basic idea of switching to a favorite listening program for a specific listening situation sounds reasonable, research clearly showed that the majority of patients never switched. So, what is the fix?
Thanks to digital processing, instruments became automatic—that is, based on the signal classification system, they automatically would alter the processing scheme; the first such instruments would switch between omnidirectional and directional processing (Powers & Hamacher, 2002). As the years advanced, we saw automatic switching based on how the signal was analyzed, including mainly the development of adaptive polar patterns (which could even track a given noise source; Ricketts et al, 2005), and also the ability to switch the directional focus from the look direction to the back, or to one side or another (Mueller et al, 2011, Chalupper et al, 2011).
As the algorithms advanced, automatic switching was not just for directional technology, but processing could be programmed to automatically change for speech in quiet, speech in noise, noise, music, and even when in a car. No longer was directional processing and noise reduction the star of the show—the star was the signal classification system. But was this rise to fame deserved? Do HCPs maybe have too much faith in these “automatic” classifications? That is the potential misconception that we’ll discuss in this section.
Signal Classification System
If you happen to be even a casual fan of football, an analogy that works pretty well is to think of the signal classification system as the head coach. Depending on the score, field position and what down it is, the coach sends in different players. While in football these players may be a speedy running back, a bruising fullback, a blocking tight end or a kicker, with hearing aids, the players tend to be directional processing, noise reduction, feedback suppression, wind reduction, just to name a few. And just like the coach’s decision, which doesn’t always work as planned, the same can be true for hearing aids, simply because, for hearing aids, artificial intelligence simply isn’t as good as the human brain.
How Do These Classification Systems Work?
A great review of the working of signal classification systems was written by audiologist Todd Ricketts (Ricketts et al, 2019; Chapter 10). He describes some of the acoustic features used by hearing aids to classify different input signals:
- Both overall level and band-specific level
- Spectral peaks and spectral location of base envelope modulation rates
- Channel specific amplitude depth and rate; co-modulations
- Spectral and temporal signature of both lower and higher-level portions of the input signal
- Relative amplitude of portion of the input signal estimated to be speech versus that estimated to be noise (i.e., the SNR of the input signal)
The goals for an effective sound classification system would then include:
- The input signal is correctly identified.
- The desired processing algorithms are activated by using an accurate set of decision rules.
- The processing algorithms that are activated produce positive outcome than if they had not been activated.
- The processing algorithm activated does not produce artifact, or interact negatively with other algorithms.
Given the complexity of the identification process and the subsequent algorithm implementation necessary in sound classification systems, it seems reasonable that they might not “get it right” all the time—and they don’t.
Research Findings
There have been several studies that have examined the accuracy of classification systems, and compared performance across instruments from different manufacturers. Some of these studies have been conducted by one of the Big 6 manufacturers, and we suspect that they purposely choose input signals that were typically correctly classified by their instrument. Relative findings for the other instruments compared, however, are still somewhat meaningful. In one of these studies, conducted in 2017, accuracy was compared for the premier hearing aids of the Big Six manufacturers (Cui & Groth, 2017). As we would expect, all products were very good at identifying quiet, and speech-in-quiet. Noise (a hand mixer was used in this study) was identified as noise for 5 of the 6 instruments, and 5 of the 6 also were accurate in identifying speech babble. One of the most important acoustic scenes to identify is speech in noise, which also happens to be the most difficult. Two products were quite good (~90%), but the other four had accuracy of only ~40-60%.
Four of the six products had music as one of the classification categories (presumably to automatically activate a music listening program). Two of these instruments were quite accurate in identifying both pop and classical music (~90% or better). One product was 95% accurate for pop music, but only 35% for classical. And the fourth product had a dismal 5% accuracy for pop, and 55% for classical. Clearly, for many categories of sounds, there were large differences among products.
Recent Research
We would expect that like all hearing aid features, the accuracy of the signal classification algorithms probably improves when a new generation of a given product is introduced. There has been at least one comparative study of signal classification accuracy conducted in the past few years (Yellamsetty et al, 2021). In this study, the researchers compared the classification schemes among five premium hearing instruments from different manufacturers. The hearing aids were programmed to each company’s default proprietary algorithm. Twenty-eight acoustic scenes representing various prototypical environments were presented to the five devices, which were mounted on an acoustic manikin. The scenes varied in content, overall SPL and SNR. One category was music, which was from jazz artist Ella Fitzgerald, “My Baby Just Cares for Me,” presented in stereo from loudspeakers at 45° and 315°. We’ll review three of their acoustic scene categories here.
The first category is a man and woman having a conversation in quiet. The accuracy for the five instruments is shown in Figure 11. (Note the closer the bars are to 100% the more accurate the classification system is when compared to how a human being would judge the listening situation). It would seem that “speech in quiet” would be one of the easier acoustic scenes to identify but observe that it didn’t seem to be for Hearing Aid C, once the overall level reached 70 dB, and also not for Hearing Aids C and D for the 85 dB input. Hearing Aid C classified the louder speech-in-quiet as speech-in-noise. This would lead us to believe that this product relied heavily on the overall SPL, and less on the spectral content of the signal. Three of the five products had good accuracy for this acoustic scene for all input levels.
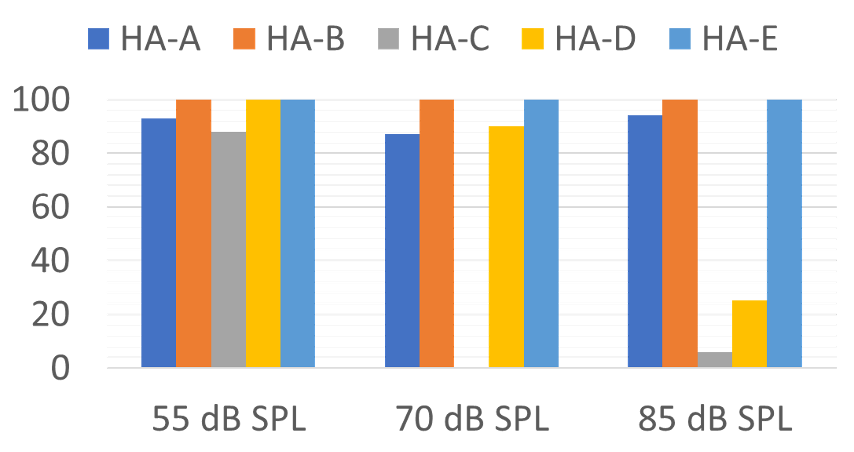
Figure 11. Accuracy for the five different products of identification of two individuals talking in quiet for three different overall-SPL levels (Adapted from the data of Yellamsetty et al, 2021).
The second acoustic scene that was compared was speech-in-noise. This was a back and forth male and female conversation at a noisy food court—SNR=+5dB, presented at three overall-SPL levels. These finding are shown in Figure 12.
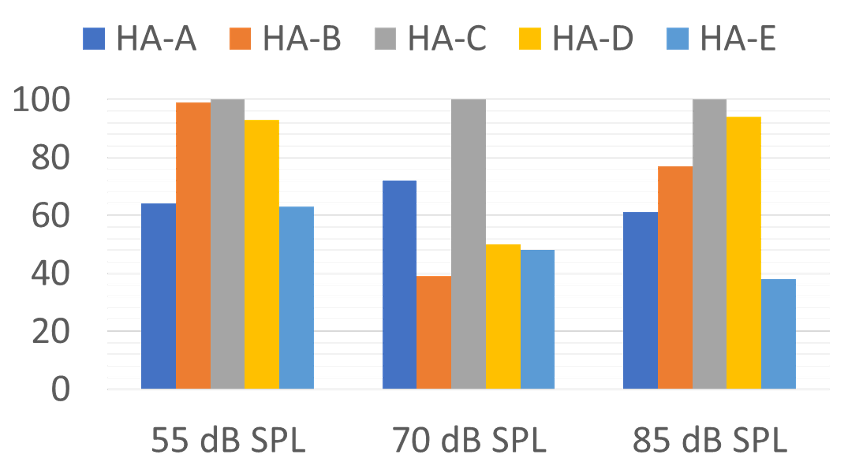
Figure 12. Accuracy for the five different products of identification of two individuals talking in background noise (SNR=+5 dB) for three different overall-SPL levels (Adapted from the data of Yellamsetty et al, 2021).
Not too surprisingly, Hearing Aid C was now the standout product for this classification. Note, however, that once the overall level was 70 dB or higher, several instruments only had correct identification of ~50%. This is concerning, as many speech-in-noise situations that our patients experience have an overall level of 70 dB or greater. This of course could have a significant impact on our post-fitting counseling. A patient returns after a few weeks of hearing aid use, complaining that he is having the same trouble in background noise with his new hearing aids with the world’s best directional processing as he was having with his old hearing aids. Before the HCP starts to grab his or her mouse, or assume that the patient’s expectations simply are too high, one must consider that maybe the problem is because the hearing aids are classifying speech-in-noise as speech-in quiet (which usually was the mistake made in this research), and directional processing was not activated.
The final category from this research that we’ll review is identification of music. Those results are shown in Figure 13.
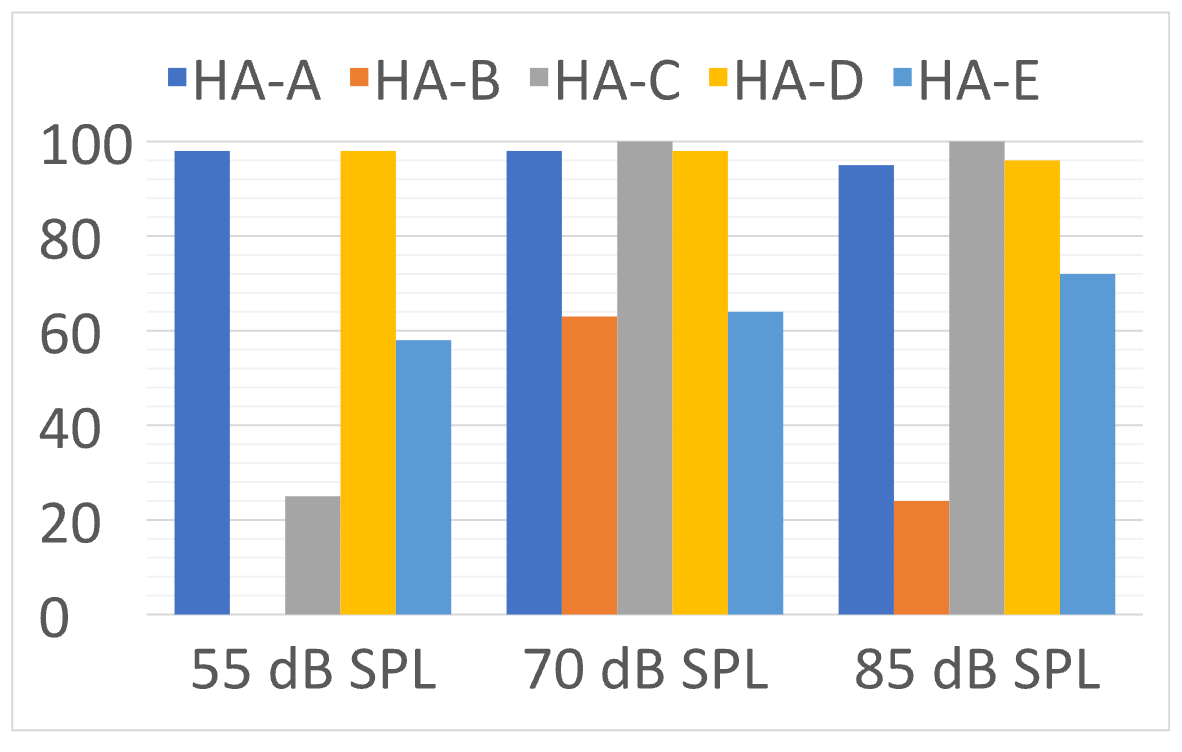
Figure 13. Accuracy for the five different products of identification of music (jazz with vocal) for three different overall-SPL levels (Adapted from the data of Yellamsetty et al, 2021).
Note that Hearing Aid A and D had excellent accuracy for all levels of music. On the other hand, Hearing Aid B identified soft music as speech-in-quiet 100% of the time. When the music was loud, Hearing Aid B typically identified it as speech-in-noise. The variability for music identification shown here is similar to what we reported earlier from previous research.
A somewhat unrelated, but interesting caveat is that maybe the poor classification of music by some instruments doesn’t really matter. Recent research, with current premier hearing aids, revealed that in some cases, the music program was rated no better than the speech program for listening to music, and for 2 of the 6 products, it was significantly worse shown (Sandren & Alexander, 2023). This was for the manufacturer’s default music program—we hope that the HCP’s version would yield better results.
On the Other Hand
The results from the previously discussed research are somewhat discouraging and do point out that some products are better than others, and no product gets it right all of the time. But what is the alternative? Go back to having the patient switch between programs? Recent research has compared automatic switching versus patient preferences (Searchfield et al, 2018). Four different sound scenarios were used: speech in quiet, noise, loud noise and in a car. The users preferred program for each was compared to that selected by the automatic classifier. The researchers report that the participants’ preferences for the different scenarios varied considerably between and within sessions. And most importantly, based on the results of the Hearing in Noise Test (HINT), an advantage was observed for the automatic classifier over the participant’s manual selection for speech in quiet, loud noise and car noise.
Conclusion, and What we think this Means
Automatic classification systems that drive the selection of different signal processing are in general, a benefit for the patient—in theory, allowing the hearing aid user to move from one acoustic scene to another with optimum processing for that situation. The research findings discussed here, however, suggest that the accuracy of this feature differs across manufacturers, and some products tend to make serious mistakes—classifying speech-in-noise as speech-in-quiet. While others, including Signia, tend to stay in the Universal program and don’t automatically switch into other programs as other manufacturer’s devices. The HCP might want to consider this in product selection, and at the least, during post-fitting counseling.
For some patients it is advisable to provide them with a manual switch or button on the hearing aid, a remote control or smartphone app that allows them to override any “mistakes” the signal classification system might make. And finally, while the classification systems might not always get it right, the end result still might be better than what hearing aid users manually would select for themselves.
V4.5: Are There Reasonable Alternatives to a Verified Prescriptive Fitting?
Survey after survey has shown that many, if not most HCPs prefer to use their favorite manufacturer’s proprietary fitting, rather than a validated fitting such as the NAL-NL2. It seems reasonable to assume, that this is because that they believe that the proprietary fitting is best for the patient. In this section of our paper, we are going to talk about three different potential misconceptions related to using a prescriptive fitting approach:
- Is a validated method such as the NAL-NL2 really the best solution for deciding the aided gain and output for the majority of patients?
- Is the manufacturer’s proprietary algorithm a good fitting choice for many patients?
- If the NAL-NL2 algorithm is selected in the fitting software, is it probable that correct NAL-NL2 output also will be present in the earcanal?
Evidence for the NAL-NL2
Let us first say, that we could be talking about the DSLv5.0 fitting procedure, as it also has considerable supporting research validation. The NAL-NL2, at least for adults, tends to be the most commonly used approach, and for that reason we’ll focus on this prescriptive method. Moreover, for adults, the prescribed output for the DSL and NAL methods is very similar (Johnson and Dillon, 2011—See Table 1).
A fundamental point is that when programming a hearing aid, you have to start someplace. Why not with a validated approach? In his 2012 article, Earl Johnson reviewed the problem of going rogue when selecting the best frequency response for a new hearing aid user (Johnson, 2012). He points out that even for a very experienced hearing care professional (HCP), who would only select frequency responses that in theory could simultaneously provide the best speech intelligibility, acceptable loudness and sound quality, for a 12-channel instrument there still would be 1,430 possible frequency responses from which to choose for any particular hearing aid user. And that is just for one input level. This is why we need a good starting point.
The NAL fitting method has been available for nearly 50 years, and considerable research has evaluated its effectiveness (Mueller, 2005) The current version, NAL-NL2, has been available since 2011. The NAL-NL2 is a modification of the NAL-NL1, which was empirically studied for over 10 years. Following this extensive research with NAL-NL1 fittings, the following changes were made for the NAL-NL2 implementation:
- Overall reduction of gain of ~3 dB.
- Slightly less gain for females than for males.
- Less gain for inexperienced users.
- Less gain for a bilateral fitting.
- Slightly higher compression ratios.
Following its introduction, the effectiveness of the NAL-NL2 prescriptive method was evaluated in a study where the participants used trainable hearing aids which could be trained for soft, average and loud inputs independently (Keidser & Alamundi, 2013). Following three weeks of training, the researchers examined the new trained settings for both low and high frequencies, for six different listening situations that were categorized by the hearing aids. On average, the participants did tend to train down from the NAL-NL2 for all six situations, but only by a minimal amount. For example, for the speech in quiet condition for the high frequencies, the average value was a gain reduction of 1.5 dB (range = 0 to –4 dB), and for the speech in noise condition, there was an average gain reduction of only 2 dB (range =+0 .5 to –4.5 dB). The trained gain for the low-frequency sounds for these listening conditions was even closer to the original NAL-NL2 settings.
In a recent study, researchers evaluated the outcomes of self-fitting hearing aids that were initially set to 0 dB REIG (Sabin et al, 2020). The real-world effectiveness of the self-fitting approach was evaluated via a month-long field trial. Following the trial, there was a strong correlation between user-selected and audiologist NAL-programmed gain. On average, the user-selected gains were only 1.8 dB lower than those selected by the audiologists, based on the NAL-NL2 prescription. These real-world data, and the years of research leading up to the launch of NAL-NL2, clearly show that since we have to start someplace, this prescriptive method would be a good place to be. As we point out in the following sections, considerable data also exists showing the benefit of using the NAL-NL2 compared to common alternative choices.
Proprietary Fittings Methods
If the NAL-NL2 is as good as we say, then why would any HCP want to program hearing aids differently? Good question. Going back to the early days of programmable hearing aids, it has been popular for manufacturers to have their own “proprietary” fitting. Figure 14 is an example of the real-ear (average of 16 ears) proprietary fitting for the premier hearing aid from five different manufacturers (Sanders et al, 2015). The NAL-NL2 prescribed gain is shown for comparison.
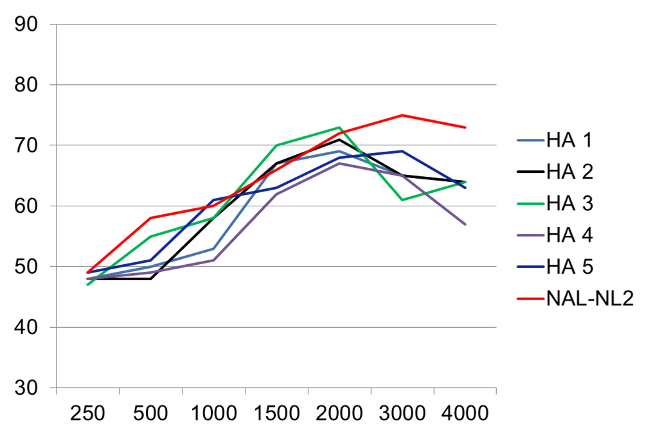
Figure 14. Average real-ear output (n=16; typical mild-moderate downward sloping audiogram) for the proprietary fitting for the premier product of five major manufacturers (adapted from Sanders et al, 2015).
While the output of the products is somewhat different, they all have two things in common: reduce gain for all frequencies and reduce gain to a greater extent as the frequencies become higher. As a result, the average SII is about ~.15 to .20 lower than that of the NAL-NL2.
One might ask why manufacturers would promote fitting approaches that significantly differ from the NAL-NL2? We can think of four reasons:
- Marketing hype. Having a “proprietary” fitting makes a given product sound more unique and a little mystical (e.g., “these special features only work with our proprietary algorithm”—not true by the way). Minimize feedback. Less gain in the highs means less feedback problems—the feedback reduction algorithm does not need to be as good as if you are fitting to the NAL-NL2.
- Global sales. These algorithms are used around the world. HCPs in different countries have different styles, procedures and sales techniques. When the NAL-NL2 is fitted to a new hearing aid user, considerable counseling often is required, especially regarding the soft sounds that are now audible.
- Patient acquiesces. New hearing aids users generally prefer hearing aids that don’t sound like hearing aids. The best way to accomplish this is to provide very little gain. If the HCPs only verification method is to hear “this sounds natural” from the patient, that is more likely to happen with a proprietary fitting than with an NAL-NL2 programmed product.
Given the popularity of proprietary fittings vs. the science behind the NAL-NL2 algorithm, it’s no surprise that comparing the two approaches has been a popular research undertaking—see Mueller et al (2017) for an extensive review. We’ll briefly discuss a couple key articles here.
Mike Valente and colleagues (2018) conducted a well-designed random control trial using participant cross-over (all participants wore hearing aids with the two different programs in the real world). As expected from our previous discussion, the proprietary fitting differed considerably from that of the NAL-NL2. As shown in Figure 15, the average deviation below the NAL fitting was as great as 20 dB at 4000 Hz.
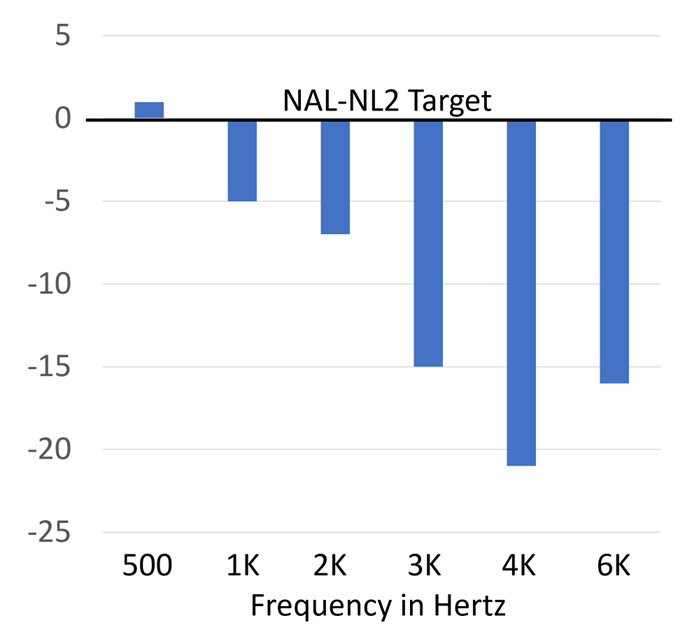
Figure 15. Average real-ear output (soft speech input) for the proprietary fitting from the manufacturer used in this study, compared to a verified NAL-NL2 fitting (0 dB horizontal line) (adapted from the data of Valente et al, 2018).
Given the large reduction in gain from the NAL-NL2, one might expect poorer speech understanding with the proprietary fitting—this indeed was true. Figure 16 shows the speech recognition (percent correct in quiet) for the two different fittings (recall this was a cross-over design, so participants were the same for both sets of data). The boxes on the chart represent the 25th to 75th percentiles. Note that when using the NAL-NL2 fitting, the 25th percentile was superior to the 75th percentile for the proprietary. Moreover, note that the bottom portion of the range for the proprietary was 40% below that of the NAL. These researchers also found significant improvement in the real world for the NAL fitting based on APHAB ratings, and at the conclusion of the real-world trial, 19 of the 24 participants favored the NAL.
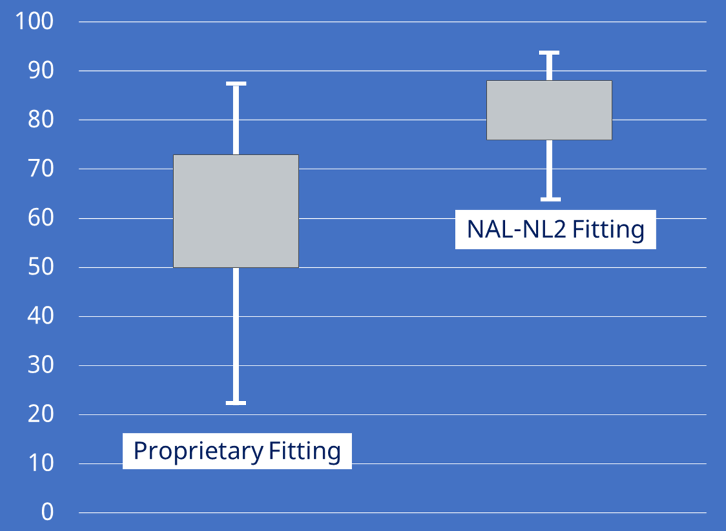
Figure 16. Average speech recognition (in quiet) for the NAL fitting vs. the proprietary. The boxes represent 25th to 75th percentiles (adapted from Valente et al, 2018).
The results displayed in Figure 16 are for speech in quiet, but research has shown that programming less-than-ideal gain can have an even bigger impact on speech understanding in background noise. One study (Leavitt & Flexer, 2012), using the QuickSIN, compared an NAL fitting to each company’s proprietary algorithm for the premier hearing aids of the Big Six manufacturers. The average SNR differences (improvement) resulting from the NAL-NL2 fitting are shown in Figure 17.
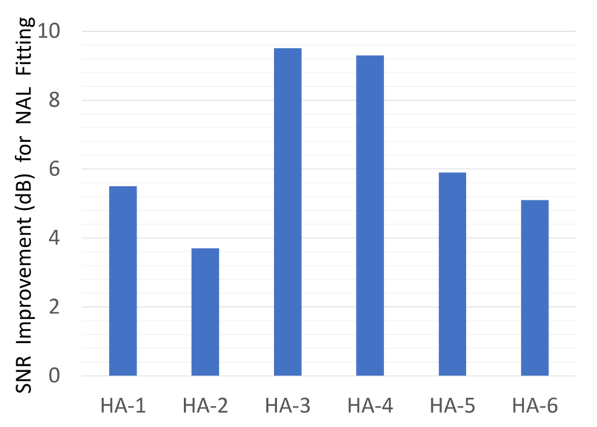
Figure 17. Shown are the average SNR (dB) benefit values (based on aided QuickSIN) when participants were fitted to hearing aids programmed to the NAL vs. the given manufacturer’s proprietary algorithm (adapted from the data of Leavitt & Flexer, 2012)
The improvements in SNR shown in Figure 17 cannot be taken lightly. Consider that with sophisticated directional technology and noise reduction, we might see an SNR advantage ~5 dB (compared to omnidirectional). Here, we are seeing an average benefit across products of ~6.5 dB SNR, simply due to programming the hearing aids correctly. For two of the products, the average NAL-NL2 programmed benefit was nearly 10 dB! It is baffling why so many HCPs have a love affair with proprietary fittings.
Click-And-Fit NAL-NL2
There appears to be some that believe that if the NAL-NL2 is selected in the fitting software, then of course, the correct SPL will be present in the ear canal. No need for real-ear verification. You simply “click” on the NAL and you’re finished—which is why this has become known as the click-and-fit method. The fact that this will not result in a true NAL-NL2 fitting should not be a surprise to anyone. Here is a little history:
- 2003: Research showed that real-ear gain for 2000-4000 Hz was an average of 7-12 dB below simulated target-match gain (Hawkins & Cook, 2003).
- 2007: Probe-mic testing on 42 ears showed that hearing aids programmed to default NAL failed to match targets by >10 dB in 64% of cases (Aazh & Moore, 2007).
- 2012: Probe-mic testing on 51 ears showed that hearing aids programmed to default NAL failed to match targets by >10 dB in 71% of cases (Aazh et al, 2012).
- 2015: Hearing aids programmed to four different manufacturer’s NAL-NL2 fell below target by an average of 8-12 dB in the high frequencies (Sanders et al, 2015).
Now, one might hope that things have gotten better since these studies were conducted. That does not seem to be the case. Figure 18 shows the results of two more recent studies (Amlani et al, 2017; Pumford & Mueller, 2020)—the real-ear deviation from the NAL-NL2 algorithm is shown for specific frequencies. These data are from two different products. It appears that one manufacturer reduces gain by an equivalent amount across frequencies, whereas the other has the greatest gain reduction in the high frequencies, much like the proprietary fittings.
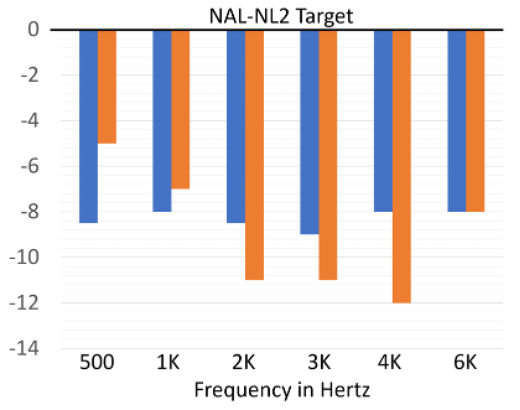
Figure 18. Data from two different studies showing real-ear variance from the NAL-NL2 when the NAL-NL2 was selected in the fitting software (Amlani et al, 2017; Pumford & Mueller, 2020).
Where the mistake seems to be the largest for all manufacturers is for soft speech inputs, which, as we’ve discussed in previous QuickTakes articles, is probably the most important input level to get right. The magnitude of this common error is illustrated in Figure 19, showing the speech mapping results (ISTS at 55 dB SPL) from 16 different ears when the NAL-NL2 was selected (Mueller, 2020). Some reports have hinted that the common mismatch to target simply is because of “individual ear differences”, but if that were the case, we’d see some fittings above and some fitting below the desired target (due to bigger and smaller RECDs). Instead, note that all the fittings are below target, many by >10 dB.
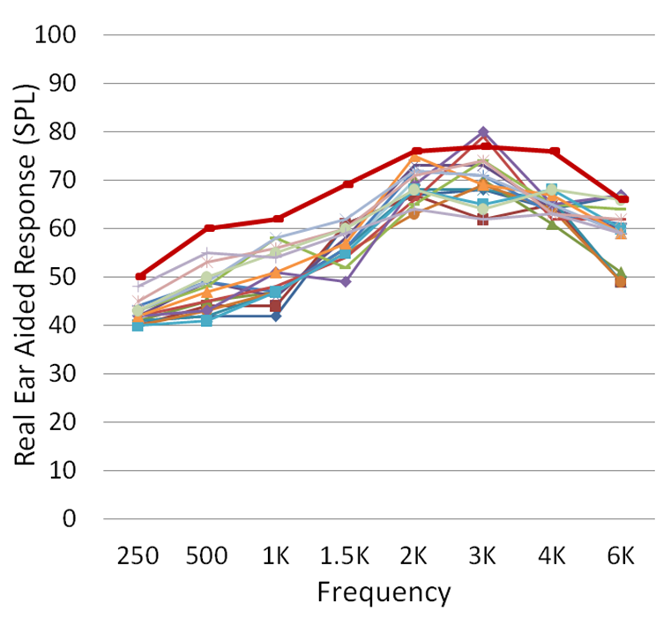
Figure 19. Speech mapping findings (n=16) obtained when the NAL-NL2 was selected in the fitting software (ISTS input; 55 dB SPL). Hearing aids programmed for a typical mild-moderate downward sloping audiogram (adapted from Mueller, 2020).
Why isn’t the NAL-NL2 in the fitting software the true NAL? Our best guess is that it has been tweaked for many of the same reasons that proprietary algorithms exist, which we discussed earlier. The solution of course is simple, and that is to use the targets found in the software of probe-mic equipment, which are correct.
Conclusion, and What We Think This Means
We started this section by stating three possible misconceptions. Research clearly supports the following conclusions:
- The NAL-NL2 fitting algorithm is a starting point supported by research, and gives the patient a good opportunity to obtain optimum benefit with hearing aids, through careful blending of audibility, loudness restoration, sound quality and overall acceptance.
- Proprietary methods repeatably have been shown to be inferior to a NAL-based fitting method for both speech understanding and overall satisfaction.
- Simply selecting NAL-NL2 in the fitting software will not result in a NAL fitting in the real ear.
So, what all this means is that real-ear verification of the NAL-NL2 (or DSLv5 if that’s your prescription of choice) is necessary for all hearing aid fittings - at the very least as a reasonable stating point. Yes, we said that back in QuickTakes Volume 3.5, but sometimes repetition is good.
V4.6: Are there Other Ways to Determine the “Best” Fitting?
As we have now mentioned, research evidence clearly shows that optimum hearing aid benefit and satisfaction will be obtained when a prescriptive fitting is used, and this fitting is verified with probe-microphone measurements. Case closed. We know, however, that the majority of hearing care providers (HCPs) do not follow this basic component of Best Practice. We must then assume that they have the belief that something better exists. So what other options are there to determine the “goodness” of the fitting? There actually are several, and we’ll touch on five of them in this final section of QuickTakes Volume 4.
Aided Speech Testing
Yes, at one time, roughly 50 years ago, aided speech testing was the cornerstone of the hearing aid evaluation. The patient was tested with different hearing aids, and the product with the best speech recognition score was considered the best for the patient. While the flaws of this approach had been pointed out going back to 1960, the procedure tended to limp along, even though more research revealed problem issues (Mueller & Grimes, 1983). About the time that probe-microphone measures were first introduced, there was one article by Brian Walden and his Walter Reed colleagues (1983) that clearly summed up the problems associated with this procedure. The authors listed five assumptions that must be met if repeated speech testing was used:
- Significant differences truly exist among hearing aids from different manufacturers, or for the different programming of the same hearing aid. That is, the patient must perform significantly better with one product (programming) than another.
- Observed differences in speech test results among different aids and or programming will vary among patients. That is, one product/programming cannot be superior for all patients.
- Performance differences among instruments/programming can be measured reliably by the speech test that is used for comparison.
- Relative comparative testing for different products/programming remains stable over time (e.g., a new hearing aid user will continue to perform the best with the same products/programming following a period of adjustment and acclimatization).
- It must be assumed that the product/programming that was superior in the clinical speech testing is indicative of that patient's relative performance with those instruments in daily living.
In a well-designed study, the authors found that essentially, none of these assumptions were met. Here is an example that relates to both assumptions #2 and #3. Let’s say that an HCP wants to determine what is the best high frequency gain for a patient. She decides to do comparative speech testing with the hearing aids programmed differently (high frequencies varying by 5 dB). For such a measure, it’s critical to use a speech-in-noise test and an adaptive procedure, as otherwise, the ceiling effect could obscure true differences. The most popular adaptive speech-in-noise test is the QuickSIN, and in Table 1 we have displayed the critical differences, depending on the number of lists used. Some HCPs only use one list, but let’s assume two lists are used. As shown, the aided SNR difference between the two programmed settings would have to be 2.7 dB (95th percentile). Add to this, the fact that the test-retest reliability for the QuickSIN (2 lists; 95th percentile) is 1.9 dB. This clearly points out that the probability of finding a significant difference between the two programmed settings would be very unlikely, unless the differences in programming were outside of the range of clinical reason.
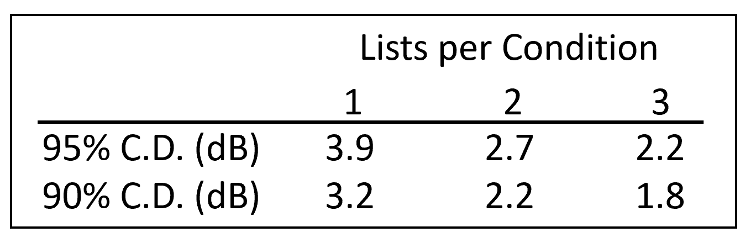
Table 2. Critical differences in dB (90% and 95%) for the QuickSIN test listed relative to the number of lists used for each condition.
Given that comparative speech testing is not effective, a somewhat different approach would be to conduct speech testing to determine if optimum performance for a given patient had been achieved. Again, we would have to eliminate the possibility of a ceiling effect, so an adaptive speech-in-noise test would be selected. Let’s take a patient who had an unaided QuickSIN score of 12 dB SNR, and when aided with the initial programming had a score of 8 dB SNR. Better yes, but optimum? How would you know, that if you added more high frequency gain, the score wouldn’t be 6 dB SNR? Or maybe, a 4 dB SNR would be possible with other adjustments? The only way for this approach to work, would be to conduct considerable repeat testing, more than most HCPs or patients would endure.
The bottom line is that speech testing, when applied with clinical restraints, is a poor way to determine the best fitting for a patient. That is not to say, however, that it can’t be used for patient counseling after the hearing aids have been fitted appropriately. Doing unaided vs. aided speech-in-noise testing (at a soft level like 50 dB SPL) is an excellent way to demonstrate the benefit of hearing aids—something not immediately obvious with probe-mic measures. We talk about this in QuickTakes V 6.2.
Sound Field Aided Gain or Functional Gain
Another alternative to real-ear verification is to conduct aided sound field testing. This in fact was the procedure used in the 1970s to verify prescriptive fittings such as the Berger method (Berger, 1976). This procedure, however, always has been fraught with problems, more so today than back then because of hearing aid technology advances. Here are just a few:
- The sound field must be calibrated correctly (many are not).
- The non-test ear must be masked using an earphone.
- The expansion circuit of the hearing aid might suppress the tones the patient is trying to hear.
- The ambient noise of the room (amplified by the hearing aid) might mask the tones that the patient is trying to hear.
- The WDRC of the hearing aid might suppress the tones that the patient is trying to hear.
- The feedback reduction feature of the hearing aid might suppress the tones that the patient is trying to hear.
- Test-retest reliability is poor.
Regarding the issue of test reliability, this has been studied extensively. One study used test-retest data to generate critical differences (in dB) for aided sound-field testing (Hawkins et al, 1987). They found that to be significantly different at the .05 level, the differences would have to be greater than 15 dB. In other words, if hearing aid Programming A resulted in an aided threshold of 20 dB, Programming B would have to result in aided thresholds of 0 dB or 40 dB to be significantly different from Programming A. Test-retest accuracy for probe-mic measures is ~2 dB. Clearly, sound field testing cannot be used as a substitute for real-ear measures.
In Situ Measurements
Another patient assessment tool that some believe is a replacement for probe-mic verification is what is called “in situ” testing (in situ is Latin for “in place”). It is available in the fitting software from all major manufacturers, although some promote it much more than others. We suspect that the “replacement for real ear” misconception stems from sales messages promoting a given product (e.g., “use our hearing aids and you won’t have to bother with real-ear measures”).
If this test is new to you, what we are referring to is unaided audiometric threshold measurements that are conducted using the hearing aid to transmit the test signal. The reported advantage is that by using the actual hearing aid (and the patient’s ear coupling) to present the test signals, considerations such as residual volume of the ear canal (RECD) or the effects of venting —intended or slit-leak—are accounted for in the fitting of the device.
While indeed, it is possible that in situ testing might fine-tune some individual issues related to RECD differences and venting effects, these are not the primary reason why probe-mic verification is needed. The main reason, as we just discussed in the previous section, is that the prescriptive targets in the manufacturer’s software are not the true targets. Hence, even when a correction is made for an RECD that is smaller or bigger than average, the final fitting will still be the wrong gain and output.
There is another issue that questions the value of in situ testing. This was revealed in a comparative study that used the premier hearing aids and software from the Big Six manufacturers, and conducted in situ threshold testing with each device on the same patient (downward sloping hearing loss) with the hearing aids fitted with the company’s instant-fit closed earmold (Mueller et al, 2014). The results are shown in Figure 20; the traditional insert earphone thresholds also are shown for comparison (open circles).
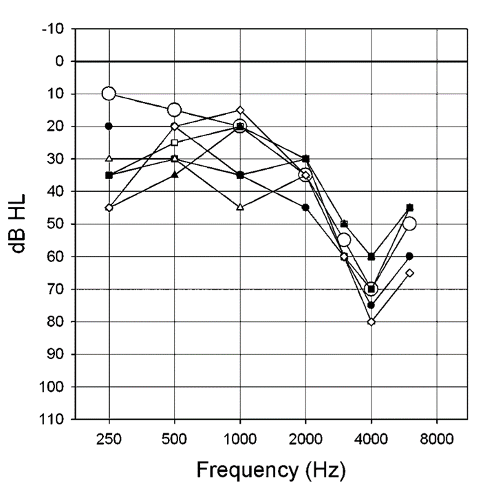
Figure 20. In situ thresholds obtained using the fitting software and hearing aids (mini-BTE RICs) from six major manufacturers, using the manufacturers’ stock closed fitting tips. Insert earphone thresholds are shown for comparison (larger open circles) (adapted from Mueller et al, 2014).
Observe that large differences are observed among the different manufacturers—as much as 40 dB at 1000 Hz. Some of these low-frequency differences could be related to the tightness of the different so-called “closed” fitting tips (see review of this problem in section 4.2 of this article). But even at 4000 Hz, a 20 dB difference is observed, causing even more variance from a true NAL fitting. In situ threshold measures simply are not a replacement for real-ear verification of a validated prescriptive method.
AutoREMfit
On the surface, it would seem that autoREMfit would be equal to traditional real-ear verification, and therefore does not belong in this Quick Takes 4.6 section of “things that do not work.” But we’ll explain.
All major manufactures have autoREMfit in their fitting software, although they do not all pair with the same probe-microphone equipment. It indeed is possible, that for some pairings of hearing aid software and probe-microphone test equipment, that the end fitting to a prescriptive target essentially will be as good as that of an experienced HCP. In many cases, however, there are at least three important issues to consider:
- Some autoREMfit software only fit to average input levels. These fittings then often result in significantly (> 5 dB) under-fitting for soft input levels, which need to be fixed by the HCP. Fixing this involves increasing amplifier gain, which will alter the output for the 65 dB input, which will then need to be fixed, and in the end, there is no value in using autoREMfit.
- Some autoREMfit software includes the measurement of the patient’s REUR. This then can result in an autoREMfit that misses target by a considerable amount when cross-check speech mapping is conducted (Mueller and Ricketts, 2018). Figure 21 is an example of this; an REAR measure (ISTS 65 dB SPL input) following the autoREMfit using this type of software (autoREMfit showed a perfect match to target). Most any HCP would not consider this an acceptable fitting. Note that the REAR is about 10 dB over the prescriptive target at 2000 Hz and about 7 dB under target at 4000 Hz.
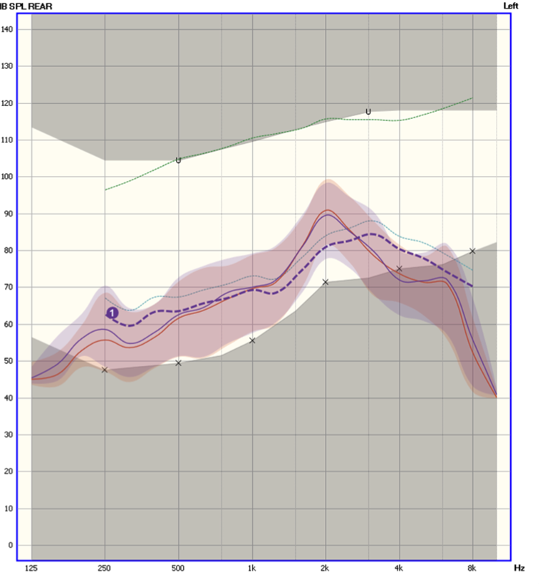
Figure 21. REARs for a 65 dB SPL real speech input following autoREMfit. The dark blue dashed line is the NAL-NL2 prescriptive targets, and the lighter blue and red intertwined lines (test/retest) are the measured REARs. The shaded area represented the 30th to 99th percentile of the amplified speech signal. The X’s below the dashed blue line are the patient’s thresholds converted to ear canal SPL (from Mueller and Ricketts, 2018).
- And the most important consideration, is something that we’ve already discussed . . . twice. Depending on what is paired with what, the autoREMfit procedure can be controlled by the fitting software (incorrect targets) or by the probe-mic equipment (correct targets). If the fitting software is “in control” (which often is the case), what might look like a perfect fit to target following autoREMfit might not be perfect at all.
Certainly, autoREMfit is the best alternative option we’ve talked about to this point, but it is not without its limitations.
Patient Preference
That leaves us with our final alternative option, certainly one that has been time-tested: “Well tell me Martha, how does that sound?” We reviewed the many problems with this approach in QuickTakes Volume 2.2, so there is no need to go through all the research in this area again, but here is a brief review of some key findings:
- When patients were told that hearing aids were “new,” they scored significantly higher for speech tests.
- When patients were told that hearing aids were “digital,” 83% preferred those products over the ones not labeled digital (even though they were the same hearing aids).
- When individuals purchased hearing aids that were programmed to 0 dB gain (with no volume control), and they used these hearing aids in the real world for six weeks, at the end of the study, 36% stated that they did not want a refund, but wanted to keep wearing the hearing aids.
Need we say more about this approach?
Conclusion, and What we think this Means
As we’ve mentioned several times, 30 years of guidelines from all major audiology organizations have specified that real-ear verification of a validated prescriptive fitting is Best Practice. Yet, we know a large percentage of HCPs do not follow these guidelines, meaning that they must have an “alternative” form of verification, or they do no verification at all. In section 4.5 of this paper, we discussed why the “no verification” approach—simply clicking on the default fitting or the NAL-NL2 tab—doesn’t work. We now have reviewed the many limitations of alternative verification methods.
What this all means is fairly straightforward: There is no substitute for conducting probe- microphone measures at multiple input levels, and comparing the resulting aided gain and output to validated standards. After all, there are evidence-based reasons why the guidelines say what they say. Following them is Best Practice.
Closing the Volume 4
At the beginning of this Volume of Research QuickTakes, we mentioned that in the everyday practice of fitting hearing aids, we develop many beliefs, some are based on things we think we learned in school, things we might have read, things we have heard from a rep, or things from our fitting experiences. And, some of them might not really be true. Of all the possible misconceptions we mentioned in this article, it very well could be that none were misconceptions for you. Great, hope you enjoyed the reading anyway. On the other hand, if we did hit on a couple things, maybe you can apply them in your everyday practice.
References
Aazh, H., & Moore, B. C. (2007). The value of routine real ear measurement of the gain of digital hearing aids. Journal of the American Academy of Audiology, 18(8), 653-664.
Aazh, H., Moore, B. C., & Prasher, D. (2012). The accuracy of matching target insertion gains with open-fit hearing aids. American Journal of Audiology, 21(2), 175-180.
Amlani, A. M., Pumford, J., & Gessling, E. (2017). Real-ear measurement and its impact on aided audibility and patient loyalty. Hearing Review, 24(10), 12-21.
Balling, L. W., Jensen, N. S., Caporali, S., Cubick, J., & Switalski, W. (2019). Challenges of instant-fit ear tips: What happens at the eardrum? Hearing Review, 26(12), 12-15.
Baumfield, A., & Dillon, H. (2001). Factors affecting the use and perceived benefit of ITE and BTE hearing aids. British Journal of Audiology, 35, 247-258.
Bentler, R. A., & Cooley, L. (2001). An examination of several characteristics that affect the prediction of OSPL90. Ear and Hearing, 22(1), 3-20.
Berger, K. W. (1976). Prescription of hearing aids: A rationale. Journal of the American Audiology Society, 2(3), 71-78.
Chalupper, J., Wu, Y., & Weber, J. (2011). New algorithm automatically adjusts directional system for special situations. Hearing Journal, 64(1), 26-33.
Cox, R. M. (1995). Using loudness data for hearing aid selection: The IHAFF approach. The Hearing Journal, 48(2), 10.
Cox, R., & Alexander, G. (1990). Evaluation of an in-situ probe-microphone method for hearing aid fitting verification. Ear and Hearing, 11, 31–39.
Cui, T., & Groth, J. (2017). How accurate are environmental classifiers in hearing aids? Retrieved from AudiologyOnline.
Dillon, H. (Year). Earmolds and high-frequency response modifications. Hearing Instruments, 36(12), 8-12.
Froehlich, M., & Littmann, V. (2019). Closing the open fitting: An effective method to optimize speech understanding. Hearing Review, 26(4), 16-20.
Hawkins, D. B., & Cook, J. A. (2003). Hearing aid software predictive gain values: How accurate are they? The Hearing Journal, 56(7), 26-34.
Hawkins, D., Montgomery, A., Prosek, R., & Walden, B. (1987). Examination of two issues concerning functional gain measurements. Journal of Speech and Hearing Disorders, 52(1), 56-63.
Johnson, E. (2012). Same or different: Comparing the latest NAL and DSL prescriptive targets. AudiologyOnline. Available from: https://www.audiologyonline.com/articles/20q-same-or-different
Johnson, E., & Dillon, H. (2011). A comparison of gain for adults from generic hearing aid prescriptive methods: Impacts on predicted loudness, frequency bandwidth, and speech intelligibility. Journal of the American Academy of Audiology, 22, 441-459.
Keidser, G., & Dillon, H. (2006). What’s new in prescriptive fittings down under. Hearing Care for Adults 2006, Phonak AG.
Keidser, G., & Alamudi, K. (2013). Real-life efficacy and reliability of training a hearing aid. Ear and Hearing, 34(5), 619-629.
Leavitt, R., & Flexer, C. (2012). The importance of audibility in successful amplification of hearing loss. Hearing Review, 19(13), 20-23.
Lybarger, S. F. (1944). U. S. Patent application SN 5320 278. July 3rd, 1944.
Lybarger, S. (1947). Development of a new hearing aid with magnetic microphone. Electrical Manufacturing, Nov, 19-29.
Margolis, R. H. (2008). The Vanishing Air-Bone Gap - Audiology's Dirty Little Secret. Retrieved from AudiologyOnline.
Mueller, H. G. (1981). Directional microphone hearing aids: A 10 year report. Hearing Instruments, 32(11), 16-19.
Mueller, H. G., & Grimes, A. (1983). Speech audiometry for hearing aid selection. Seminars in Hearing, 4(3), 255-272.
Mueller, H. G. (2005). Fitting Hearing Aids to Adults Using Prescriptive Methods: An Evidence-Based Review of Effectiveness. Journal of the American Academy of Audiology, 16, 448-460.
Mueller, H. G. (2020). Perspective: Real ear verification of hearing aid gain and output. GMS Z Audiol (Audiol Acoust), 2, Doc05. DOI: 10.3205/zaud000009, URN: urn:nbn:de:0183-zaud0000096
Mueller, H. G., Bentler, R. A. (1994). Measurements of TD: How loud is allowed. The Hearing Journal, 47(1), 10, 42-44.
Mueller, H. G., Bentler, R. A., & Wu, Y. H. (2008). Prescribing maximum hearing aid output: Differences among manufacturers found. The Hearing Journal, 61(3), 30-36.
Mueller, H. G., Weber, J., & Bellanova, M. (2011). Clinical evaluation of a new hearing aid anti-cardioid directivity pattern. International Journal of Audiology, 50(4), 249-254.
Mueller, H. G., Ricketts, R. A., Bentler, R. (2017). Speech mapping and probe microphone measures. San Diego: Plural Publishing.
Mueller, H. G., & Ricketts, T. A. (2018). 20Q: Hearing aid verification - will autoREMfit move the sticks? AudiologyOnline, Article 23532. Retrieved from www.audiologyonline.com.
Mueller, H. G., Coverstone, J., Galster, J., Jorgensen, L., & Picou, E. (2021a). 20Q: The new hearing aid fitting standard - A roundtable discussion. AudiologyOnline, Article 27938. Available at www.audiologyonline.com.
Mueller, G., Stangl, E., & Wu, Y. H. (2021b). Comparing MPOs from six different hearing aid manufacturers: Headroom considerations. Hearing Review, 28(4), 10-16.
Mueller, H. G., Pumford, J. (2022). Back to Basics: Using probe-microphone measurements for hearing aid verification. Retrieved from AudiologyOnline.
Powers, T. A., & Hamacher, V. (2002). Three-microphone instrument is designed to extend benefits of directionality. Hearing Journal, 55(10), 38-45.
Pumford, J., & Mueller, H. G. (2020). Using autoREMfit for hearing aid fitting and verification: Evidence of accuracy and reliability. Hearing Review, 7(8), 24-27.
Ricketts, T., Hornsby, B. Y., & Johnson, E. E. (2005). Adaptive directional benefit in the near field: Competing sound angle and level effects. Seminars in Hearing, 26(2), 59-69.
Ricketts, T., Bentler, R., & Mueller, H. G. (2019). Essentials of Modern Hearing Aids. San Diego: Plural Publishing.
Sabin, A. T., Van Tasell, D. J., Rabinowitz, B., & Dhar, S. (2020). Validation of a self-fitting method for over-the-counter hearing aids. Trends in Hearing. DOI: 10.1177/2331216519900589
Sanders, J., Stoody, T., Weber, J., & Mueller, H. G. (2015). Manufacturers' NAL-NL2 fittings fail real-ear verification. Hearing Review, 21(3), 24.
Sangren, E., & Alexander, J. (2023). Music quality in hearing aids. Audiology Today, 35(4).
Searchfield, G., Lindford, T., Kobayashi, K., Crowhen, D., & Latzel, M. (2018). The performance of an automatic acoustic-based program classifier compared to hearing aid users’ manual selection of listening programs. International Journal of Audiology, 57(3), 201-212.
Taylor, B., & Mueller, H. G. (2012). Getting aided loudness right: A three-step approach. Audiology Practices, 4(1), 14-21.
Valente, M., Oeding, K., Brockmeyer, A., Smith, S., & Kallogjeri, D. (2018). Differences in word and phoneme recognition in quiet, sentence recognition in noise, and subjective outcomes between manufacturer first-fit and hearing aids programmed to NAL-NL2 using real-ear measures. Journal of the American Academy of Audiology, 29(8), 706-721. DOI: 10.3766/jaaa.17005
Walden, B., Schwartz, D., Williams, D., Holum-Hardigan, L., & Crowley, J. (1983). Test of the assumptions underlying comparative hearing aid evaluations. Journal of Speech and Hearing Disorders, 48, 264-273.
Yellamsetty, A., Ozmeral, E., Budinsky, R., & Eddins, D. (2021). A Comparison of Environment Classification Among Premium Hearing Instruments. Trends in Hearing. https://doi.org/10.1177/2331216520980968
Citation
Taylor, B. & Mueller, H. G. (2023). Research QuickTakes Volume 4: potential hearing aid fitting misconceptions. AudiologyOnline, Article 28685. Retrieved from https://www.audiologyonline.com