Learning Outcomes
After this course learners will be able to:
- Describe the procedures necessary to obtain valid word recognition scores.
- Describe the reasons for speech-in-noise testing, and supporting background regarding the QuickSin test.
- Describe the importance of lDL testing, and the procedures involved.
- Describe the importance of pre-fitting self-assessment measures, and the background regarding three popular measures
Introduction
In this Volume of Research QuickTakes, we will review several tests and procedures that Hearing Care Providers (HCPs) need to have in their toolbox for the fitting of hearing aids. This includes pre-testing, verification, trouble-shooting and post-fitting validation and counseling. We will not only provide a review of test required and their evidence-based rationale, but also a step-by-step guide of how these tests and procedures can be administered and scored.
V6.1: Monosyllabic Word Recognition Measures
The first test we’ll discuss is word recognition testing in quiet, via earphones, using phonemically-balanced (PB) monosyllabic words. Normally shortened to “Word Rec” in a busy clinic, and unfortunately, sometimes still incorrectly called “discrimination” or “discrim.” (Note: To do speech discrimination testing the patient must be given at least two words to discriminate between; what we commonly do is task of “recognition,” not discrimination).
This is one of the most basic procedures related to hearing aid fitting, and complete reviews and protocols can be found by Mueller et al (2014) and Mueller and Hornsby (2020). Related to the fitting of hearing aids, we might ask . . . why are we doing this testing? There are three fundamental things that we would like to know:
- What is the maximum performance possible for this patient? That is, when we deliver the words via earphones at the optimum presentation level—enough, but not too much audibility—what score is obtained? This measure is termed PB-Max. We would expect that, if fitted properly, the aided performance will equal, or because of frequency shaping, maybe even exceed this value.
- Also, related to the hearing aid fitting, we want to know if there is a significant difference in the PB-Max between ears. This could impact hearing aid selection and post-fitting counseling.
- And finally, the PB-Max score can be used to determine when to consider eliminating an ear in the hearing aid fitting process (employ CROS or BiCROS) or when to consider referring for a cochlear implant evaluation.
Speech Material
An important adage regarding speech recognition testing is:
“The words are not the test, the test is the test!”
That is, the “test” is only valid if the standard presentation method is used. For this reason, we recommend using the Auditec of St. Louis recording of the Northwestern University #6 (NU-6) word lists, as the majority of recent research with monosyllable word lists has been with this recording. Using a different word list or presentation mode (recording) would then negate the use of these research findings in your interpretation and treatment plan. Most modern audiometers have the Auditec NU-6 word lists on a compressed file as part of the audiometer software. If you use an external CD player, the Auditec CD recording is available from Auditec of St. Louis (e.g., https://auditec.com/2015/09/28/nu-6/).
Presentation Level
As we’ve mentioned, the goal of this testing is to find PB-Max. In a research lab, this would consist of conducting a performance/intensity (PI) function in small steps (2 or 4 dB), with levels ranging from just above the threshold to the patient’s loudness discomfort level. In a busy clinic, however, the HCP usually will only conduct testing at one level. How do you know what level is best? First, we’ll list three methods which we know are NOT the best:
- A fixed SL (30 or 40 dB) added to the patient’s SRT.
- A fixed SL (30 or 40 dB) added to the patient’s pure-tone average.
- The patient’s most comfortable level (MCL) for speech.
There is no single level or procedure that will work the best for finding PB-Max for all patients (other than a PI/PB function using small steps). But if we choose to use a single presentation level, we must then pick one that gives us the best chance of being right most of the time. Fortunately, we have research data to help us make that decision.
In general, for the average patient with a downward sloping hearing loss, the presentation goal relates to audibility of the speech signal, especially the important high frequency signals needed to identify PB words (e.g., 1500 to 3000 Hz region). The presentation level also has to be below the patient’s LDL (loudness discomfort level). An approach suggested by Guthrie and Mackersie (2009) is what we prefer, and that is to use a variable sensation level (SL) based on the 2000 Hz threshold. The SL becomes smaller as the threshold becomes worse. The values they recommend are shown in Table 1. As you can see, for most losses, you’ll end up around 75-80 dB HL
| 2000 Hz Threshold | <50 dB HL: 25 dB SL |
| 2000 Hz Threshold | 50–55 dB HL: 20 dB SL |
| 2000 Hz Threshold | 60–65 dB HL: 15 dB SL |
| 2000 Hz Threshold | 70–75 dB HL: 10 dB SL |
Table 1. The SL values shown below are added to the 2000 Hz pure tone threshold to obtain the presentation level:
While this works well with most patients, we can think of at least three cases when this approach is not optimal:
- When the recommended SL results in exceeding the patient’s loudness discomfort level (LDL)
- When the hearing threshold at 2000 Hz is 80 dB or greater.
- When the patient has an upward sloping loss, and relatively normal hearing at 2000 Hz.
In these cases, we recommend that you carefully measure the patient’s LDL for speech, and then conduct testing 5 dB below this level. We do need to point out that when you first start delivering speech to patients at 75 to 80 dB HL, it is very common for them to respond in a somewhat startled manner, and say something like, “That’s really loud.” They are correct, it is! At this point, it is important to have the patient make the distinction between “Really Loud” and “Uncomfortably Loud.” You might say something like, “I realize the speech is loud, but we need to have it loud to obtain the best test results. Is it truly uncomfortable, or just louder than you would like?” In most cases, after some thought, the patient will decide that it’s really okay. Talk to them a little at this level before starting the NU-6 recording.
List Length
The NU-6 was designed and normed as a 50-word test. Research has shown that the Auditec recording of the NU#6 lists has good inter-list equivalency, but this does not necessarily hold true for the first or second half of any given list (e.g., the use of a 25-word list). We have heard that in some clinics, the use of half lists is common practice. There are two reasons why this is not a wise decision.
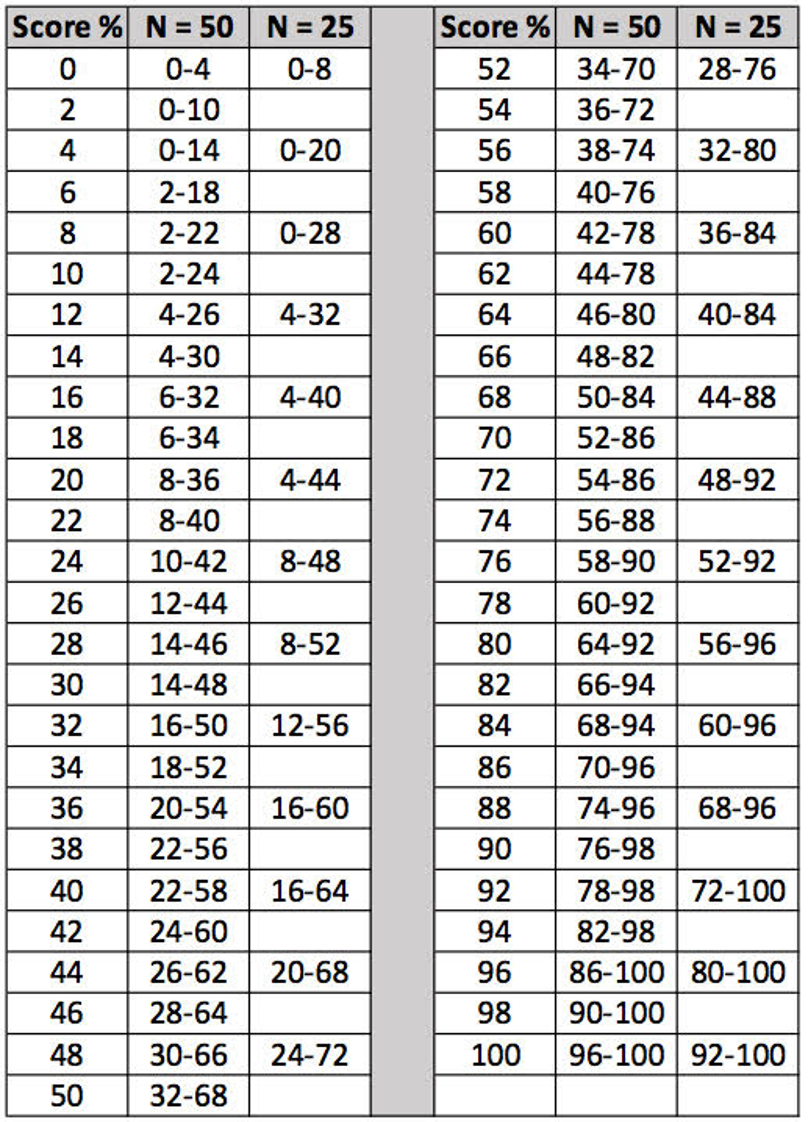
First, we know that our test score is simply an estimate of the patient’s true score, because of the variability of the test. The more words that are delivered, the closer our test score will be to the true score. If we use the recommended 50 words, and our test score is 60%, we know that the true score is somewhere between 42-78%. If, however, we only use 25 words, this range expands to 36-84%.
A second, and even more important reason why using a ½ list is risky practice is that when these tests were developed, there was no effort to balance the difficulty of the words on the first ½ versus the second. Research by Hurley and Sells (2003) with a large group of hearing-impaired individuals found that some words are missed over 60% of the time (the word “death” was found to be the hardest) and some only missed 10% or less (the word “love” was found to be the easiest). We can go back to early research with the NU-6 word lists when scores from the first ½ (25 words) to scores using the second ½ (25 words) of the list were compared. Researchers found that for an older hearing-impaired group, the average difference between the first ½ and the second ½ was 16%! (see Mueller and Hornsby, 2020, for review). And that’s the average; so many differences were greater than that.
Consider that for List 1A of the NU-6, if we simply look at the 10 most difficult words, it just happens that eight are in the first half and two are in the second half. So let’s say a given patient simply misses the 10 hardest words—a fairly likely occurrence. If an appropriate full 50-word list had been used, his score would be 80%. If someone were to use a half list and the right ear was tested first, however, the patient’s scores would be 68% for the right ear and 92% for the left. Some otolaryngologists would order an MRI when presented with this degree (24%) of asymmetry for word recognition (the patient now sits at home for two weeks waiting for the MRI, wondering if they have a life-threatening tumor). If the patient needed hearing aids, and stated that he only wanted to purchase one, some HCPs might fit the left ear because it was the “best,” when, in fact, the left ear probably was the same as the right—it just got lucky and got the easy half of the list!
The bottom line, always use the full 50-word list. If the reason for using a ½ list is because it is considered “time saving,” consider that the actual savings is about 3 minutes/patient (Mendel and Owen, 2011). When “obtaining the correct score” rather than an invalid score only involves 3 minutes, it’s a pretty easy decision to make.
Interpreting Results
There is no “standard” for interpreting the results of the clinical word recognition measure—that is, what is mild, moderate or severe. In Table 2, we have provided general guidelines.
| 92-100% | Normal or near-normal |
| 84-90% | Mild impairment |
| 72-82% | Moderate impairment |
| 58-70% | Severe impairment |
| <58% | Very severe impairment |
Table 2. General classification of word recognition performance.
Once the PB-Max score has been obtained, in addition to identifying the general category of handicap, there often are other treatment decision to make: Is the right ear score different from the left? Have the results changed since previous tests? Are the test scores unusually low given the degree of the hearing loss? Fortunately, there are research-based tools to help us with these decisions. The first of which is the binomial critical difference chart—that is, when is the difference between two scores truly a difference (Thorton & Raffin, 1978). We have included this chart in Appendix A. Simply select the score to be compared to (e.g., we’ll use 80%) and then observe the range that falls under the N=50 column to the right of this percentage. For example, for 80%, the second score would have to be bigger than 92% or smaller than 64% before it would be considered different than 80%. This information is critical for writing reports and counseling patients.
Some examples (using the chart in Appendix A):
- A patient with a score of 72% in the right ear, and 60% in the left, asks you if his speech understanding is better in one ear? You say “No” (because it isn’t).
- You just did testing for a post-op stapedectomy, and the patient’s word rec score dropped from 88% on the pre-op to 76% on post op. Do you tell the physician or state in chart notes that word recognition dropped following surgery? No (because it didn’t).
- Three years ago, a patient’s score in her right ear was 92%, today it’s 74% and she asks if it’s gotten worse? You say: Yes (because it has).
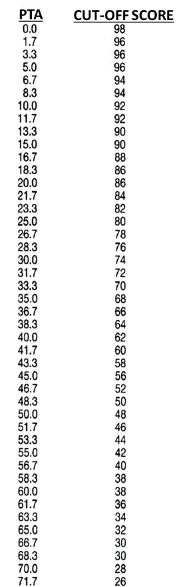
Another question which often must be answered concerns individuals with a severe reduction in their word recognition score. At what point is the lower score a “red flag” for medical referral? Fortunately, we also have a chart for this, which is included in Appendix B (Dubno et al, 1995). Let’s take a patient with a pure-tone average (PTA) of 40 dB. What if his word recognition score was 70%? That’s okay, as observe that for the 40 dB PTA, the cut-off score is 62%, and he is above this value. If the score falls below this 62% value, however, then we would consider this patient “at risk” for ear pathology that might require medical attention.
We can thank audiologist Linda Thibodeau (2007) for combining the data from the charts in Appendix A and B into one single chart. You can find that chart here.
Word Recognition Pass/Fail Screening Procedure
This is a procedure developed by Hurley and Sells (2003), who measured word recognition using the Auditec recordings of the NU-6 50-word lists. They recorded not only the patient’s word recognition score, but also which words they missed. They did this so they could develop a percentage of misses for each word, or what the word error rate was. Then they sorted the words based on their difficulty to create the ordered-by-difficulty lists. With those ordered-by-difficulty lists, they then re-scored performance for each patient.
The authors went through this process with over 400 hearing-impaired patients. They found a protocol that was very efficient and effective for identifying people whose performance would probably be no worse than 94-96%. The screening rules that they found to be very effective were as follows:
- Present the 10 most difficult words first. If the patient misses none or only one word, you can stop testing for that ear. It’s very unlikely that that person is going to have a 50-word score that’s less than 96%.
- If the patient missed more than one word, then go ahead and present the next 15. In that case, out of those first 25 words, if they missed 3 or fewer, then you can stop testing.
- If the patient misses more than 3 words for the first 25, then you would present the full 50-word lists.
Out of those 400+ subjects, this screening approach identified all of the people who scored poorer than 96%. That’s a 100% hit rate—it doesn’t get any better that. So you can save time and conduct a valid and reliable test by using materials that are ordered by difficulty. How much time can it save you? Out of those 400 people that they tested, 25% of these patients would not have needed the full 50-word list.
This test is not specifically scored in percent correct, unless you present all 50 words. We suggest that you have a box on your audiogram for speech recognition that simply states “=/> 94%.” There is no reason for us (or anyone else) to care if the true score is 94%, 96%, 98% or 100%. They all are “normal.” If there is not already a file for this test on your audiometer (probably labeled “Ordered By Difficulty”, you can obtain the CD version from Auditec of St. Louis: NU-6 Ordered by Difficulty Version II Short Interval.
Step-by-Step Test Protocol
- Seat patient, give instructions and fit with insert earphones.
- Use the Auditec of St. Louis recording of the NU-6 ordered-by-difficulty Version II speech material.
- Select the presentation level based on the “2K + SL” approach, unless one of the three mentioned conditions exist, in which case conduct testing 5 dB below the speech LDL.
- Select the test ear. Each ear tested independently. There is no need for bilateral testing—the bilateral score will not be significantly different from the “best ear” score.
- Select appropriate masking (speech noise) for the non-test ear: 30 dB below presentation level is usually satisfactory, unless bilateral conductive loss is present.
- Present the first 10 words. If the patient misses none or only one word, you can stop testing for that ear (check “=/> 94%” box on audiogram). If the patient missed more than one word, then present the next 15. If they miss 3 or fewer, then you can stop testing (check “=/> 94%” box on audiogram).
- If the patient misses more than 3 words for the first 25, then present the full 50-word lists. Score in percent correct—2% credit for each correct word.
- If the full 50-word list is delivered, use the charts in Table 2, Appendix A and Appendix B to document findings and formulate treatment plan.
Frequently Asked Questions
Q. You recommend conducting word recognition at a level that is higher than what my patients will experience in their everyday life. Don’t we want to know how they are doing in the real world?
A. Yes, that would be nice to know, but if you think that a test conducted in sound isolation, using earphones, using single-syllable words, with minimal reverberation, with no background noise, with no visual cues, in any way predicts how someone is understanding speech in the real world, you are sadly mistaken. It’s not something that can be measured using routine clinical testing, so there is no reason to pretend that that is what we are doing. What we can do, is determine optimum recognition performance for this test, using appropriate audibility.
Q. You didn’t mention the Maryland CNC test. Is that an acceptable alternative to the NU-6.
A. Probably. These lists have been extensively studied, particularly by Richard Wilson and his team. They are used in many VA clinics, but outside of the VA, are not commonly used, which is why we only focused on the NU-6 in this article. Also, we’re not familiar with work that has that list ordered by difficulty.
Q. I have the NU-6 file on my audiometer, but I don’t think it’s the Auditec recording. Is it okay to use a different recorded version?
A. No. As we mentioned earlier, “The words are not the test, the test is the test!” Different recorded speakers of the NU-6 words will result in different results. As reported by Fred Bess (1983) in his classic book chapter on speech audiometry, the difference between speakers for the same 50-word list, depending on the sensation level (SL) can be as large as 60%!
Q. When do you recommend using the ordered-by-difficulty recording?
A. Always. The worst case is that you’ll need to deliver all 50 words (which will happen most of the time) but this is what you would have done anyway, so there is no loss of time or efficiency.
Q. If I’m doing the ordered-by-difficulty list, and the patient only misses 2 words of the first 25, do I think simply give him a score of 92% (4% for each word wrong)?
A. No. It’s a pass/fail screening test, and only scored in percent correct when you present all 50 words. It would not be fair to the patient to score him based on the 25 hardest words—if he only missed 2 of the first 25, it’s very likely that he would score 100% on the easiest 25 that followed.
Q. Is there ever a time when using monitored live voice for monosyllabic word testing would be okay?
A. Not that we can think of. You are out on a limb with your own made-up test. You do not know the norms, the hardest words, the critical differences, or when a low score is a “red flag” score. While this might sound a little harsh, here is what audiologists Ross Roeser and Jackie Clark (2008) had to say about using live voice testing in their article on the topic: “. . . it appears that ignorance, complacency or laziness are the only reasons why clinicians elect to use MLV presentation for speech recognition testing.”
V6.2: Speech-in-Noise Testing
We’re now going to move on to a more important speech measure, word recognition in background noise. For reasons understood by few, while nearly all HCPs routinely conduct speech-in-quiet testing, speech-in-noise testing is only conducted by a minority—20-30% of HCPs at most (Mueller et al, 2010). Why the lack of interest in this assessment? Consider the following data from Richard Wilson’s (2011) research based on comparative speech-in-quiet vs. speech-in-noise testing of over 3000 individuals:
- Approximately 70% of the patients had speech recognition performance in quiet (NU-6) that were good or excellent, but only 6.9% of these very same patients had normal speech-in-noise scores.
- Of the total, only 222 (6%) had normal performance for the speech-in-noise test; 218 (98.5%) of these same patients also had normal performance for the NU#6. The point being . . . if speech-in-noise is normal, there is no reason to test speech-in-quiet.
- Of the over 3000 patients who had abnormal performance on the speech-in-noise, 1383 (46.1%) had scores on the NU-6 of 92% or better. The point being, the speech-in-quiet score tells you very little about how this person will perform in background noise.
These data clearly show that if, for some reason, you only were able to conduct one of these two tests, you would do the speech-in-noise assessment, as it is highly predictive (98.5%) of the speech-in-quiet score.
Rationale for Testing
As with speech testing in quiet, we need to start off by asking ourselves: Why am I doing this testing? What am I hoping to learn? How do the results relate to the hearing aid fitting? There are several answers to these questions (Mueller, 2016):
- For starters, most patients report that understanding speech in background noise is the reason they are considering the use of hearing aids. To not do testing to examine the patient’s primary complaint is illogical and not fair to the patient.
- The testing will help identify an ear-asymmetry that might exist that was not present in the pure-tone audiometric results.
- For patients with normal, or near-normal hearing, speech-in-noise testing might reveal why the patient is having problems, and help guide the hearing aid fitting.
- The results of the testing will help with decisions regarding hearing aid technology and assistive devices.
- The pre-fitting speech-in-noise results will provide values that later can be used to determine the “goodness” of the subsequent fitting (e.g., aided performance should be at least as good as the optimum earphone score).
- The results of the testing will be very useful for counseling, both at the time of the fitting and on follow-up visits. This testing will help the HCP provide realistic expectations for the patient when he or she is using the hearing aids in the real world.
Adaptive or a Variable SNR Procedure
Over the years, we have observed the development of speech-in-noise tests that are variable (e.g., either the speech or the noise is raised and lowered adaptively, until the point where the patient is scoring 50% correct is found; commonly referred to as SRT-50), or, the noise is delivered at a fixed SNR relative to the speech (e.g., SNR=+5 dB, SNR=+10 dB, etc.).
As reviewed by Mueller et al (2014), there are clinical advantages to both the variable and fixed SNR methods of measuring speech recognition in background noise. First, some advantages of the variable model:
- Eliminate floor and ceiling effects (i.e., scoring nearly all correct or all incorrect), a common problem when a fixed SNR is used.
- The 50% correct point for most patients can be obtained more reliably and efficiently than a lengthy word list.
- Better able to determine significant differences between patients, test sessions, between the right and left ears, or different hearing aids and/or hearing aid settings.
- The 50% correct SNR finding can be helpful for patient counseling (patients can be made aware of listening situations where the SNR typically is more adverse than their SRT-50).
But, there also are some disadvantages of measuring the reception threshold for speech compared with using a fixed SNR approach:
- Difficult to explain test results to the patient—telling a patient his or her speech reception threshold (SRT) in noise is +10 dB is not very meaningful.
- Difficult for patients to relate their performance during the test administration to the real world. Because of the way the test is designed, two individuals with very different SRT-50s would both report that they scored about one-half of the words correct.
- Difficult to relate findings to third parties and referral sources. Even HCPs are not always certain if a SRT-50 score of +4 dB is good or bad. And, the SRT-50 score that is good for one speech test might just be “okay” for another, depending on the difficulty of the test.
- Administration and scoring of an SRT-50 test may be somewhat more cumbersome than simply recording percent correct for a fixed SNR.
Presentation Level
An important consideration when conducting speech-in-noise testing is to select an appropriate presentation signal. The level selected is directly related to the question being asked and the overall purpose of the testing. Here are some examples:
- Choice #1: Conduct testing at the level at which the norms were collected. This is the most reasonable choice, as it allows for comparison with the norms and should ensure the best inter-list reliability.
- Choice #2: Conduct testing at the level at which the best performance is predicted, related to optimizing audibility (might be the same as the level that norms were collected). This should provide the best indication of true recognition ability and best predict potential performance with amplification.
- Choice #3: Conduct testing at the average real-world levels, which should provide the best prediction of how the patient performs in the real world. (Note: We say “best,” not “accurate”—clinical speech recognition performance is not too good at predicting real-world performance.)
- Choice #4: Conduct testing at the specific level that relates to a patient complaint; a patient with a mild hearing loss whose primary complaint is understanding soft speech might be tested at the level of soft speech.
While all four of the above choices might apply at one time or another, the most important measure relating to the selection and fitting of hearing aids is to establish the patients “residual processing capability” when audibility is maximized. This gives us an estimate of what is possible with appropriate amplification. This then takes us back to the same rules we discussed earlier regarding testing speech recognition in quiet. We recommend, therefore, that pre-fitting speech-in-noise testing is conducted at 70 dB HL, or 5 dB below the patient’s LDL (the “Loud, But Okay” rating for the Cox Loudness Anchor Chart).
Selecting the Best Test
There are several speech-in-noise tests that have been used over the years, mostly in research settings. For this article, we will just review one specific test. We’ve selected this test for four primary reasons: It has considerable normative data (e.g., critical differences, test-retest data, inter-list equivalency, etc.), it has been used in many research studies, currently is the most popular among HCPs, and is readily available on most all computer-based audiometers. The test is the QuickSIN (Killion et al, 2005). A few things about this test:
- Each list was recorded with 6 different S/N ratios (+25 to 0 dB SNR in 5 dB steps).
- Six sentences/list; only one sentence at each SNR level, 5 key words in each sentence (30 key words for each list)
- Target sentences are from female talker, with four male and female competing talkers
- Very easy to administer. Fairly easy to score, and most modern audiometers have automated scoring.
- Scoring is in SNR-Loss. That is, how does this patient’s ability to understand 50% of speech in background noise differ from someone with normal hearing (Note: Normal hearing individuals do not score 100% on this test). For example, if a patient had an SNR-Loss of 6 dB, this would mean that in order for this patient to perform as someone with normal hearing, the level of the noise would need to be reduced by 6 dB. An example of a QuickSIN score sheet is shown in Figure 1.
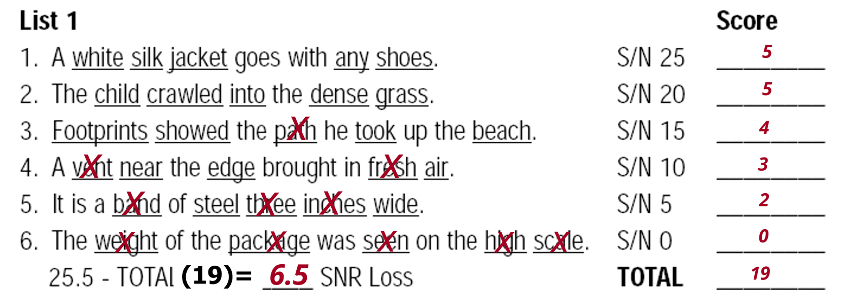
Figure 1. Example of score sheet for one list of the QuickSIN. The patient has the potential to score “5” for each of the six sentences. This patient scored 19 of the 30 key words correct. This value was then subtracted from 25.5 to give him a SNR-Loss score of 6.5 dB (mild-moderate SNR disability).
Recall from our earlier discussion, that when conducting word recognition in quiet, we have a list of critical differences, so that clinically, we know when a difference really is a difference. We also have critical difference values for the QuickSIN, for when 1, 2 or 3 lists are used, for the level of confidence of 95%. Those values are 3.9 dB when only one list is used, 2.7 dB for two lists, and 2.2 dB for when three lists are used for a given condition. If for example, a patient was given two lists for unaided, and two lists for aided, and the score improved from SNR-Loss=8 dB to SNR-Loss=5 dB, an SNR-Loss change of 3 dB, this would be considered a significant improvement, as it exceeds the 2.7 dB cut-off for when two lists are used.
In general, the guidelines below in Table 3 are used when describing the QuickSIN results.
| SNR-Loss 0-3 dB | Normal or near-normal |
| SNR-Loss 4-7 dB | Mild disability |
| SNR-Loss 8-15 dB | Moderate disability |
| SNR-Loss >15 dB | Severe disability |
Table 3. Guidelines (in SNR-Loss) for interpreting QuickSIN findings
Earphone Pre-testing: Step-by-Step Test Protocol
- Seat patient, give instructions and fit with insert earphones.
- Use the standard QuickSIN recording, but, only use the seven lists that are equivalent: 1, 2, 6, 8, 10, 11, 12 (McArdle & Wilson, 2006).
- Select a presentation level of 70 dB HL, or use 5 dB below the speech LDL (patient rating of “Loud, But Okay”).
- Select appropriate masking (speech noise) for the non-test ear: 30 dB below presentation level is usually satisfactory, unless bilateral conductive loss is present.
- Present two QuickSIN lists to each ear. Take average of these two scores for the SNR-Loss for each ear. Test each ear independently; there is no need to test bilaterally, the bilateral score will not be significantly different from the “best ear” score.
- Use the critical difference chart to determine if the right and left ear scores are significantly different, and/or if the scores obtained are different from previous testing.
- Use the SNR-Loss results to counsel the patient regarding expectations with hearing aids (e.g., does he just need audibility, or, advanced directional technology, or, assistive listening devices?).
Validation Testing: Step-by-Step Test Protocol
- Establish HL to SPL difference for calibrated location in soundfield where patient will be sitting (e.g., read SPL values for running speech for fixed HL).
- Seat patient in soundfield calibrated position, and give instructions. Fit the patient with hearing aids programmed to use settings (e.g., NAL-NL2)
- Use the standard QuickSIN recording. Only use the seven lists that are equivalent: 1, 2, 6, 8, 10, 11, 12
- Select a presentation level that will result in 62 dB SPL at the calibrated soundfield location (this will be around 50 dB HL, but can vary with equipment/setting).
- Testing conducted aided bilaterally (unless unilateral fitting). Present two QuickSIN lists. Take average of these two scores for the SNR-Loss.
- Use the critical difference chart to determine if these scores or as good or better than the earphone scores. If significantly worse than the earphone scores, re-programming the hearing aids should be considered—was appropriate audibility provided? Note: Because this testing is conducted with the speech and noise from the same loudspeaker at 0 degree azimuth, there will be no directional processing advantage, which, however, will improve the SNR-Loss by ~3 dB in some real-world listening conditions.
- Use the SNR-Loss results to counsel the patient regarding expectations with hearing aids (e.g., does the patient just need audibility, or, advanced directional technology, or, assistive listening devices?).
Benefit Demonstration: Step-by-Step Test Protocol
- Establish HL to SPL difference for calibrated location in soundfield where patient will be sitting (e.g., read SPL values for running speech for fixed HL).
- Seat patient in soundfield calibrated position, and give instructions.
- Use the standard QuickSIN recording. Only use the seven lists that are equivalent: 1, 2, 6, 8, 10, 11, 12
- Select a presentation level that will result in 55 dB SPL at the calibrated soundfield location (this will be around 40 dB HL, but can vary with equipment/setting).
- Testing first conducted bilaterally unaided. Two QuickSIN lists. Take average of these two scores for the SNR-Loss.
- Patient is then fitted bilaterally (unless unilateral fitting) to appropriate use setting (NAL-NL2) and aided bilateral testing is conducted. Two QuickSIN lists. Take average of these two scores for the SNR-Loss.
- Use the critical difference chart to determine if the aided scores are better than the unaided scores.
- Use the SNR-Loss results to counsel the patient regarding aided hearing aid benefit. We have found it even more beneficial to convert the percent of words correct for each of the six SNR ratios to compare aided to aided (for two lists, there are ten key words for each SNR). It is helpful to graph them on a chart for the patient, as shown in Figure 2.
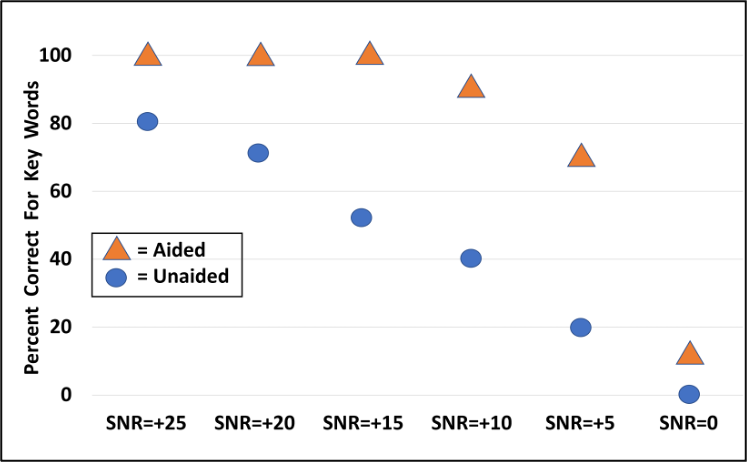
Figure 2. Charting of percent correct for each of the six QuickSIN SNRs for unaided vs. aided performance (presentation level 55 dB SPL).
Once we have this completed chart in front of the patient, we can talk about the fact that at the most difficult listening situations, understanding speech still will be difficult, and that this is also true for people with normal hearing. We then will point out that when the noise is soft, only minimal benefit will be present, as the patient does “okay” for listening in quiet without amplification. What is then most important to emphasize, is the large benefit that can be obtained from hearing aids for all the other typical listening situations, between the very easy and the very hard.
Frequently Asked Questions
Q: I’ve always conducted the earphone QuickSIN test at the patient’s MCL. Is this okay?
A: No. It is critical that the high frequencies of the speech material are audible, and when a downward sloping loss is present, because the “loudness perception” is established from the relatively normal low and mid-frequencies, the patient’s MCL usually is too soft to optimize audibility. This is why we use a higher level, just below the LDL.
Q: Is it okay to simply do the earphone QuickSIN bilaterally?
A: Well, it’s better than not doing it at all, but we really need to know ear-specific information. There are too many cases when someone will have relatively symmetrical pure-tone thresholds and word recognition scores, but significant differences between ears for the QuickSIN.
Q: I really don’t understand how to relate the SNR-Loss value to the real world?
A: Let’s walk through it for someone with an SNR-Loss of 8 dB, a common finding. The person’s SRT-50, where they are understanding 50% of the words in sentences in background noise, is 2 dB higher than the SNR-Loss, so for this patient it would be +10 dB. We now know that if this patient’s favorite restaurant has a typical SNR of +5 dB (very typical), and the background noise is similar to that of the QuickSIN (likely), we will have to make his SRT-50 at least 5 dB better with hearing aids (difficult to do), or, he will need to use a remote microphone when in this restaurant, or, he will need to find a restaurant with a more favorable SNR. If on the other hand, our patient’s SNR-Loss was 2 dB (SRT-50 of 4 dB) our counseling would be much different.
Q: Is the QuickSIN a good test to use when I suspect an auditory processing disorder?
A: No. It was not designed for this population—it is geared for assessing residual peripheral function. We have no data on the sensitivity/specificity of the QuickSIN for this group of patients, but we would predict that many individuals with APD would score normally on the QuickSIN.
Q: At one of the places I’ve worked we simply added background noise to the NU-6 list and used this as our speech-in-noise test. Is this okay?
A: Depends. If what you’re referring to is the much-researched words-in-noise test (WIN), and you are using the validated recording, then this is just fine. Considerable normative data are available for the WIN, and the SNR/SRT-50 norms are similar to the QuickSIN. If you simply constructed a test of your own, with no researched standard recording, and no norms, then the answer is no.
Q: Can the aided bilateral score be worse than the aided unilateral score?
A: We recommend only doing aided bilateral testing, as typically, for the test paradigm we use (speech and noise from same loudspeaker), we would not expect the bilateral to be better or worse the best ear results. There is something called “binaural interference,” however, which does impact some patients. If a patient reports that when using their hearing aids in the real world, they do better with only one aid, bilateral vs. unilateral aided QuickSIN testing would be in order.
Q: I find it confusing to talk in terms of “SNR Loss” to my patients, and also referral sources. Isn’t there a way to use percentages to score the QuickSIN?
A: We haven’t seen those norms published, but you could convert the SNR-Loss norms to percent correct. For example, we know that if someone ends up with an SNR-Loss of 3 dB (the highest score that still falls into the “normal, near-normal” range), it means that they missed 15 words of the 60 presented (2 lists of 30 key words each). That would be 75% correct. That may or may not be helpful for your patient counseling, as even though 75% is near-normal for the QuickSIN, it doesn’t sound like a very good score to the patient.
V6.3: Getting the Maximum Output Right
An important aspect of the overall hearing aid fitting process is to ensure that the output of the hearing aids is programmed correctly. If the output is too loud, the patient will turn down gain, and soft inputs will not be audible. If the patient is not able to turn down gain, or, they tire of continually making this adjustment, they may simply stop using the hearing aids.
Setting the output too low also is not the solution. The goal of the fitting is to maximize the patients’ residual dynamic range (i.e., the range between their thresholds and their loudness discomfort levels—LDLs). An output that is too low will not allow for the dynamics of speech, will significantly reduce the quality of music, and in some cases will make the signal-to-noise ratio worse (e.g., if an SNR is originally is +5 dB, but both the speech and noise reach the hearing aid’s MPO, the SNR will become 0 dB).
Fortunately, getting the output adjusted correctly is not any more difficult than the Goldilocks porridge principle: Not too loud, not too soft, but just right! In general, the hearing care provider has three options:
Option #1
Assume that the manufacturer will “get it right.” That is, more or less ignore the patient’s LDLs and let the fitting software do its thing. How well does this work? We have recent research to give us a good idea (Mueller et al, 2021). Shown in Figure 3 are the MPO curves from the premier hearing aids from the Big Six manufacturers. The hearing aids were programmed using the manufactures’ proprietary fitting for a typical downward-sloping audiogram going from 30 dB in the lows to 60-70 dB in the highs. We would expect someone with this degree of hearing loss to have LDLs around 100 to 105, and indeed this is what is predicted by the NAL-NL2. Observe, however, in Figure 3, except for the orange curve, all manufacturer’s fittings are well below the expected level—some around the 75-85 dB range for the mid-frequencies. Much lower than what would be considered acceptable. For the average person, there is 20 dB of useful audibility that is being “shut down.”
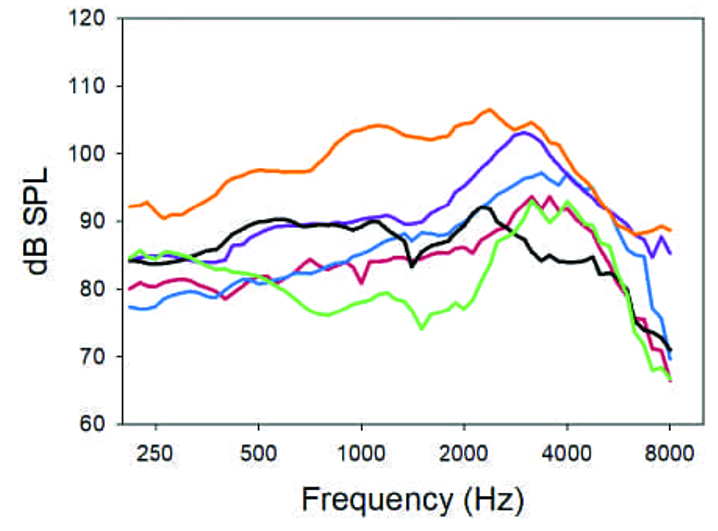
Figure 3. The MPOs for six premier hearing aids when programmed according to the manufacturers’ proprietary algorithm (adapted from Mueller et al, 2021).
The above finding prompted these researchers to examine how the manufactures actually set the MPO in the fitting software. To do this, they looked at the MPO selected by the NAL in the stand-alone software for this specific audiogram (which were 98 to 104 dB, re:2-cc coupler), and then chose the NAL-NL2 for each manufacturer in the respective fitting software. What is shown in Figure 4 are each manufacturer’s frequency-specific MPO settings compared to those of the NAL (the 0 dB line). While it would seem that all manufacturers would simply use the NAL values, this wasn’t the case. One manufacturer was ~5 dB below the NAL prescription, which is probably okay, but another is 15 dB above the NAL in the highs, and one is 10 dB below the NAL in the lows. Clearly, HCPs cannot rely on manufacturers to select the MPO for them, so let’s move on to Option #2.
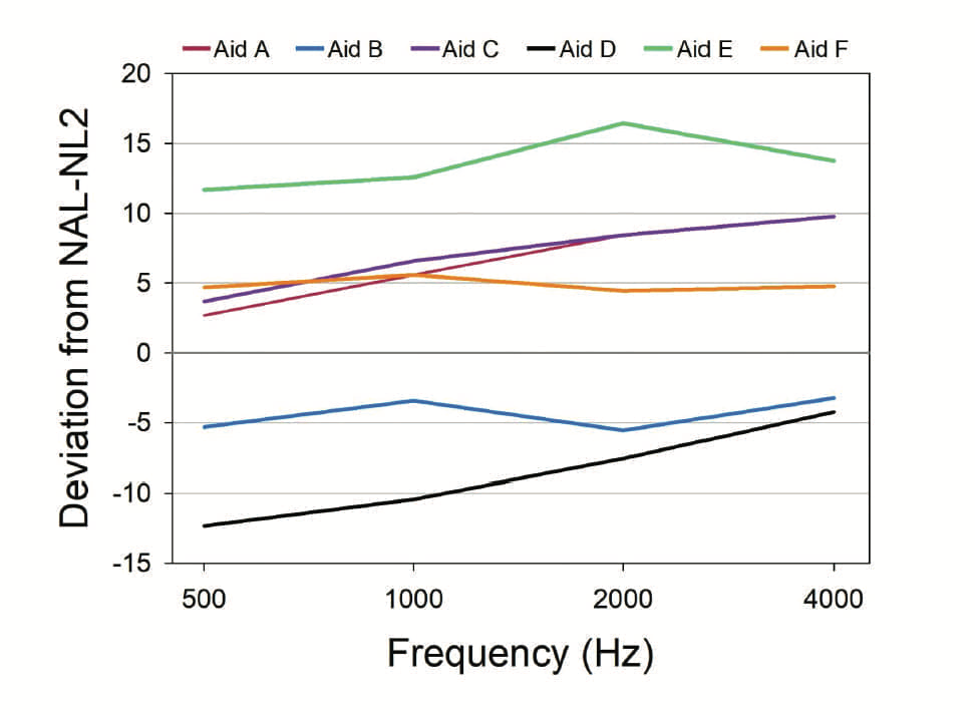
Figure 4. MPO values (deviation from NAL-NL2) displayed in the software for each of six manufacturers for an NAL-NL2 fitting, compared to the prescribed MPO values in the NAL-NL2 stand-alone software (0 dB line). (adapted from Mueller et al, 2021).
Option #2
A second choice would be to use average LDL values. There are considerable data that have calculated the “average” LDLs for a given cochlear hearing loss, and also the range of responses. Armed with a chart of this information, an HCP could simply look up the average LDL values for each frequency (hopefully already converted to 2-cc coupler), and then go to the MPO programming in the fitting software, and select these values.
While this method is much better than letting a manufacturer do the thinking, research has shown that it is very difficult to predict LDLs from the pure-tone thresholds, simply because of the patient-to-patient variability. For example, one study of 508 ears of people with confirmed sensorineural hearing losses found that for individuals with a 50 dB loss (common when fitting hearing aids), LDLs varied from ~80 dB to 125 dB HL—only 32% were within 5 dB of average (~100 dB) (Bentler & Cooley, 2002). One easily could make a 20 dB mistake or more by predicting from the hearing loss, which means that this also is poor choice.
Option #3.
This takes us to choice #3, which not surprisingly, is part of most all hearing aid fitting standards and Best Practice guidelines, including the recent APSO standard—we’re referring to the measurement of frequency-specific individual LDLs (Mueller et al, 2021). This is a relatively simple procedure, and only takes a few minutes. Testing is conducted using earphones, and is frequency and ear specific. The input signal is a pulsed pure tone, the same as used for threshold determination (there is no value in a speech LDL, as it does not assist in the programming of the hearing aids). It usually is most convenient to do the measure at the same time as the routine diagnostic, as the patient is already set-up for testing, and accustomed to hearing pulsed pure tones. This also allows for pre-programming the MPO prior to the patient’s hearing aid fitting appointment.
In the complete hearing aid fitting process, getting the aided output right is a five-step procedure: measuring the frequency-specific LDLs for each ear, converting these HL values to 2-cc coupler, going to the fitting software and programming the MPO, conducting an REAR85 measure during the fitting, and finally, determining real-world validation of the setting. We’ll walk through the five steps.
Getting the Output Right: Step #1.
- It usually is most efficient to conduct LDL testing at the same time that the patient receives the pre-fitting audiogram.
- Testing is conducted under earphones using pulsed pure tones, for each ear independently.
- For a typical audiogram, it usually is adequate to only test two frequencies/ear (e.g., even with hearing losses that might have 50 dB differences between the low and high frequencies, because of the nature of loudness growth functions, LDLs may only differ by 5-10 dB).
- The two frequencies selected should be at the lower and higher boundaries of the key frequencies that are being amplified (e.g., you would not do LDL testing at 500 Hz for an open fitting, and you would not conduct LDLs at 4000 Hz if the loss was so severe that it was unreasonable to apply significant gain).
- An ascending method is used, either 2- or 5-dB steps. It is critical that the patient is provided a chart of loudness anchors, which they will then use for their responses (See Appendix C). Starting around the expected MCL of the patient, the test signal is increased until a #7 response is given, which is the LDL. Conduct two runs to ensure reliability.
- The instructions are very important, and should be read to the patient (See Appendix D). The patient needs to know that we are looking for the point where sounds are “first uncomfortable,” not what is “tolerable.”
Getting the Output Right: Step #2
You now have the patient’s frequency-specific LDLs for both ears, so it’s time to program the MPO in the fitting software. But first:
- We need to do a little math, and convert the HL levels to 2-cc coupler values. This is accomplished using the reference equivalent threshold sound pressure levels, which go by the acronym RETSPLs (pronounced Rhet-Spulls). These are the same values that are used when your insert earphones are calibrated.
- RETSPLs tend to vary a little from study to study, but here are some average values (insert earphones) that work well (which will be added to the HL LDL values): 500 Hz=8 dB, 1000 Hz=3 dB, 2000 Hz=5 dB, 3000 Hz=3 dB, and 4000 Hz=7 dB.
- Just for practice, we’ll take a hypothetical patient, with a typical downward sloping loss, whose LDLs are 92 dB at 1000 Hz, and 104 dB at 3000 Hz. So, for 1000 Hz, we’ll add the RETSPL of 3 dB and obtain a 2-cc coupler value of 95 dB SPL. For 3000 Hz, which also has a 3 dB RETSPL, we’ll add this to the HL LDL of 104 dB, and obtain the 2-cc coupler value of 107 dB.
- Armed with these 2-cc coupler values, we then go to “MPO Programming” in the software, and adjust the frequency-specific handles so that we obtain our desired 2-cc coupler output levels
Getting the Output Right: Step #3
- Open the fitting software for the patient, and go to the screen where it’s possible to set the MPO. Apply the newly calculated 2-cc coupler output values.
- With some manufactures, you simply can scroll through output values until the desired value is obtained. With other systems, such as Signia, it’s a matter of reducing the output on the screen to the desired levels.
- Adjust the setting appropriately for the measured LDLs. Once this is accomplished, interpolate and adjust the surrounding frequencies accordingly to obtain a smooth output curve.
- Conduct this for both ears, assuming it’s a bilateral fitting.
A software example of this is shown in Figure 5, using the values from our previous patient (e.g., converted 2-cc coupler values of 95 dB at 1000 Hz and 107dB at 3000 Hz). The handles on the bottom of the screen were adjusted until the desired values were obtained. Adjacent frequencies were then shaped to follow the curve. Notice that the maximum output had to be reduced by 15 dB or more as some frequencies—this is exactly why we follow these steps.
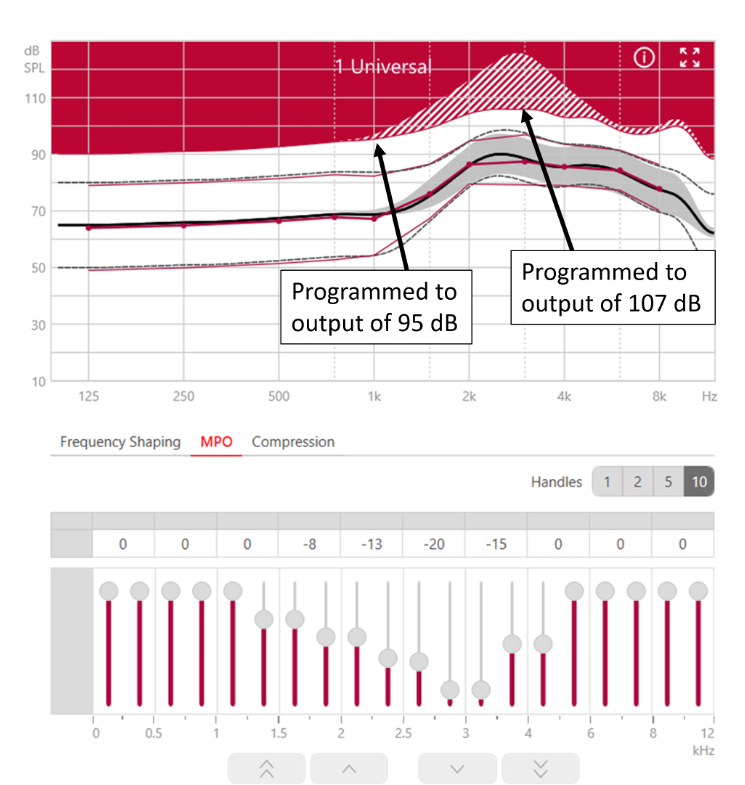
Figure 5. Screen shot of Connexx software illustrating the programming of the MPO (based on the patient’s LDLs) using the output handles in the software.
Getting the Output Right: Step #4
After the hearing aids have been programed, the next step is to carry out real-ear verification that the original measurements and subsequent programming were correct. This is conducted at the same time as the routine speech-mapping verification.
- The patient is seated and positioned correctly for probe-mic testing, probe-tube is placed appropriately in the ear canal (i.e., the tip is within 5 mm of the eardrum).
- The hearing aids should be programmed to the NAL-NL2 or DSL fitting algorithm. If this is a new user, and it has been determined to initially fit the patient under target, for this RESR85 measure, adjust to the true target (we assume the patient will be moved to this setting after some acclimatization).
- Most probe-mic systems have an automatic set-up for the REAR85 procedure. A swept tone is delivered at 85 dB SPL and the output is displayed on the fitting screen.
- The output of this measure is compared to the earcanal SPL LDLs displayed on the screen. If steps #1, #2 and #3 were all conducted correctly, the measured output should be very close to the displayed LDLs.
- If a good match is not obtained, go to the MPO programming and adjust frequency specific output so that it falls just below the LDL for all frequencies.
- If the output is considerably below the desired levels, and raising the MPO does not change the output, it’s probably that the MPO is being controlled by the WDRC. Consider raising the “gain for loud” to provide the patient with more headroom.
- It is possible that if it is an open fitting, and the patient still has significant residual earcanal resonance (e.g., 10-15 dB or more), the observed curve may be the REOR (directly input) rather than the RERAR85 (hearing aid output). In this case, of course, changing the programmed MPO will not alter the observed curve. It is helpful to conduct an REOR just before the REAR85 (same input but with the hearing aid muted), as this output will then be stored on the screen for comparison.
Figure 6, is an example of an REAR85 compared to the patient’s earcanal LDL SPLs (Mueller et al, 2017). Note that we have a fairly good match across frequencies (there is little gain in the lows, and hence, these values fall below LDL targets). The output in the 3000 Hz region, however, is a little high, and we would probably take this down ~5 dB just to be safe. Also, because this output peak is at the peak frequency of the typical earcanal resonance, and, this is an open fitting, we would most certainly run an REOR to ensure that we truly are looking at the RESR85 and not the REOR.
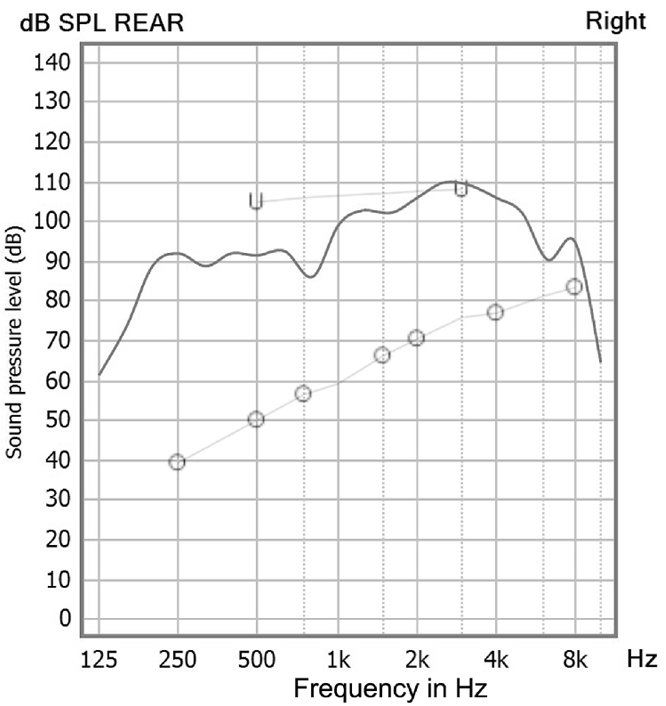
Figure 6. Example of REAR85 measure and the comparison to the patient’s LDL (now converted to earcanal SPL). Note peak around 3000 Hz may have to be reduced slightly (adapted from Mueller et al, 2017).
Getting the Output Right: Step 5
In the final step, we will go back to a behavioral measure, which is where we started in Step #1. This measure has the patient again using the chart and instructions shown in Appendix C. In this case, however, the patient is tested bilaterally, while aided. In general, bilateral LDLs are very similar unilateral ones, but this final verification will then ensure no LDL problems will occur once the patient leaves the clinic.
- Once the REAR85 measure and programming (if necessary) is complete, the patient remains seated in front of the probe-mic equipment with the probe assembly still attached.
- The patient is given the Loudness Anchors chart and the instructions are repeated (see Appendix C).
- In the probe-mic software, it is possible to select different noise signals. For this measure we typically use both speech babble and vacuum cleaner noise. For both, we would expect a rating of #6. A rating of #5 is okay. In nearly all cases, this will be the finding.
- If the patient gives a rating of #7, repeat the measure a few times—often the patient is initially startled by the noise, and ranks it higher than it really is. If the patient consistently rates the noise #7, then go to the programming software and reduce the MPO in the region where the peak appears. Repeat until a #6 rating is obtained.
That’s it. Five simple procedures. And like Goldilocks, the porridge should be “just right!”
Frequently Asked Questions
Q: Is it okay to do a speech LDL rather than pure-tones?
A: Consider why we do the LDL—to program the MPO. Let’s say you had a speech LDL of 90 dB HL. How would you convert that to 2-cc coupler? How would you know, from that number, what 2-cc coupler setting to use for 500 Hz? For 3000 Hz? There is little value in a speech LDL except maybe to quickly identify a person who is very sound-sensitive, or has hyperacusis, which is rare.
Q: I’ve heard from several people that measured LDLs aren’t very reliable—patients aren’t consistent in their responses.
A: That simply isn’t true, unless you do the testing wrong. Research has shown that if the procedures outlined here are used, test-retest for the LDL measure will be ~2.5 dB, about the same as for pure-tone threshold measures (see Mueller et al, 2014 for review). Yes, on occasion there will be the cognitively impaired person who just doesn’t understand the task, but this is rare.
Q. Regarding the RESR85 real-ear measure, wouldn’t it make more sense to use a speech-shaped input signal, rather than a swept pure tone?
A. Well, you’re maybe thinking that loud speech is more common for people to experience, which is probably true for most patients. But there are a couple reasons we use swept tones. First, we did the unaided testing for LDLs with pure tones, so we’re now comparing outputs using the same test signals. A second issue is that a pure tone will drive the hearing aid to a higher output than a broad-band signal like speech. Using this input, therefore, tells us just how high the aided output might get—a worst case scenario—some real-world loud sounds have a fairly narrow frequency range.
Q. For your REAR85 measure, you didn’t mention doing an RECD. Not necessary?
A. Good question. We assume you’re referring to then using the individual RECD when the HL LDL is converted to earcanal SPL (i.e., HL LDL + RETSPL + RECD = earcanal SPL LDL). RECDs for adults do not differ by too much (s.d.’s ~3 dB), so it’s unlikely you’d make a big mistake by using the average values (stored in your probe-mic system), but yes, adding the individual RECD, rather than using the average values would give you a greater degree of accuracy when comparing the REAR85 to the earcanal SPL LDLs.
V.6.4: Pre-Fitting Needs Assessment
To this point, we have discussed objective measures that can be used during the assessment that is conducted prior to the fitting of hearing aids. We recommend, however, also using self-assessment inventories to complement the objective findings. That is, some type of formal questionnaire completed by the patient that relates to their hearing difficulty, communication needs, the use of hearing aids, and their candidacy in general should be included in this pre-fitting battery.
The information collected using these inventories can help determine candidacy, significantly influence pre-fitting counseling and in some instances, alter fitting decisions. In some cases, the scores collected before the fitting serve as a baseline, as they can be compared with results measured after a patient wears hearing aids for a period of time to directly quantify subjective hearing aid benefit, reduction in hearing handicap, or other outcomes of interest—something we talk about in QuickTakes Volume 6 (Part 2).
There are pre-fitting inventories that are geared toward determining communication difficulty, whereas some are geared toward examining the patient’s expectations. Others may be focused toward perceived handicap. Once the hearing care professional (HCP) determines the types of questions that need to be answered, an inventory that addresses these specific issues can be selected.
Reasons to Use Pre-Fitting Self-Assessment Scales
To get us started, here are six general uses for standardized scales as part of the pre-fitting process (adapted from Mueller et al, 2014):
- Assist in determining if a patient is a candidate for hearing aids. Research has shown that a pre-fitting test such as the Hearing Handicap Inventory for the Elderly/Adult (HHIE/A) is as useful as the pure-tone audiogram for determining who will use and benefit from hearing aids (see work of Humes, 2022).
- Determine the need for pre-fitting counseling. The pre-fitting assessment that shows scores that are very inconsistent with other audiometric findings can signal denial of the hearing problem.
- Assist in establishing realistic expectations. When the pre-fitting Client Oriented Scale of Improvement (COSI) is constructed, it’s important to note the situations selected by the patient, and their expected outcomes. Are they realistic given the patient’s hearing loss?
- Establishing a baseline. Many pre-fitting self-assessment inventories also can be used as an outcome measure. Did the hearing aids provide the expected improvement in benefit and satisfaction? Did they reduce the hearing handicap?
- Assist in establishing goals to select and prioritize technology. Does the patient report difficulties in background noise that warrant assistive listening devices?
- Quality Assurance Management. The pre-fitting scores for a scale such as the HHIE/A can be analyzed over time for groups of patients, and then compared to norms, or previous clinical encounters. Is there a trend in the handicap that is being reported? Is this impacting on outcome measures?
There are at least 10 or so pre-fitting self-assessment inventories that have been developed and researched—see Mueller et al (2014) for review. It obviously isn’t practical for a busy clinician to conduct all, or even most of these. For this article, we have selected three of the most popular and well-researched for your routine use. Importantly, these three tools measure different domains related to prospective hearing aid users.
Hearing Handicap for the Elderly/Adult (HHIE/A)
Perhaps the oldest and most well-known self-assessment scale related to the pre-fitting of hearing aids is the HHIE (Ventry & Weinstein, 1982). As the name suggests, this scale assesses handicap—specifically related to the emotional and social aspects of having a hearing loss. The adult version is very similar to the elderly version—the usual cut-off is 65 years of age, but someone over 65 who is still active and/or employed would be given the adult version. The original versions of both are 25 questions, however, research has shown the shortened versions have comparable reliability and validity with the longer 25-item version, with an adequate internal consistency, and also have high test-retest reliability. For clinical use, therefore, we recommend the 10-item versions of both the HHIE and the HHIA. We have included the HHIE-10 item in Appendix E, and the HHIA-10 item in Appendix F. The HHIE was designed to have questions that fall into two general areas: emotional and social/situational, and the 10-item version has 5 for each of the categories. Normally, the two categories are combined for one single test score for the ten 1tems.
Procedure for administration and scoring. One feature of the HHIE that has contributed to its popularity is that it is very easy to administer and score.
- The HHIE could be completed in the waiting room prior to testing, or mailed to the patient to complete before the clinic visit. It is recommended, however, that HHIE items be read to the patients face-to-face to help prevent them from skipping questions because of the belief it is not applicable to them.
- For each of the 10 questions of the HHIE/A, the patient has the choice of three answers: Yes (scored 4 points), Sometimes (scored 2 points), and No (scored 0 points).
- Once completed, the scores for the 10 items simply are added, with 40 representing the highest (worse) score, a very significant handicap.
- The general guidelines for interpreting the results are: 0–8: No significant perception of a hearing handicap, 10–22: Mild to moderate perception of a hearing handicap, >22: Perception of a severe handicap. An example of a scored HHIE is shown in Figure 7.
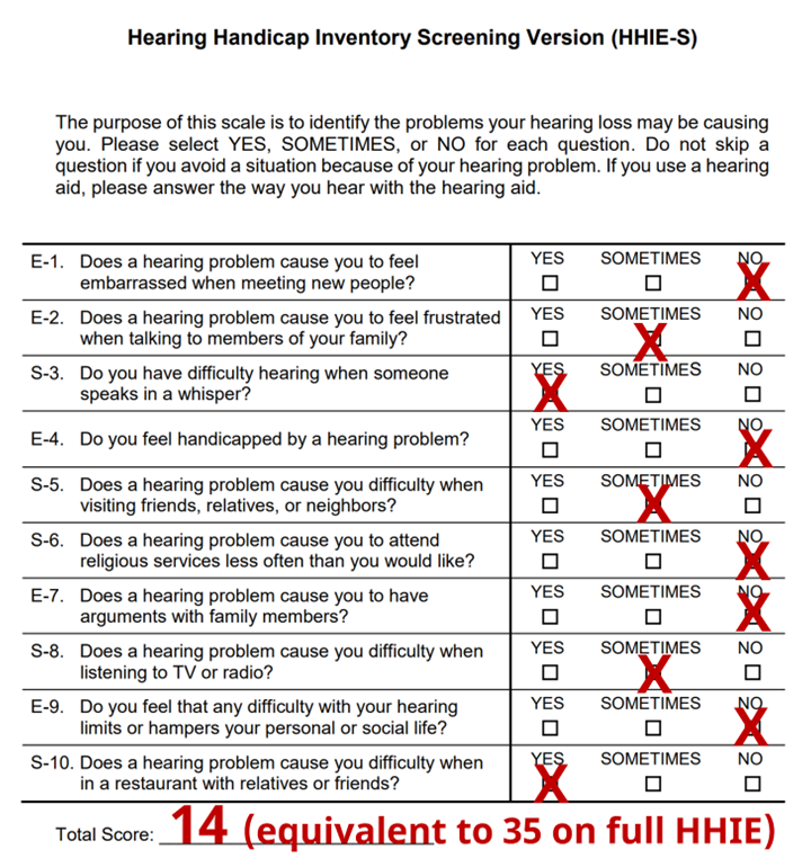
Figure 7. Results for the 10-item HHIE. This person would be considered to have a perception of a mild hearing handicap.
Abbreviated Profile of Hearing Aid Benefit (APHAB)
We have just discussed the HHIE, perhaps the most utilized hearing aid fitting pre-test over the past few decades. We would guess that the second most popular, is the APHAB, a scale developed by Robyn Cox and colleagues at the University of Memphis (Cox and Alexander, 1995). Although normally thought of as an outcome measure, the APHAB also is a popular pre-fitting tool for one main reason: to calculate benefit with hearing aids, we need an unaided baseline. There are several good reasons why the APHAB should be used routinely as part of the hearing aid fitting other than simply obtaining baseline unaided information. As outlined by the developer, Robyn Cox:
- Predict success from unaided scores.
- Use the unaided scores for patient counseling.
- Compare results with different hearing aids.
- Measure benefit from the fitting.
- Compare group outcomes over time or for different clinics
The APHAB is composed of 24 items that are scored in four subscales (six questions each). The subscales are:
- Ease of Communication (EC): The strain of communicating under relatively favorable conditions. “I have difficulty hearing a conversation when I’m with one of my family at home.”
- Reverberation (RV): Communication in reverberant rooms such as classrooms. “When I am talking with someone across a large empty room, I understand the words.”
- Background Noise (BN): Communication in settings with high background noise levels. “When I am listening to the news on the car radio and family members are talking, I have trouble hearing the news.”
- Aversiveness (AV): The unpleasantness of environmental sounds. “The sounds of running water, such as a toilet flushing or a shower, are uncomfortably loud.”
Administration and Scoring. Fortunately, the APHAB is included in the Questionnaire Module of NOAH, which facilitates administration and scoring. Some hearing aid manufacturers also have it as part of their software.
- The APHAB can be administered as a paper and pencil test, or using the computer software version. if you plan to administer this test during the hearing aid selection visit, computer scoring is highly recommended so that the information can quickly and efficiently be used to aid in selection.
- The 24 items of the APHAB are scored on a seven-point scale. A percent value, shown on the form, is designated for each letter answer: A: Always (99%); B: Almost Always (87%); C: Generally (75%); D: Half-the-time (50%); E: Occasionally (25%); F: Seldom (12%); G: Never (1%).
- The questions are specifically designed so that someone with normal hearing and no hearing problems would mark A or B for some questions, but F or G or others. One can then quickly observe the pattern of responses—if all are in the A-B, or F-G range, the patient didn’t understand the test, or isn’t taking the questions seriously.
- The instructions for completing the APHAB are as follows: “Please circle the answers that come closest to your everyday experience. Notice that each choice includes a percentage. You can use this to help you decide on your answer. If you have not experienced the situation we describe, try to think of a similar situation that you have been in and respond for that situation. If you have no idea, leave that item blank.”
When using the APHAB for pre-fitting counseling, it is helpful to examine the scores for each one of the four subscales. Once these scores have been obtained, you will then want to compare them with normative data (norms). One counseling approach is to compare the patient with normal hearing individuals. We prefer to plot the findings on two different charts, one from elderly patients with normal hearing (if the patient is “elderly”), and a second chart for young normal hearing individuals. The findings for a sample patient for the four different sub-scales are shown in Figure 8.
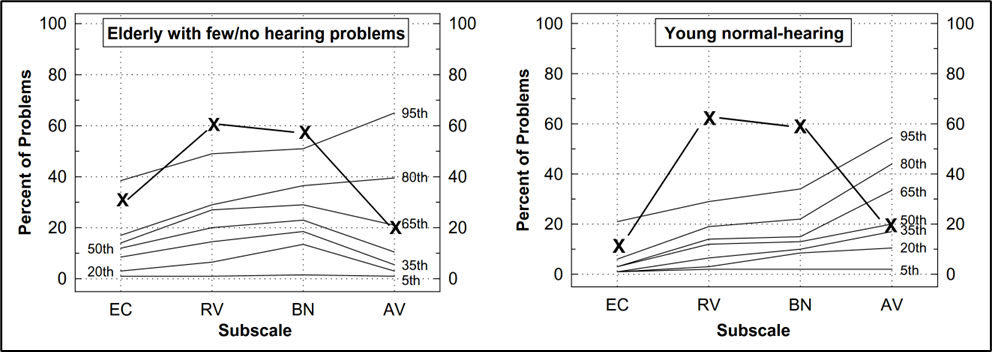
Figure 8. Example of a patient’s APHAB scores for the four different sub-scales, plotted on a chart that shows percentiles for elderly with few hearing problems (left panel) and percentiles for young individuals with normal hearing (right panel).
Client Oriented Scale of Improvement (COSI)
The COSI is probably the most commonly used outcome measure among clinicians. However, it is also very useful for formalizing the specific listening goals a patient has for hearing aids, which is why we’ve included it here as an important pre-fitting assessment tool. Because it already is being used for outcome assessment, fitting goals and expectations easily can be assessed without introducing a new scale to the patient.
Harvey Dillon and colleagues cite four goals related to the development of the COSI (Dillon et al, 1997):
- acceptable reliability (test-retest stability),
- acceptable validity (correlations to other scales believed to be valid),
- be convenient to use, and
- capable of improving, as well as measuring, rehabilitation outcomes.
One issue related to most all standardized self-assessment scales is that the items should be relevant for the hearing aid user. The COSI was designed to accomplish these goals, as well as eliminate irrelevancy. Further, it allows patients to identify and rank order listening goals that are most important to them as an individual. For example, two patients may both have the goals of understanding speech in a noisy restaurant and understanding small children speaking. However, the importance of these two goals, and which one is most important, may be very different for the two patients.
In short, the COSI starts off as a blank page, then allows patients, with the help of the HCP, to design their own questionnaires. The patients provide specific listening situations that are important for them. Making situations very specific is useful because it allows patients to easily remember and pay attention to situations when asked about hearing outcomes. After providing three to five specific situations, theitems are then rank-ordered for importance. Recall that the COSI was designed for measuring outcomes, but the rationale for relevancy and situation importance also applies to hearing aid selection and expectation ratings.
Administration and Scoring. As we mentioned, unlike any other scale, the COSI starts off as a blank sheet. It is certainly possible that after seeing hundreds of patients, no two COSIs will look the same.
- The process begins by having the patient identify up to five specific listening situations in which he or she would like to hear better. It is important to stress these are listening situations and not necessarily just communication. For some patients, the listening goals may all focus on communication, but for other listeners (e.g., a patient with a severe hearing loss), the goal may be to better hear when someone knocks at the door.
- Some patients will happily list six or seven, but for other patients, it is a struggle to come up with three. We suggest having at least three whenever possible.
- It is important to make each item as specific as possible. “Hearing in background noise” would not be specific enough. After some questioning, this could be narrowed to “Hearing my friends while playing cribbage at the bar at the Elk’s club.”
- Once one situation is identified, you then move on and establish other situations. Some patients will only focus on the most difficult, often situations where normal hearing individuals have difficulty. This can be a problem for three reasons: (1) These situations probably are not really the most important, (2) These situations probably occur infrequently, and (3) It will be difficult to meet expectations as these are the very situations where we expect the least benefit from amplification.
- It is helpful, to calibrate the form, to pause and ask the patient to provide an estimate of how often they are involved with the situation that they nominate. It’s common to nominate a situation that was very difficult, but maybe only happens for an hour each month. You will want to avoid these.
- After all situations have been identified, it is then helpful to go back, review all situations, and have the patient rank-order them. Simply place a 1 for most important, 2 for the second most important, and so on in the box to the left of the item. Often, the item that the patient mentions first is something that just happened recently and is not the most important. Research has shown, that when patients were asked a month later to re-select the COSI items, 96% selected two that were the same, 64% selected three the same, but none selected four the same (Mormer & Palmer, 2001).
- Once the items have been prioritized, we then have the patient select their expectations for each one of the items (see Figure 9).
- Following the hearing aid fitting (e.g., after several weeks of hearing aid use) the patient then completes the COSI again, this time ranking benefit for each item. The benefit ratings and the expectations are then compared—hopefully showing a good match (see QuickTakes 6.8 for a review of this procedure).
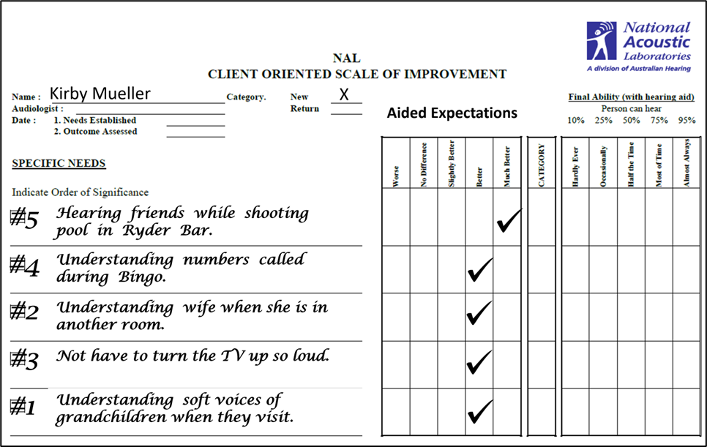
Figure 9. Completed pre-fitting COSI form. Patient listed five situations where communication needs to be improved, and rank ordered them. He then listed aided expectations. After several weeks of hearing aid use, he will use this same form to rate benefit for each situation. Expectations and benefit will then be compared.
Frequently Asked Questions
Q. What’s an example of how the HHIE is different from the HHIA?
A. I think we mentioned that on the 10-item version, there are two questions that are different. Here’s an example from Question #6. HHIE: Does a hearing problem cause you to attend religious services less often than you would like? HHIA: Does a hearing problem cause you problems in the movies or theater? We actually prefer the HHIA question for both scales.
Q: Is there an advantage of doing the 25-itme version of the HHIE/A?
A: For clinical use, probably not. The 10-item version measures up quite well against the 25-item scale.
Q: Should I expect the APHAB scores on the background noise (BN) scale to agree with the patient’s QuickSIN findings?
A: If, the QuickSIN was conducted at average conversational level, there should be a positive correlation. Recall, however, that we conduct the earphone QuickSIN testing at a high presentation level. Hence, someone with a mild-moderate loss might do quite well when speech is made audible, but still have problems in the real world, so in this case, the APHAB would reveal more difficulty than the QuickSIN.
Q: What if the patient skips many of the questions on the APHAB, saying that they don’t apply?
A: This happens sometimes, which is why it’s best to deliver the questions knee-to-knee with the patient. The HCP can then compose a similar situation that is familiar. For scoring, at least three of the six questions for each category much be answered.
Q: What if a person’s COSI expectations are unreasonably high?
A: To some extent, this depends on your counseling approach, but we would talk through this before ever sending the patient out the door with the hearing aids. This is also why we encourage patients to think about common everyday situations where they frequently have problems, not just the most difficult ones infrequently encountered.
References
Bentler, R., & Cooley, L. (2002). An examination of several characteristics that affect the prediction of OSPL90 in hearing aids. Ear and Hearing, 22(1), 58-64.
Bess, F. (1983). Clinical assessment of speech recognition. In D. F. Konkle & W.F. Rintelmann (Eds.), Principles of speech audiometry (pp. 127-201). Baltimore: University Park Press.
Cox, R. M., & Alexander, G. C. (1995). The abbreviated profile of hearing aid benefit. Ear and Hearing, 16(2), 176-186.
Dillon, H., James, A., & Ginis, J. (1997). Client Oriented Scale of Improvement (COSI) and its relationship to several other measures of benefit and satisfaction provided by hearing aids. Journal of the American Academy of Audiology, 8(1), 27-43.
Dubno, J. R., Lee, F. S., Klein, A. J., Matthews, L. J., & Lam, C. F. (1995). Confidence limits for maximum word-recognition scores. Journal of Speech and Hearing Research, 38(2), 490-502.
Guthrie, L. A., & Mackersie, C. L. (2009). A comparison of presentation levels to maximize word recognition scores. Journal of the American Academy of Audiology, 20(6), 381-390.
Humes, L.E. (2022). 20Q: Assessing auditory wellness in older adults. AudiologyOnline, Article 28087. Available at www.audiologyonline.com
Hurley, R., & Sells, J. (2003). An abbreviated word recognition protocol based on item difficulty. Ear and Hearing, 24(2), 111-118.
Killion, M.C., Niquette, P.A., Gudmundsen, G., Revit, L.J., & Banerjee, S. (2004). Development of a quick speech-in-noise test for measuring signal-to-noise ratio loss in normal-hearing and hearing-impaired listeners. Journal of the Acoustical Society of America, 116(4 Pt 1), 2395-2405.
McArdle, R.A., & Wilson, R.H. (2006). Homogeneity of the 18 QuickSIN lists. Journal of the American Academy of Audiology, 17(3), 157-167.
Mendel, L., & Owen, S. (2011). A study of recorded versus live voice word recognition. International Journal of Audiology, 50(10), 688-693.
Mormer, E., & Palmer, C. (2001). Reliability of hearing aid expectations responses. Paper presented at the annual meeting of the American Academy of Audiology.
Mueller, H.G. (2010). Three pre-tests: What they do and why experts say you should use them more. The Hearing Journal, 63(4), 17-24.
Mueller, H.G., Ricketts, T.A., & Bentler, R. (2014). Modern Hearing Aids: Pre-Fitting Testing and Selection Considerations. San Diego: Plural Publishing.
Mueller, H.G. (2016, September). Speech-in-noise testing for selection and fitting of hearing aids: Worth the effort? AudiologyOnline, Article 18336. Retrieved from https://www.audiologyonline.com.
Mueller, H.G., Ricketts, T., & Bentler, R. (2017). Speech Mapping and Probe-Microphone Measures. San Diego: Plural Publishing.
Mueller, H.G., & Hornsby, B.W.Y. (2020). 20Q: Word recognition testing - let's just agree to do it right! AudiologyOnline, Article 26478. Retrieved from www.audiologyonline.com.
Mueller, H.G., Stangl, E., & Wu, Y-H. (2021). Comparing MPOs from six different hearing aid manufacturers: Headroom considerations. Hearing Review, 28(4), 10-16.
Mueller, H.G., Coverstone, J., Galster, J., Jorgensen, L., & Picou, E. (2021). 20Q: The new hearing aid fitting standard - A roundtable discussion. AudiologyOnline, Article 27938. Available at www.audiologyonline.com.
Roeser, R. J., & Clark, J. L. (2008). Live voice speech recognition audiometry - Stop the madness. Audiology Today, 20(1), 32-33.
Thornton, A., & Raffin, M. (1978). Speech-discrimination scores modeled as a binomial variable. Journal of Speech and Hearing Research, 21(3), 507-518.
Thibodeau, L. M. (2007). Speech audiometry. In R. Roeser, M. Valente, and H. Hosford-Dunn (Eds.), Audiology: Diagnostics (pp. 288-313). New York: Thieme Medical Publishers.
Ventry, I. M., & Weinstein, B. E. (1982). The Hearing Handicap Inventory for the Elderly: A new tool. Ear & Hearing, 3, 128–134.
Wilson, R.H. (2011). Clinical Experience with the Words-in-Noise Test on 3430 Veterans: Comparisons with Pure-Tone Thresholds and Word Recognition in Quiet. Journal of the American Academy of Audiology, 22(7), 405-423.
Appendix A. Critical differences for monosyllabic words.
Appendix B. “Red Flag” cut-offs for word recognition scores.
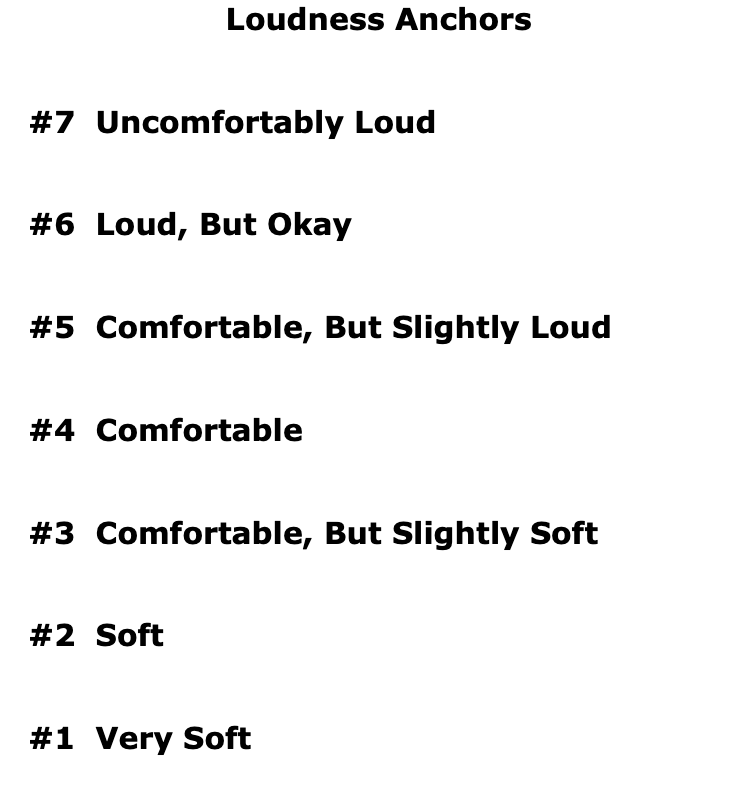
Appendix C. Loudness anchors for LDL testing.
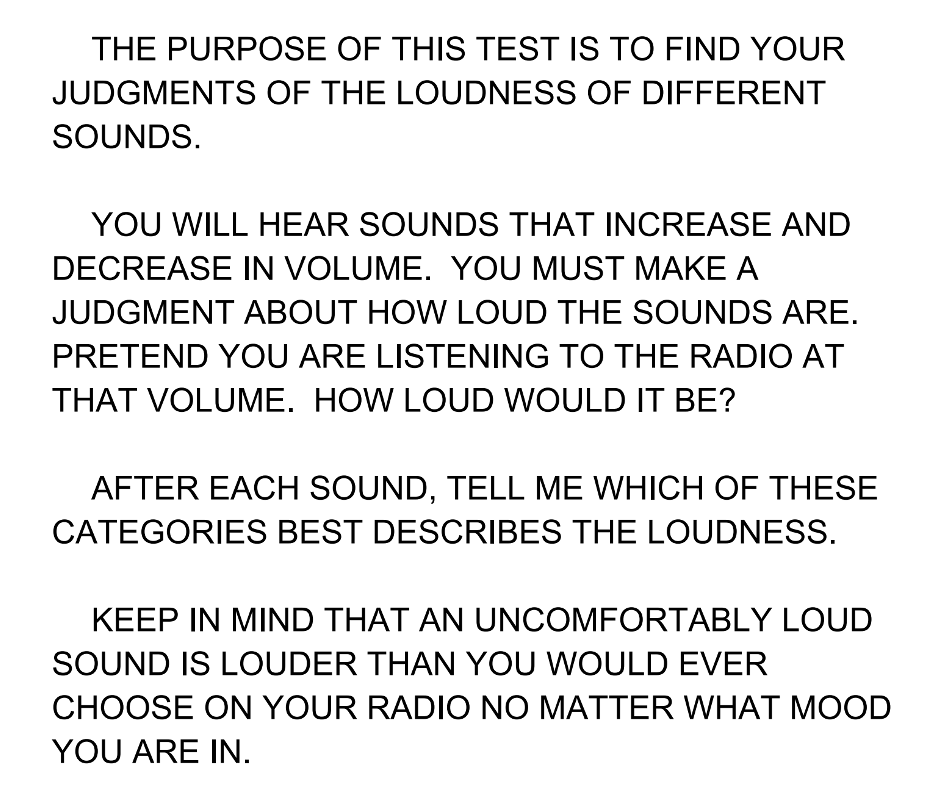
Appendix D. Instructions for LDL testing.
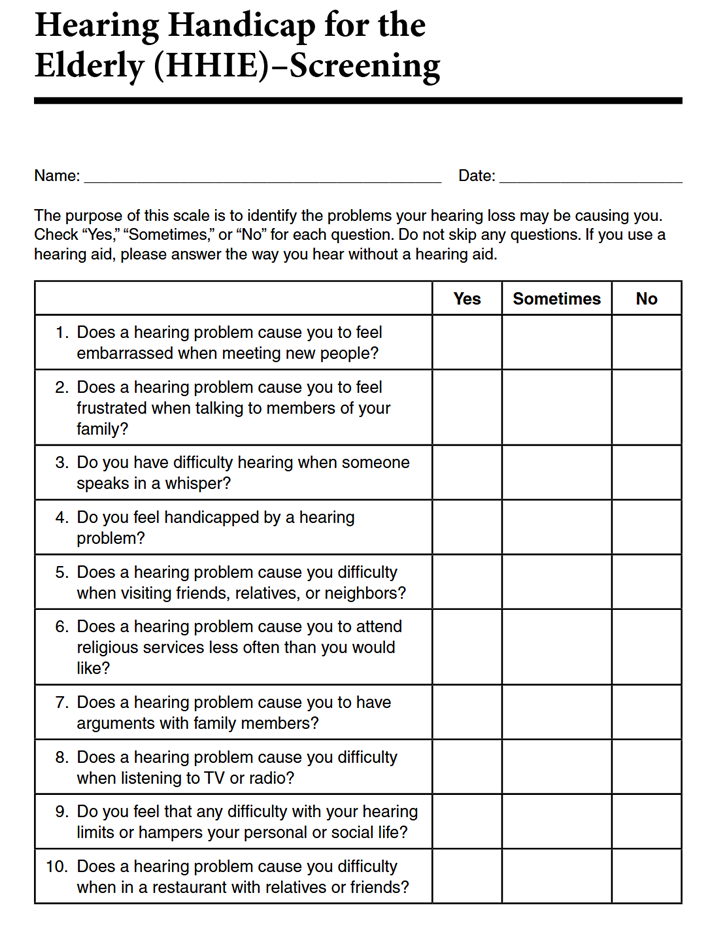
Appendix E. Screening version: Hearing Handicap Inventory for the Elderly (HHIE-S).
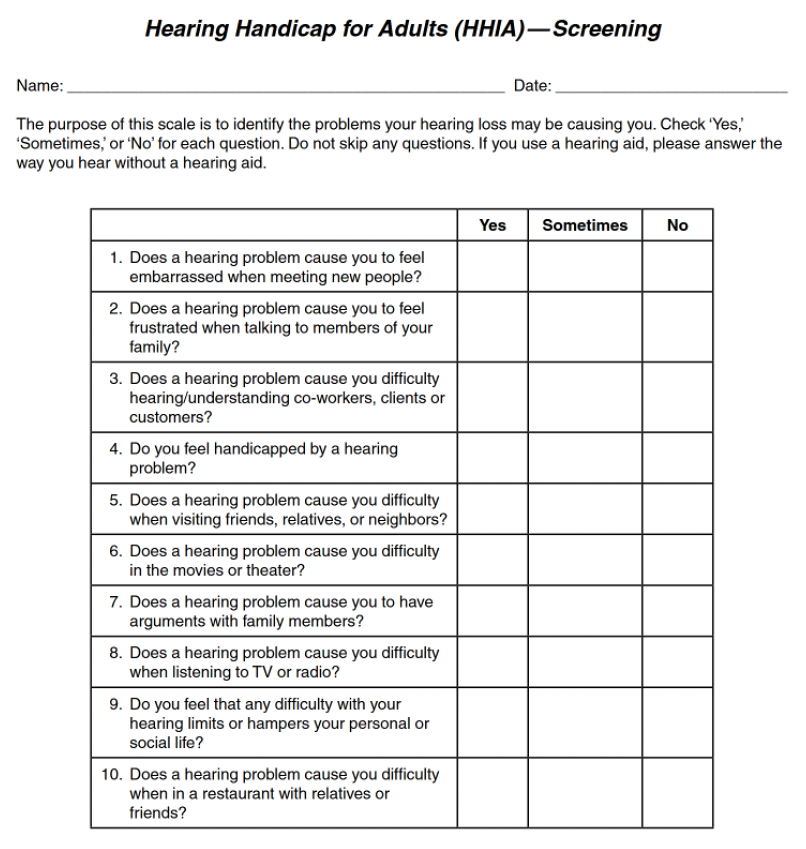
Appendix F. Screening version: Hearing Handicap Inventory for the Adult (HHIA-S).
Citation
Taylor, B. & Mueller, H. G. (2023). Research QuickTakes Volume 6 (Pt. 1): hearing aid fitting toolbox —important pre-fitting measures. AudiologyOnline, Article 28707. Retrieved from https://www.audiologyonline.com