 From the Desk of Gus Mueller

You don’t have to listen to national news very long before you start hearing about the U.S. economy. Inflation. Interest rates. Unemployment. The national debt. Then there are the important over-arching factors such as human resources, physical capital, natural resources, and technology.
How about audiology economics? We don’t hear as much about that. One area that always is of interest is the workforce. Are we graduating enough students? Will the demand for audiologists continue to grow? Why are so few men attracted to the profession? Is it time to rethink the AuD degree? We’ve doubled the education time and the student debt, but has the wage growth changed accordingly?
Then there is the important outflow issue—audiologists are leaving the profession at a much higher rate than what we see for similar healthcare professions. Why is this? A lot to think about, and this is just one area of audiology economics. Fortunately, we have an expert who has studied many of these issues impacting our profession.
Amyn M. Amlani, PhD, is President of Otolithic, LLC, a consulting firm that provides audiologic competitive market analysis and support strategy, economic and financial assessments, and consumer insights. He has previously served as Director of Professional Development and Education for Audigy, and has held faculty positions at the University of Arkansas for Medical Sciences in Little Rock, University of North Texas and Texas Tech University.
Dr. Amlani’s numerous publications have focused on economic, marketing, and legislative analyses related to the demand (e.g., patient services, technology uptake) and supply (e.g., workforce analysis, professional education, service delivery models) of hearing healthcare on patient care. He serves as section editor of Economics for Hearing Health Technology Matters and as Director-at-Large for the Academy of Doctors of Audiology.
If you’ve attended the Academy of Audiology’s annual meeting the last few years, you know that you can always count on Amyn (along with his colleague Victor Bray) to have a couple of presentations regarding the latest data related to audiology economics. We’re fortunate that he’s sharing a summary of many of those findings with us here at 20Q.
Gus Mueller, PhD
Contributing Editor
Browse the complete collection of 20Q with Gus Mueller CEU articles at www.audiologyonline.com/20Q
20Q: Audiology Economics
Learning Outcomes
After reading this article, professionals will be able to:
- Discuss the reason that lowering retail prices will not yield substantial result in increased hearing aid units sold.
- Describe factors that influence accessibility to hearing care services and technology.
- Discuss the current state of the workforce in audiology and its implications on meeting the needs of the consumer.

1. House payment, car payment, childcare, and trying to pay down my student loans. Are you here to help?
Not directly, but if you like, we could talk about some “big picture” audiologic economic factors that just might impact your real-world personal concerns down the road.
2. Before we get started, how is it that you’re this expert on the economics of audiology?
Well, I don’t know that I’m an expert, but it all started about 30 years ago. During my master’s program at Purdue University, I was fortunate to be instructed and mentored by audiologist David Goldstein, PhD. As part of his introductory hearing aids course, he had the class review and discuss the outcomes from MarkeTrak III (Kochkin, 1992) that highlighted the positive effects of rehabilitating hearing loss through hearing aid adoption (e.g., acclimatization, improved audibility, increased consumer satisfaction) and the barriers that precluded uptake (e.g., stigma, lack of physician referrals, high retail cost, low accessibility). Having been an economics major early in my undergraduate education years, the issue of cost fascinated me, and Dr. Goldstein agreed to mentor a project on this topic. The project consisted of applying inflation (i.e., Consumer Price Index [CPI]) over a 30-year span to the retail price of a single-unit hearing aid available in 1960. Then, we compared the findings from our time-series inflation results to the annually reported average market price of retail hearing aids over the same period. Overall, the descriptive comparison revealed that average market retail prices of hearing aids were noticeably less than the rate at which inflation increased (Amlani & Goldstein, 1995). Later, while working on my PhD, I got involved in some projects that provided me with the skills needed to identify, evaluate, and predict gaps and inefficiencies of product- and service-related factors that impede potential growth opportunities, and apply a systems analysis approach to improve operational efficiency through strategic planning.
3. Then you started doing research in this area?
I did. In 2003, I collaborated with an economist with the objective to gain a better understanding of why hearing aid adoption growth remained stagnated, despite the introduction of fully digital, multichannel hearing aids that offered advanced signal processing (e.g., directional microphones, noise reduction, feedback cancellation). In addition, much of the discussion at that time was centered around lowering the retail cost of hearing aids to increase adoption rates, including a government subsidized hearing aid tax credit (for a review, see Amlani, 2010). To gain a better understanding of the hearing aid market’s efficiencies, we applied the economic principles of demand and supply.
To undertake this analysis, then Executive Director of the Better Hearing Institute (BHI), Sergei Kochkin, provided us with industry data (e.g., quantity sold, average price) ranging between 1981 and 2002. In addition to industry data, we applied other economic factors, such as the overall US economy (i.e., growth, recession), predicted organic growth in the hearing-impaired population, and real-personal income to various logistic regression models. The big picture takeaways from the analyses revealed that: (i) consumer confidence in adopting hearing aids was highly correlated with the changes in the US economy (e.g., delayed purchasing behavior during a recession), and (ii) the demand function was inelastic (Amlani & De Silva, 2005).
4. “Inelastic?”
I’ll explain. The price elasticity of demand is an economic concept that measures the responsiveness within a market between the quantity demanded for a product or service as a function of changes in price. A market is classified as elastic (i.e., price sensitive) when the measured responsiveness—called a demand function—exceeds |1.00|. Here, as retail price is increased (or decreased), there is an appreciable decrease (or increase) in quantity sold. Conversely, a market is classified as inelastic (i.e., price insensitive) when the demand function is less than |1.00|. In this instance, as retail price is increased (or decreased), there is no appreciable decrease (or increase) in quantity sold.
5. What is the demand function as it relates to the hearing aid industry?
In Model 1 of the Amlani & De Silva (2005) paper, we reported a demand function of |0.49| for the industry. This inelastic demand function indicates that when hearing aids are provided at financial no-cost (i.e., $0.00) to the consumer, only 49 individuals—out of a possible 100 individuals—would adopt amplification technology. This outcome also means that 51 individuals—out of the same 100 individuals—are unwilling to adopt this technology even though they do not incur a cost. (Note: Throughout our discussion here, price and costs are related only to the acquisition of the product and professional services. Other costs—such as time off from work, travel time, etc.—have not been accounted for.)
Figure 1, adopted from MarkeTrak IX (Abrams & Kihm, 2015), displays recent global demand for hearing aids. In the figure, Norway boasts the highest adoption rate of only 42.5% despite the fact no cost is expected from the consumer. This also means that nearly 60% of Norwegians eligible for free hearing aids and professional services do not participate in this healthcare benefit.
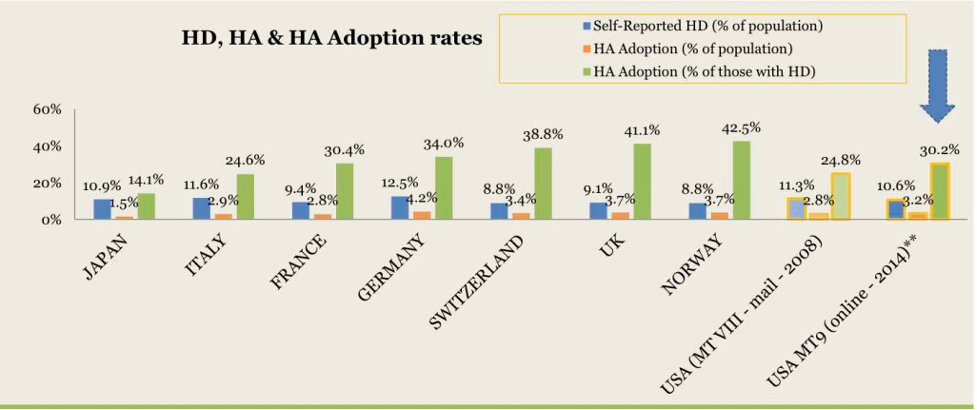
Figure 1. Global hearing aid adoption rates reported in MarkeTrak IX. Key: HD = hearing difficulties, HA = hearing aid.
In the US, we see a similar demand for hearing aid adoption that is fully subsidized through the Veterans Administration. Yeuh and colleagues (2010) report that when 651 US Veterans were screened for hearing loss, only 182 complied with the recommendation to seek hearing aids as a treatment. Of the 182, only 77 Veterans adopted hearing aids and professional that are provided at no cost, resulting in a demand of 42% (i.e., [77/182] x 100). In the private sector, the US demand function for hearing aids is slightly lower than countries (or programs) offering fully or partially subsidized hearing care. Recent industry reports indicate hearing aid adoption rates ranging between 30% (Abrams & Kihm, 2015) and 38% (Picou, 2022).
There are two key points with respect to the inelastic demand function:
- While the issue of price is a consideration for consumers during the purchasing process, it is not the primary consideration as evidenced by the low adoption rates in countries with fully subsidized hearing healthcare. Thus, factors other than price act as a challenge to adoption.
- For the market to reach its potential in meeting the needs of consumers with hearing loss, it must improve its inelastic demand function. Stated differently, this means shifting the estimated demand function from |0.49|to, say, |0.60|.
6. Price is not the primary consideration for the consumer, but how does pricing affect the provider?
I serve as Section Editor of Hearing Economics for Hearing Health & Technology Matters (HHTM). Every 3-4 years, I publish a multi-part, pricing analysis(es) of retail and wholesale segments with data provided by the hearing aid manufacturers. For the most recent analyses, the reader is referred to Amlani (2021).
Figure 2—taken from the 2021 analysis—reveals that the average retail cost for a single-unit device (and bundled professional services) was $1785 in 2004. That same device and associated service provision, unadjusted for inflation, reportedly retailed for $2284 in 2019. When inflation (i.e., CPI) is applied to the 2004 retail price (i.e., $1785), that same device, in 2019, would retail for $2418. Thus, long-term hearing aid retail prices continue to grow at a rate less than inflation, a continued validation of my earlier work with Dr. Goldstein. As seen in Figure 2, the average retail price in the market was notably higher than the inflation-adjusted average retail price between 2009 and 2016.
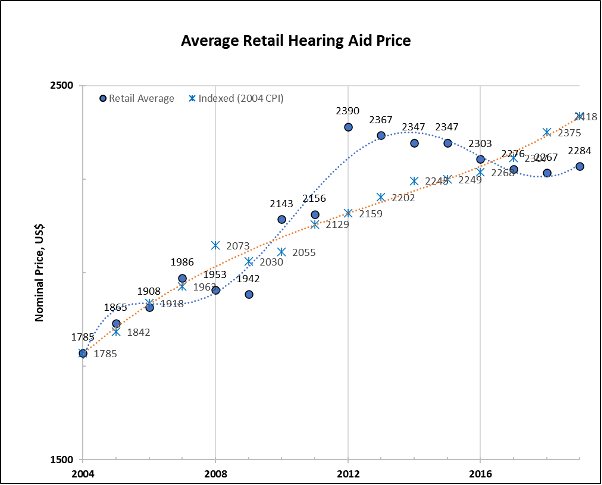
Figure 2. Comparison between unadjusted, average, single-unit retail hearing aid prices (blue filled circles), in US dollars, and a 2004 average-priced, single unit retail hearing aid adjusted for inflation (blue asterisks) as reported in Amlani (2021).
Figure 3 is where we observe the influence of price to the provider. In this figure, gross profit is calculated in terms of markup ratio (the bundled retail price [ product + professional services] divided by wholesale price [i.e., product only]). Overall, the average markup ratio on hearing aids and associated services decreased from nearly 4x (i.e., retail price is nearly four times wholesale price) to just under 3x (i.e., retail price is nearly three times wholesale price) between 2004 and 2019, despite the positively sloping increase in the average retail price between 2004 and 2019. This finding indicates a trend where “product only” prices are increasing at a faster rate than “product + professional service” prices.
To illustrate this trend, consider that the reported average retail price for a hearing aid in 2004 was $1785 and the reported average wholesale invoice was $457. Together, this results in a markup ratio of 3.91 (i.e., $1785/$457). In comparison, data reported for 2019 suggested an average price for a hearing aid of $2284 and an average wholesale invoice of $774. The markup ratio for these data points is 2.95 (i.e., $2284/$774). Over this period, retail prices (product + service) increased by 128% (i.e., [$2284/$1785] x 100) while wholesale prices (i.e., product) increased by 169% (i.e., [$774/$457] x 100).
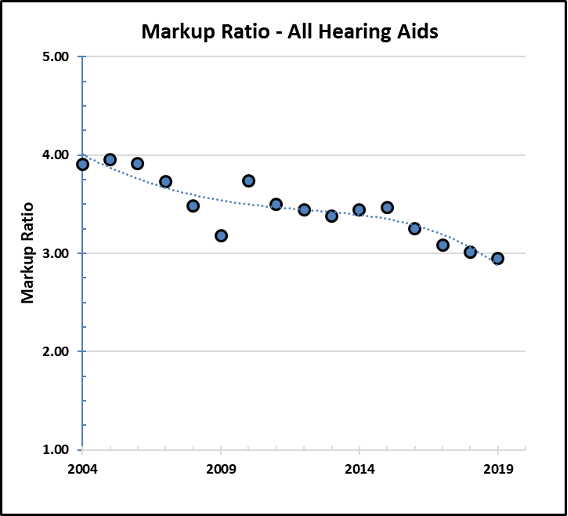
Figure 3. Markup ratio (i.e., retail price divided by wholesale price), over time, for all hearing aids (denoted by the blue circles) as reported in Amlani (2021).
The compression in markup ratio is industry wide and is promulgated by hearing aid manufacturers applying a market structure categorized as an oligopoly (Amlani & De Silva, 2005; Warren & Grassley, 2022). Examples of other US-based oligopoly markets include pharmaceuticals, the auto industry, and oil and gas. Operating under an oligopoly market structure is characterized by limited competition in which a small number of suppliers (i.e., Big 5) control the overwhelming majority of market share (i.e., ~90%, Warren & Grassley, 2022) through the production and distribution of similar products and services. In such a market structure, there is no market share leader, and every supplier influences the behavior of other firms.
Given this structure, one supplier’s (i.e., manufacturer) action towards pricing is reacted upon by the other competing suppliers. This market behavior was recently acknowledged by a CEO of a hearing aid manufacturing firm, as reported by Garner (2022), “Competition, by and large, has followed suit with [our] price announcements, [where] we collectively, uncoordinated as you’d expect from a compliance perspective, but one after another, increased prices.” A recent occurrence that exemplifies this ideology was the 3-5% increase providers were taxed in wholesale prices due to increases in supplier production and freight costs (MedWatch, 2022), first by a handful of suppliers, followed shortly by the remaining competitors.
7. Do we have data to allow us to estimate the prevalence to which hearing care is being provided for those needing hearing aid intervention?
Great question. Let’s use an epidemiologic estimate to answer this. Mener and colleagues (2013) reported an estimated population of 21.4 million in 2000 for Americans ranging between 40 and 79 years that is expected to increase to 38.7 million by 2050 for this age range.
The demand function provides a predictive estimate of individuals within the population at a given time who seek a hearing intervention. Returning to our earlier example where I indicated an inelastic demand function of |0.49| indicates that only 49 individuals—out of a possible 100 individuals—are willing to adopt amplification technology.
When the demand function of |0.49| is applied to the epidemiologic estimate in the year 2000 (i.e., 21.4 million), the math indicates that 10.49 million (i.e., 21.4 million x 0.49) Americans were potential hearing aid candidates. Had the demand function increased to |0.60|, the estimated number of potential Americans seeking hearing aid would have increased to 12.84 million (i.e., 21.4 million x 0.60).
While increasing the demand function does lead to an increase in the number of people in need of hearing aids as an intervention to overcome hearing loss, the primary issue facing the market is one of supply. As we determined earlier, there are an estimated 10.49 Americans ready to be served. The number of hearing aids dispensed in 2000—taken from HIA data provided to Amlani & De Silva (2005)—was 1.93 million. This means that 18.4% of Americans did receive hearing aids as a treatment option, while 81.6%, or an estimated 8.56 million Americans did not receive a treatment intervention.
(Note: The percentage estimates provided here overestimate the “real” value because the unit number of hearing aids sold represents all device sold across age, while the population estimates used in the calculation are stratified to an age group between 40 and 79 years. To my knowledge, determining “real” percentage values for this stratified age group is not attainable as HIA does not report hearing aid adoption rates as a function of age.)
8. What factors are impacting the market from supplying products and services?
There are several contributors to supplying hearing healthcare, two of which, I believe, are important to patient readiness and accessibility.
With respect to the consumer’s self-perceived readiness:
- Research indicates that individuals with hearing loss who do not expect to benefit from hearing aids will not seek treatment intervention (Saunders et al, 2009).
- Conversely, individuals with elevated expectations towards treatment are more willing to try hearing aids, but will discontinue use when the devices fail to deliver their predisposed level of satisfaction.
- There is also the issue of an individual’s willingness to try hearing aids with the positive expectation that the devices will help overcome their communication difficulties, but then doubt their ability to use and maintain the device. This uncertainty can be lessened through counseling efforts provided by the hearing care professional. Scientific inquiries, however, reveal that audiologists lack in their responsibility towards providing patient-centered care with respect to validating consumer concerns (Coleman et al., 2018).
9. Can you expand on how patient-centered care relates to this?
Patient readiness is defined as the provision of care that is respectful of and responsive to the preferences, needs, and values of an individual, and that these attributes are used to guide clinical decisions (Institute of Medicine, 2001).
Recently, first-time consumer’s expectations towards receiving a hearing evaluation were determined before and after an in-person clinical interaction with their provider (Amlani, 2020). Findings revealed that consumers’ predisposed expectations towards their hearing health were unmet in several dimensions (e.g., trust, empathy, shared decision-making, communication). While information during this research undertaking was not collected during the in-person appointment, supporting research indicates that providers are:
- Not building a relationship their patients (e.g., Grenness et al, 2015),
- Not promoting an equal opportunity for patients to participate actively in their own treatment and management of their hearing impairment (e.g., Coleman, 2018),
- Lacking empathy when patients present psychosocial concerns expressed with a negative emotional stance (e.g., Ekberg et al, 2014; Coleman, 2018),
- Overlooking family member input as part of the treatment and management process (e.g., Ekberg et al, 2015),
- Neglecting to acknowledge consumers’ emotional responses during the decision-making process with respect to hearing aid cost options (e.g., Ekberg et al, 2017; Coleman, 2018).
In addition, the use of terms —such as mild and hearing loss—are increasingly likely to result in denial of sensory impairment rather than compliance and acceptance towards an intervention (Alcock, 2014). The denial stems from the individual’s default perception that their sensory perception is performing as expected—especially given that decreases in hearing sensitivity are often gradual and occur over time—and from the provider’ failure to offer sufficient evidence that shifts the currently held perception to one requiring a treatment intervention.
With respect to counseling towards product features, I reported that the adoption of hearing aids increased when consumers were advised on the evidence-based benefits of the technology and how that technology overcame their individual listening difficulties (e.g., automatically adjusts volume, offers a microphone solution to improve hearing ability in a noisy environment) compared to simply discussing the availability of features using technical language (e.g., wide-dynamic range compression, channels, adaptive directionality) (Amlani, 2013).
The overall importance of supplying patient-centered hearing care increases not only the likelihood of adoption of services and technology (i.e., demand), but also the consumer’s willingness to pay, and, perhaps most importantly, their satisfaction and loyalty to the provider (Amlani et al, 2016).
10. You mentioned accessibility as a second factor?
I did. Let us look at current consumer access to hearing health services. Medicare is a government program designed to help elderly Americans cover the cost of healthcare and access. Currently, Medicare beneficiaries who seek audiological diagnostic services must be referred by their primary care physician once medical necessity has been established. Furthermore, the current Medicare program permits audiologists to provide hearing and balance assessments as “audiology services,” but provides no subsidized provisions to pay audiologists to perform treatment/follow-up services (e.g., cerumen removal, auditory rehabilitation, real-ear testing) nor hearing aids.
An economic analysis by Planey (2019) revealed that these Medicare statutes influence the audiologist’s decision towards (i) where they locate (i.e., predominately urban areas with higher household incomes), and (ii) the type of consumer they service (i.e., primarily consumer that pay out-of-pocket for treatment/follow-up services). The result is a geographical disparity for rural residents in receiving regular hearing assessments and adoption of hearing aids. In addition, older Americans who reside in rural areas report an increased preponderance towards hearing difficulties and poorer overall health status compared to their urban peers (Hay-McCutcheon et al, 2021; National Rural Health Association [NHRA], 2022). For those rural residents who elect in-person care, they must travel farther distances or experience increased travel time to access the same provider as their urban peers (Hay-McCutcheon et al, 2021). Lastly, older adults who reside in rural areas further face limited direct access to primary care physicians (NHRA, 2022).
These geographical disparity issues were part of the deliberations for the over-the-counter (OTC) hearing aid regulations (e.g., National Academies of Sciences, Engineering, and Medicine [NASEM], 2016) and has been point of inclusion in recently proposed Medicare reform legislation (e.g., S. 4204, 2022 – Medicare for All Act of 2022).
11. Are there additional accessibility issues?
Yes…we have an inequity in professional diversity on both sides of the aisle. On the consumer side, Hispanic and Black Americans have a higher prevalence of hearing loss than their White counterparts (Goman & Lin, 2016), but are less likely to access treatment to lessen their hearing difficulties. Bainbridge and Ramachandran (2014), for instance, investigated racial and socioeconomic differences related to hearing aid use between White and Hispanic Americans. These authors found that hearing aid use was two-times greater among Whites than Hispanics. More recently, Reed and colleagues (2020) examined hearing aid ownership cross-sectional trends over an 8-year period (i.e., 2011-2018) among Whites and Blacks. Findings revealed that hearing aid adoption increased by 4.3% for White Americans while hearing aid adoption increased only 0.8% for Black Americans during this period. Nieman et al (2016) suggest that lower income and lack of insurance coverage for Hispanic and Black Americans were strong predictors towards non-hearing-aid adoption and use.
On the provider side, lack of treatment uptake by minorities is influenced, in part, by professional workforce diversity. A study conducted by the US Government Accountability Office (2021) found that diversity in healthcare workforce is important—consumers are more apt to receive care from members of their own racial and ethnic backgrounds. According to the recent US Census (Jones et al, 2020), racial minorities represent 27.6% of the population, with 18.7% identifying as Hispanic or Latino, 12.4% identifying as Black or African American, and 6.0% identifying as Asian. According to the most recent professional demographics survey reported by ASHA (2021), the US audiology workforce constitutes only 8% racial minorities, with 3.3% identifying as Hispanic or Latino, 2.5% identifying as Black or African American, and 3.7% identifying as Asian. In addition, only 6% of audiologists meet the definition of a bilingual service provider.
12. Can the issue of accessibility be addressed through telehealth?
Telehealth certainly provides consumers and providers with an alternative means by which to access and deliver hearing care, respectively. Options for telehealth utilization include (i) consulting with a provider via video chat or phone, (ii) sending and receiving messages, (iii) remote testing and monitoring of health outcomes, and (iv) ability to adjust and troubleshot treatment technology remotely.
For consumers to utilize telehealth, a requirement is broadband Internet. In the US, the federal minimum for broadband connectivity is 25 MPS for downloads and 3 MPS for uploads (Federal Communications Commission, 2020). With respect to accessibility, the Pew Research Institute (2021) indicates that broadband Internet utilization is dependent on household income and race. Specifically, high income households utilize broadband 100%, compared to 91% for middle income households, and 86% for low-income households. With respect to race, 80% of Whites have access to broadband Internet, compared to 71% for Blacks, and 65% for Hispanics. Finally, rural areas have less access to broadband connectivity than urban areas.
Turning to smartphone as an application tool, data >95% ownership in the age groups up to 49 years, and only 83% and 61%, respectively, in the age groups 50-64 years and 65+ years. In addition, smartphone ownership is influenced by annual household income, where consumers earning >$75,000 reported 96%, compared to 83% and 76%, respectively, for the annual incomes between $30,000 and $74,999, and <$30,000. No differences were reported in smartphone ownership among races.
To complicate matters, professional adoption and application of telehealth is not widespread. Eikelbloom and Swanepoel (2016) found that 1 in 4 audiologists, internationally, reported utilizing telehealth services as part of clinical service delivery prior to the global pandemic. More recently, Perez Velez (2020), using the Connected Audiology REadiness (CARE) framework, surveyed audiologists’ readiness to utilize remote care as a service delivery option in improving consumer accessibility. Results showed that only 44% of audiologists routinely employed telehealth services and 23% reported using remote care for hearing aid fittings. Survey results further revealed that provider utilization is constrained because >80% of respondents indicated that they lacked professional development in key areas (e.g., knowledge, skills, utilization, insurance requirements, reimbursement for services) required to implement this clinical service as part of a standard of care.
Lastly, coverage and payment of telehealth services varies across federal, state, and commercial payors. For Medicare beneficiaries, authority to provide telehealth service provision was approved temporarily as part of the Coronavirus Disease 2019 (COVID-19) Federal Public Health Emergency (PHE). This PHE has been in place since January 2020 and is reevaluated for renewal every 90 days by the US Department of Health and Human Services (HHS). On February 3, 2023, it was announced that the PHE would be eliminated on May 11, 2023 (Warren & Swanson, 2023). For audiology, this means that Medicare will cease reimbursement for telehealth services on January 1, 2025.
13. Is there a solution to the problem of accessibility?
Absolutely! The Medicare Audiologist Access and Services Act (S. 1731, 2022) is proposed legislation—supported by three leading national professional organizations (AAA, ADA, and ASHA)—that improves accessibility to hearing health services by (i) allowing consumers to have direct access to an audiologist by eliminating the requirement for a physician order for coverage, (ii) reclassifying audiology’s status from “supplier” to “practitioner,” and (iii) enabling audiologists to be reimbursed under the Medicare fee schedule for the Medicare-covered services that they are licensed to provide, including treatment/follow-up services (e.g., cerumen removal, auditory rehabilitation, real-ear testing).
The Medicare legislation does not (i) expand professional scope of practice, (ii) include new Medicare services, nor (iii) provide subsidized or reimbursement for hearing aid technology.
The reclassification of audiology to practitioner status is particularly important to audiology’s future in that audiologists will be able to be more efficiently deployed within the Medicare system, and Medicare will recognize audiology as consistently with other similarly trained non-physician providers (e.g., physicians assistants, registered nurses, nurse practitioners). In addition, the reclassification to practitioner status permits audiologists to furnish services through telehealth permanently.
14. From the provider side, I assume that audiology has the workforce to provide these services.
Over the past 4-5 years, Victor Bray, PhD, Associate Professor and former Dean at Salus University Osborne College of Audiology, and I have collaborated on analyzing various aspects of the profession of audiology. One area of evaluation has been whether the profession can sufficiently supply hearing care to meet the needs of the aging population relative to other healthcare professions.
Our analysis(es) uses the Bureau of Labor Statistics (BLS) database on Occupational Employment and Wage Statistics (OEWS). This database provides historical employment (i.e., workforce) data for audiology, dating back to 1999, the inaugural year that the profession was provided its own occupational code.
In 2021, Bray and Amlani analyzed the growth in workforce employment for 19 healthcare professions between 1999 and 2019, as shown in Figure 4 below. The y-axis represents the percentage change in employment growth over this period, depicted by the blue bars. Percentage growth was determined as the difference between the reference year (1999) and the most recent year (2019). The z-axis represents the nominal size of the occupational workforce and data are plotted as black diamonds in the figure captures. In the figure, Audiology is signified by the orange bar (third from the left, BLS Code 29-1181). The main findings from this undertaking were:
The three occupations with the highest growth rates were:
- Orthotists and Prosthetists at 195% (BLS Code 29-2091),
- Chiropractic at 203% (BLS Code 29-1011), and
- Dental Hygienists at 146% (BLS Code 29-1292).
The two occupations with the lowest growth rates were:
- Audiology at 5% (BLS Code 29-1181), and
- Recreational Therapists at negative 37% (BLS Code 29-1125).
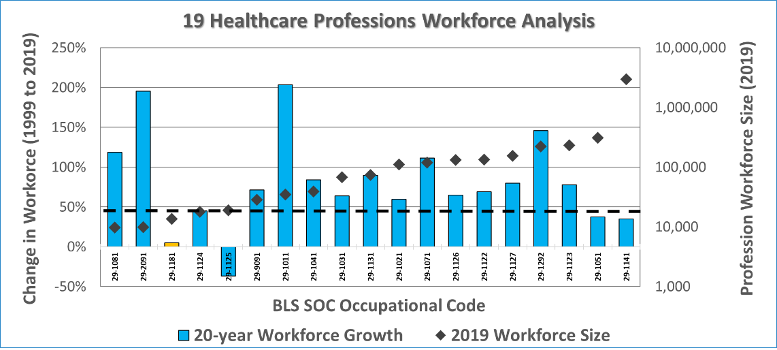
Figure 4. Workforce analysis for nineteen healthcare occupations comparing workforce growth between 1999 and 2019 as reported by Bray & Amlani (2021).
15. Did you say that the profession of Audiology, over a 20-year span, only grew by 5%?
Yes, based on the analysis that was performed. Recently, Dr. Bray and I re-examined our earlier outcome and concluded that the growth is influenced by an aberration in the data (Bray & Amlani, 2022). In Figure 5 below, note the negative growth in nominal workforce—shown on the y-axis—between 1999 and 2004. During this period, there is a 24% decline in workforce (i.e., 12,950 audiologists in 1999 decreasing to 9,810 audiologists in 2004). We believe this decline stems from the profession’s transition from the Master’s degree to the Doctoral/Professional degree requirement.
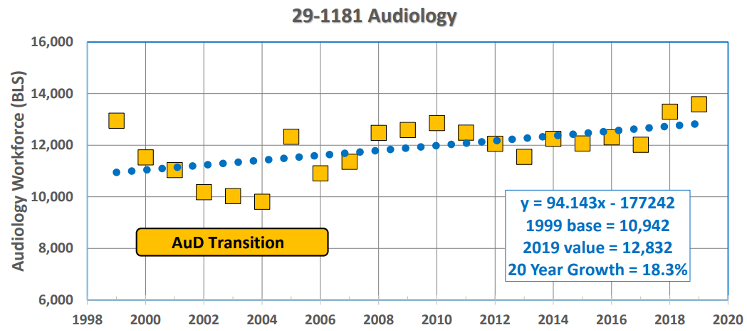
Figure 5. Change in Audiology occupational workforce between 1999 and 2019 as reported by Bray & Amlani (2021).
When we re-analyzed this dataset using differing time periods and more robust statistical model, we found substantial differences to the workforce outcomes (Bray and Amlani, 2022). These differences are displayed below in Figure 6.
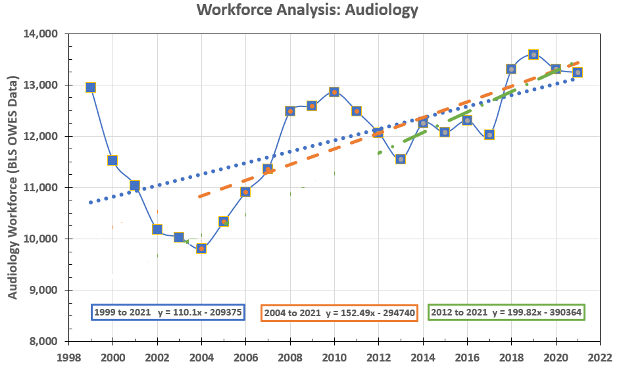
Figure 6. Updated change in Audiology occupational workforce between 1999 and 2019 as reported in Bray & Amlani (2022).
Using regression analysis, we found that between:
- 1999-2021 (i.e., 22 years, denoted by the blue-dotted line), the workforce yielded a net growth of 110.1 audiologists per year.
- 2004-2021 (i.e., 17 years, denoted by the dashed orange line), the workforce yielded a net growth of 152.5 audiologists per year.
- 2012-2021 (i.e., 10 years, denoted by the dash-dot green line), the workforce yielded a net growth of 199.8 audiologists per year.
We recently concluded that the analysis spanning the past decade (i.e., 2012-2021) best represented the current workforce environment, one that is growing at an estimated rate of 200 audiologists per year.
16. If the workforce growth is yielding only 200 audiologists annually, how is the profession meeting the needs of the aging population?
The answer is that the profession of audiology does not have the supply capacity to meet the demands of the aging population. So, who is filling the workforce void in hearing care?
Let us start by assuming a best-case scenario premised on two hypotheticals reported by Bray and Amlani (2022):
- “What if” the audiology workforce had not lost roughly 3000 professionals between 1999 and 2004, and
- “What if” audiology grew at the workforce rate of 72%, which is the average growth rate of similar professions such as occupational therapy, physical therapy, speech-language pathology, and optometry.
When these factors are applied to the 1999 workforce baseline of 12,950 audiologists, the profession’s optimal workforce is predicted at slightly more than 22,000.
To answer the “who,” we access the BLS OEWS database, where we find that Hearing Aid Specialist (HAS) was included in the database starting in 2012. In 2012, HAS had an estimated workforce of 4,980. In 2021, the predicted HAS workforce has grown to nearly 11,000. When the HAS workforce is added to the audiology workforce-as shown in Figure 7—the aggregate number of professionals in the hearing care segment equates to a combined workforce of roughly 25,000.
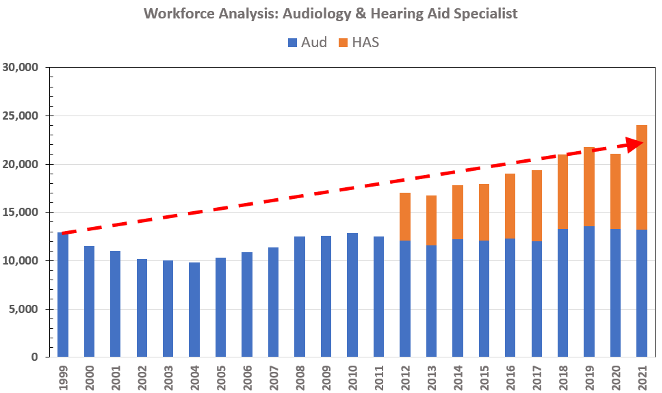
Figure 7. Predicting hearing healthcare workforce that was expected in 2021 (re: 1999, depicted as red dashed line), and workforce estimates of Audiology (i.e., blue bars) and Hearing Aid Specialist (i.e., orange bars) as reported in Bray & Amlani (2022).
17. Interesting. What is your take on the sizable growth of HAS compared to audiology?
With their growth and, in some states, expanded scope of practice, HAS is narrowing the gap on providing hearing aid services compared to audiology. Consider, for instance that HAS scope of practice includes (i) the dispensing of hearing aids, (ii) services and treatment related to tinnitus, (iii) management of comorbidities (for example, falls) via healthable technologies, and (iv) screening for comorbidities related to untreated hearing loss (e.g., cognitive screenings).
With this in mind, we constructed Figure 8 that predicts the trajectory in workforce between the professions using the workforce growth estimates I described earlier. In the figure, HAS is represented by the dashed blue line and audiology is represented by the solid orange line. Note that sometime in the next decade, between 2030 and 2035, the HAS workforce is expected to exceed the audiology workforce (Bray & Amlani, 2022).
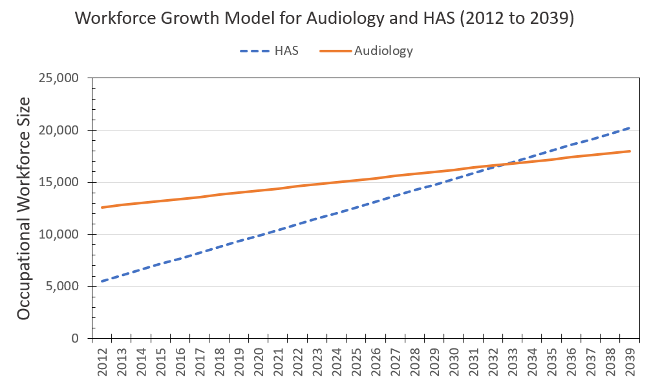
Figure 8. Predict future impact of the current Hearing Aid Specialist (HAS) workforce growth rate compared to that of the Audiology (AuD) workforce growth as reported in Bray & Amlani (2022).
18. To what degree is HAS contributing to the needs of the population of individuals with hearing loss?
The degree that HAS contributes to the needs of the population is unknown, but epidemiologic estimates allow for a qualitative inference. If you recall my answer to your 7th question, I mentioned that in 2000, roughly 18.4% of Americans were receiving hearing aids as a treatment intervention. In comparison to 2019 (pre-COVID), there are an estimated at 28 million individuals with hearing loss ranging in age between 40 and 79 years (Goman & Lin, 2016), it is assumed that the demand function remains at |0.49|, and HIA reports 4.32 million hearing aid units were dispensed (Strom, 2020). The math suggests that 31.5% of Americans, in 2019, received hearing-related rehabilitative care (i.e., 4.32 million/[28 million x 0.49]). This results in a comparative increase in supply of 13.1% (i.e., 31.5% - 18.4%) over time. Given the stagnated growth in the audiology workforce described earlier, market growth—as quantified by hearing aid provision—is supplied by HAS professionals.
19. We haven’t touched on the new OTC regulations. Any thoughts on its economic impact?
The enactment of the OTC Hearing Aid Act of 2017 is good for the market and the profession. The OTC Hearing Aid Act—which is principled on President Biden’s Executive Order on Promoting Competition in the America Economy (2021)—should encourage new suppliers to enter the market, increasing competition and lessening the impact of the current oligopoly structure on pricing, vertical integration, and impact of manufacturer-sponsored third-party plans. In addition, the strict electroacoustic standards for product entry to the market (i.e., ANSI/CTA, 2017) ensures that OTC product quality will be on par with products available in the prescription (i.e., traditional) category.
For the profession, it is too early to understand consumer purchasing behavior trends, service delivery/acquisition preferences, adoption rates, and price sensitivity. What is becoming known is that:
- Surveys of respondents aged > 50 years show a sizable percentage of individuals prefer professional support services to accompany their direct-to-consumer (DTC) product purchase (Picou, 2022, Singh & Dhar, 2023). This finding validates the significant role the provider plays in rehabilitating hearing loss and serving an intervention role on the patient journey to an improved quality of life (QoL), and
- OTC hearing aids are expected to appeal primarily to a younger demographic who experience a milder hearing loss. This younger demographic has also shown to be increasingly comfortable with self-directed care and use of technology compared to the typical older, prescription hearing aid user (Keidser & Convery, 2018). This expected trend serves as an opportunity for the market to improve the demand function from |0.49| to |0.60|, without mounting additional pressure to the supply issues faced with professional workforce and accessibility.
20. Any final thoughts or considerations on what the profession should consider to enhance its economic viability?
Below is a quote from one of our recent publications that, I believe, should be at the heart of all discussions regarding audiology’s professional economic viability (Bray & Amlani, 2022):
“The primary role of audiology is to assess hearing status, diagnose auditory and balance system disorders, and provide treatment to patients with hearing and vestibular problems. The objective of audiological care is to provide professional services—augmented by advancements in technology offerings—that are accessible and meet the demands of consumers in improving their quality of life (QoL). The responsibility of the profession, then, is to make certain it generates a dynamic, balanced, and viable supply of professionals (i.e., workforce) that can service the hearing healthcare needs of its population.”
If we, as a profession, look in the mirror and are honest with our current assessment in meeting the needs of the consumer, including the profession’s responsibility to generate a viable supply of professionals, we will find that audiology is not. As we’ve discussed, the profession is lacking in its abilities to meet consumer demand, provide accessibility care, and provide support through a sufficient workforce supply. Other factors that deserve discussion include on the provider side (e.g., designation to practitioner status, academic training model and accreditation standards, state licensure/scope of practice) and on the manufacturing side (i.e., oligopoly characteristics related to pricing, distribution, and competition), and the interaction between these supplier groups.
I am optimistic that, in the very near future, the profession will critically evaluate and act strategically in a unified and organized manner to restore our viability and sustainability within the larger healthcare ecosystem, and work diligently to reaffirm and expand our perceived scope of practice from relying on hearing aid sales to a medical model of professional services (e.g., co-managing hearing loss and co-morbidities), especially the academic training model. Delaying these discussions and failing to act primarily impacts the livelihood of the provider (i.e., audiologist), leading to a decrease in future economic viability and sustainability of this doctoring profession. The impact of delayed discussions is not necessarily detrimental to the product development side of manufacturing, as that segment will seek out other healthcare providers and delivery models to service the ever-growing population of consumers.
Lastly, the data and commentary that I’ve presented should not be viewed pessimistically or as a criticism of the profession. Rather, it is hoped that the collective systems analyses provided help to identify opportunities for audiology to develop and flourish, and that the information provided helps audiologists practice at the top of their scope of license in their mission to improve the QoL for individuals with hearing and balance issues.
References
Abrams, H. B., & Kihm, J. (2015). An introduction to MarkeTrak IX: A new baseline for the hearing aid market. Hearing Review, 22(6), 16.
Alcock, C. (2014). Trigger happy hearing: Using social triggers to promote regular hearing checks. Audiology Practices, 6(2), 8-15.
American National Standards Institute/Consumer Technology Association. (2017). Personal sound amplification performance criteria. https://webstore.ansi.org/standards/ansi/cta20512017ansi+&cd=&hl=en&ct=clnk&gl=us
Amlani, A. M. (2010). Will federal subsidies increase the US hearing aid market penetration rate? Audiology Today, 22(2), 40-46.
Amlani, A. M. (2020). Influence of provider interaction on patient’s readiness towards audiological services and technology. Journal of the American Academy of Audiology, 31(5), 342-353.
Amlani, A. M. (2021). An analysis of US hearing aid pricing: Insights and commentary for the practice manager. Audiology Practices, 13(2), 10-23.
Amlani, A. M., & De Silva, D. G. (2005). Effect of economy and FDA intervention on the hearing aid industry. American Journal of Audiology, 14(1), 71-79.
Amlani, A. M., & Goldstein, D. P. (1995). Hearing instruments are a better value with every passing year. Hearing Review, 48(11):41-42.
Amlani, A. M., Pumford, J., & Gessling, E. (2016). Improving patient satisfaction and loyalty through real-ear measurements. The Hearing Review, 23(12), 12-16, 18, 20-21.
American Speech-Language-Hearing Association. (2021). 2021 member & affiliate profile: Annual demographic and employment data. https://www.asha.org/siteassets/surveys/2021-member-affiliate-profile.pdf.
Bainbridge, K. E., & Ramachandran, V. (2014). Hearing aid use among older US adults. The National Health and Nutrition Examination Survey, 2005-2006 and 2009-2010. Ear & Hearing, 35(3), 289-294.
Biden, J. R. (2021, July 9). Executive Order on Promoting Competition in the America Economy. White House. https://www.whitehouse.gov/briefing-room/presidential-actions/2021/07/09/executive-order-on-promoting-competition-in-the-american-economy/
Bray, V., & Amlani, A. M. (2021). Historical trends in US Audiology workforce benchmarked to other healthcare professions. American Academy of Audiology Virtual Meeting, April 14-16.
Bray, V., & Amlani, A. M. (2022). A new analysis of the audiology workforce, benchmarked to other healthcare professions. Audiology Practices, 14(4), 42-51.
Coleman, C. K., Muñoz, K., Ong, C. W., Butcher, G. M., Nelson, L., & Twohig, M. (2018). Opportunities for audiologists to use patient-centered communication during hearing device monitoring encounters. Seminars in Hearing, 39(1), 32-43.
Eikelbloom, R. H., & Swanepoel, D. (2016). International survey of audiologists; attitudes towards telehealth. American Journal of Audiology, 25(3S), 295-298.
Ekberg, K., Grenness, C., & Hickson, L. (2014). Addressing patients’ psychosocial concerns regarding hearing aids within audiology appointments for older adults. American Journal of Audiology, 23(3), 337-350.
Ekberg, K., Meyer, C., Scarinci, N., Grenness, C., & Hickson, L. (2015). Family member involvement in audiology appointments with older people with hearing impairment. International Journal of Audiology, 54(2), 70-76.
Ekberg, K., Barr, C., & Hickson, L. (2017). Difficult conversations: Talking about cost in audiology consultations with older adults. International Journal of Audiology, 56(11), 854-861.
Federal Communications Commission. (2020, April 24). 2020 Broadband Deployment Report. FCC 20-50. https://www.fcc.gov/reports-research/reports/broadband-progress-reports/2020-broadband-deployment-report.
Garner, E. (2022, August 30). Biden targets hearing aid cartel, stock prices plummet. https://perfectunion.us/hearing-aid-stocks-plummet-as-biden-introduces-competition/
Goman, A. M., & Lin, F. R. (2016). Prevalence of hearing loss by severity in the United States. American Journal of Public Health, 106(10), 1820-1822.
Grenness, C., Hickson, L., Laplante-Lévesque, A., Meyer, C., & Davidson, B. (2015). The nature of communication throughout diagnosis and management planning in initial audiologic rehabilitation consultations. Journal of the American Academy of Audiology, 26(1), 36-50.
Hay-McCutcheon, M. J., Yuk, M. C., & Yang, X. (2021). Accessibility to hearing healthcare in rural and urban populations of Alabama: Perspectives and a preliminary roadmap for addressing inequalities. Journal of Community Health, 46(4), 719-727.
Institute of Medicine (US) Committee on Quality of Health Care in America. (2001). Crossing the quality chasm: A new health system for the 21st century. National Academy Press.
Jones, N., Marks, R., Ramirez, R., & Ríos-Vargas, M. (2020). Improved race and ethnicity measures reveal US population is much more multiracial: 2020 Census illuminates racial and ethnic composition of the country. United States Census Bureau. https://www.census.gov/library/stories/2021/08/improved-race-ethnicity-measures-reveal-united-states-population-much-more-multiracial.html#:~:text=The White and Black or,people, a 230% change.
Keidser, G., & Convery, E. (2018). Outcomes with a self-fitting hearing aid. Trends in Amplification, 22, 1-12.
Kochkin, S. (1992). MarkeTrak III identifies key factors in determining consumer satisfaction. The Hearing Journal, 45(8), 39-44.
Medwatch. (2022, August 19). GN Hearing, Sonova raise prices. https://medwatch.com/News/hearing_health/article14324803.ece
Mener, D. J., Betz, J., Genther, D. J., Chen, D., & Lin, F. R. (2013). Hearing loss and depression in older adults. Journal of the American Geriatric Society, 61(9), 1627-1629.
National Academies of Sciences, Engineering, and Medicine. (2016). Hearing health care for adults. https://nap.nationalacademies.org/catalog/23446/hearing-health-care-for-adults-priorities-for-improving-access-and
National Rural Health Association. (2022). About rural health care. https://www.ruralhealth.us/about-nrha/about-rural-health-care.
Nieman, C. L., Marrone, N., Szanton, S. L., Thorpe, R. J., Jr, & Lin, F. R. (2016). Racial/ethnic and socioeconomic disparities in hearing health care among older Americans. Journal of Aging Health, 28(1), 68-94.
Perez Velez, L. N. (2020). An exploration of audiologists' readiness to adopt connected hearing healthcare for remote hearing aid fitting. Electronic Thesis and Dissertation Repository, 7459. https://ir.lib.uwo.ca/etd/7459
Pew Research Center. (2021, April 7). Internet/broadband fact sheet. https://www.pewresearch.org/Internet/fact-sheet/Internet-broadband/?menuItem=6b886b10-55ec-44bc-b5a4-740f5366a404#Internet-use-over-time.
Picou, E. M. Hearing aid benefit and satisfaction results from the MarkeTrak 2022 survey: Implications of features and hearing care professionals. Seminars in Hearing, 43, 301-316.
Planey, A. M. (2019). Audiologist availability and supply in the United States: A multi-scale spatial and political economic analysis. Social Science & Medicine, 222, 216-224.
Reed, N. S., Garcia-Morales, E., & Willink, A. (2020). Trends in hearing aid ownership among older adults in the United States from 2011 to 2018. JAMA Internal Medicine, 181(3), 383-385.
S. 1731 – 117th Congress (2021-2022). Medicare Audiologist Access and Services Act of 2021. May 20, 2021. https://www.congress.gov/bill/117th-congress/senate-bill/1731
S. 4202 – 117th Congress (2021-2022). Medicare for All Act of 2022. May 12, 2022. https://www.congress.gov/bill/117th-congress/senate-bill/4204/text
Saunders, G. H., Lewis, M. S., & Forsline, A. (2009). Expectations, prefitting counseling, and hearing aid outcome. Journal of the American Academy of Audiology, 20, 320-334.
Singh, J., & Dhar, S. (2023, January 19). Assessment of consumer attitudes following recent changes in the US gearing healthcare market. JAMA Otolaryngology Head & Neck Surgery, 149(3), 247–252.
Strom, K. (2020). Hearing aid sales increase by 6.5% in 2019. Hearing Review. https://hearingreview.com/inside-hearing/industry-news/hearing-aid-unit-sales-increased-by-6-5-in-2019#:~:text=Hearing aid unit sales in,Industries Association, Washington, DC.
US Government Accountability Office. (2021, September). Healthcare capsule: Racial and ethnic disparities. https://www.gao.gov/assets/gao-21-105354.pdf
Warren, E., & Grassley, C. E. (2022, June 30). Loud and clear: Why Americans want effective and affordable over-the-counter hearing aids – and how powerful interests are trying to undermine. https://www.warren.senate.gov/imo/media/doc/FDA Hearing Aid Report.pdf
Warren, S., & Swanson, N. (2023, February 3). The end of the Public Health Emergency: What it means to telepractice, Medicaid, and HIPAA. https://leader.pubs.asha.org/do/10.1044/2023-0203-phe-end-slps-auds/full/
Yueh, B., Collins, M. P., Souza, P. E., Boyko, E. J., Loovis, C. F., Heagerty, P. J., Liu, C. F., & Hedrick, S. C. (2010). Long-term effectiveness of screening hearing loss: The Screening for Auditory Impairment—Which Hearing Assessment Test (SAI-WHAT) randomized trial. Journal of American Geriatric Society, 58, 427-434.
Citation
Amlani, A. M. (2023). 20Q: Audiology economics. AudiologyOnline, Article 28543. Available at www.audiologyonline.com

