
From the Desk of Gus Mueller
![]() Traditionally, swept pure tones have been the standard for evaluating hearing aid performance in the 2-cc coupler, on the KEMAR, and for other laboratory measures. When clinically-friendly probe-mic equipment was introduced in the early 1980s, this same input signal was adopted by most manufacturers. Once multichannel compression instruments became common and digital processing was introduced, it was clear that this long-time favorite signal had several limitations. We soon began to see new real speech and speech-like signals introduced and subsequently being used routinely for hearing aid assessment.
Traditionally, swept pure tones have been the standard for evaluating hearing aid performance in the 2-cc coupler, on the KEMAR, and for other laboratory measures. When clinically-friendly probe-mic equipment was introduced in the early 1980s, this same input signal was adopted by most manufacturers. Once multichannel compression instruments became common and digital processing was introduced, it was clear that this long-time favorite signal had several limitations. We soon began to see new real speech and speech-like signals introduced and subsequently being used routinely for hearing aid assessment.
Gus Mueller
Not too many years ago, however, if you were to conduct real-ear verification with probe-mic equipment from five different manufacturers, you possibly would be using five different speech or speech-like input signals. In case you’re thinking that this might make things a little confusing, you’re right. Particularly, if the signals and equipment that were used resulted in a different hearing aid fitting. A reasonable solution would be to have the same input signal available on all equipment, so that standard measures could be conducted from office to office, clinic to clinic, and even country to country.
That input signal arrived a few years ago, and it is called the International Speech Test Signal (ISTS). It is unique, in that it consists of the combined voices of six female talkers, speaking in different languages, shaped in agreement with the International Long-Term Average Speech Spectrum (ILTASS). But, there is a lot more to the signal and its use than that, so to tell us all about it, we have invited the lead researcher from the ISTS project to join us at 20Q this month.
Inga Holube, PhD, is a Professor for the Hearing Technology and Audiology study course at Jade University of Applied Sciences in Oldenburg, Germany. While her degree is in Physics, she has worked in the area of audiology and hearing aids for the past 25 years—her transition to the hearing aid arena was no doubt influenced by one of her early mentors, Prof. Dr. Dr. Birger Kollmeier.
Dr. Holube is a member of the German standardization committee for hearing instruments and audiometric equipment and the editorial board of the German Journal of Audiology (Zeitschrift für Audiologie). She has published extensively, articles and book chapters, on topics related to the design and fitting of hearing aids. Inga has received several honors, including an innovation award in 1997 for her work in developing the first digital hearing aid from Siemens—the PRISMA.
If you haven’t heard of the ISTS, pretty much everything you need to know is in this excellent article. If you haven’t worked with the ISTS, you probably will, as it seems logical that it will have increased use as the standard input for probe-mic measures. Curious minds wanted to know if our 20Q guest author was the German voice for the ISTS? She wasn’t, but the voice does come from German audiologist Monika Siepmann, so we do have professional representation!
Gus Mueller, PhD
Contributing Editor
February, 2015
To browse the complete collection of 20Q with Gus Mueller CEU articles, please visit www.audiologyonline.com/20Q
20Q: Getting to Know the ISTS
Inga Holube
1. I keep hearing about some test signal called “ISTS” and to be honest, I have no clue what it is or where it came from?
You are correct, this is a test signal, and it’s becoming increasingly common to use this signal to evaluate hearing aids in both the coupler and the real ear. ISTS is for International Speech Test Signal, an appropriate name as this signal is in use in many different countries.
2. Why did we need a new test signal?
There were several reasons. Let me give you a little history. I recall attending a meeting back in 2006 or so at the center of competence HörTech in Oldenburg, Germany. Nikolai Bisgaard from GN ReSound was there as a representative of the technical committee of the European Hearing Instrument Manufacturer Association (EHIMA; the name is somewhat misleading as the association also includes Starkey from the U.S.). The concern was that hearing instruments were beginning to be tested using speech signals, rather than the more traditional sinusoids or noises. It of course was a very reasonable approach that hearing instruments should be measured not only for quality assurance purposes, but also using an input that was more representative of real-life settings. Since hearing instruments differentiate between speech and noise and react differently to different input signals, the traditional noise signals and sinusoids could give misleading results. Unfortunately, and this was the primary concern, at the time of this meeting, different speech signals had been implemented in different measurement equipment and in different countries. These different signals resulted in different spectra and different temporal properties. This led to confusion among audiologists, as the performance of a hearing aid might vary as a function of the speech signal that was used for the testing. This then prompted calls to the manufacturers.
3. The EHIMA was working on a solution?
Yes. The EHIMA had formed a working group called ISMADHA for the purpose to develop an “international standard for measuring advanced digital hearing aids”. This standard would include a set of representative audiograms (Bisgaard, Vlaming, & Dahlquist, 2010), a short-time analysis procedure called “percentile analysis”, and a standard speech test signal. This standard was then eventually approved in 2012 as IEC 60118-15 and as ANSI S3.42-Part 2.
4. So your group was charged with developing the speech test signal for this standard?
Correct. Our task was to develop the speech test signal which should offer all properties of natural speech to allow the measurement of hearing instruments in their typically used settings, without the need to deactivate adaptive algorithms during the measure. While the task was indeed to develop a “speech signal”, we believed that the signal should be non-intelligible. That is, it should not contain only one single language, in order to be internationally applicable.
An alternative would have been to use only one totally unknown language or dialect, but the decision was made to use a combination of six different languages. We selected four of the most spoken languages, American-English, Arabic, Mandarin, and Spanish as well as French and German. Another major requirement was that the signal should be composed of female speech because its properties are in the middle between male and children’s speech. Our publication on the ISTS (Holube, Fredelake, Vlaming, & Kollmeier, 2010) gives a long list of further requirements which focus mainly on the temporal and spectral features.
5. Six different languages? That must have been quite a task.
It was, but we think it was worth the effort. We first recorded 21 female speakers while reading the story of “The North Wind and the Sun” in their mother tongue. This passage is known for its phonetic description of languages, and the texts are available from the International Phonetic Association (IPA). For each of the required six languages, for the final ISTS one speaker from the pool of 21 was selected based on the dialect, the voice quality and the fundamental frequency. The goal was that the ISTS should be as similar to one single speaker as possible. Therefore, we selected female speakers with a similar average fundamental frequency around 200 Hz. We limited the speech pauses to no more than 600 ms, to avoid variability in the measurement results. The recordings were filtered to match the international long term average speech spectrum (ILTASS) for females published by Byrne et al. (1994). These recordings are named “Original speech files of the ISTS and IFFM” and can be downloaded from the webpage www.ehima.com under documents. The abbreviation “IFFM” is for International Female Fluctuating Masker.
6. You’re starting to lose me. Before you tell me what you did with the IFFM recordings, could you explain the ILTASS you mention?
The “I” is for international, but here is a quick review of LTASS in general. The LTASS is the long-term average speech spectrum. The spectrum shows the level of each frequency region within the signal. The LTASS is calculated by filtering the speech in frequency bands with a width of one-third octaves. The averaged levels of the speech signal in all filters for durations of several seconds or minutes give this specific spectrum. Because of the filtering, the level in each one-third octave is lower than the broadband level. For example, when the broadband level of speech is 65 dB SPL, the LTASS is about 55 dB SPL in the lower frequency region and goes down to about 40 dB SPL at high frequencies (see Figure 1 below). This latter issue is often confusing to audiologists who are just beginning to use speech signals to evaluate hearing aids, as they expect that when a 65 dB SPL input is used, the input is really 65 dB SPL at all frequencies.
7. Is this spectrum the same for all speech signals?
No, certainly not. Different speech signals give different spectra dependent on the speaker and the recording conditions. Byrne et al. (1994) showed that the differences between languages are smaller than you would think when you average across several speakers and use the same recording equipment. This takes us back to the ILTASS term you asked about. Denis Byrne and colleagues calculated an average international LTASS, called ILTASS, for male and for female talkers. The main difference between male and female is in the low frequencies, because of the higher fundamental frequency of the female voice. Nevertheless, fitting formula and software displays might take other LTASSs into account, which might be based on a smaller number of speakers and/or specific languages.
8. Okay, thanks for the review. Getting back to the ISTS, how did you compose it from the recordings you mentioned?
We split the recordings into segments with durations of approximately one syllable. Our first approach was an automatic procedure which looked for the possible cutting points at the lowest power of the speech signals. But this procedure had to be modified by hand to avoid unnatural transitions. In the end, the segments had a length of 100 to 600 ms containing speech utterances and speech pauses. To avoid clicks when reattaching the segments, they were windowed to create smooth transitions and zeros at the beginning and the end. Sections of the ISTS with durations of 10 seconds or 15 seconds were composed out of these segments by attaching in a pseudo-random order. Several restrictions were taken into account, like language switching from segment to segment and maximum steps in the fundamental frequency. Also speech pauses were included at certain distances to resemble normal fluent speech as close as possible. The resulting sections of the ISTS were filtered again to match the ILTASS of Byrne et al. (1994), a DC-offset was removed and the signal was calibrated to 65 dB SPL.
9. Sounds like a lot of work. How long is the final version?
The whole signal has a duration of 60 seconds. The first 15 seconds are intended for the adjustment of the hearing instrument’s signal processing to the speech signal. The following 45 seconds can be used for the measurement of the hearing instrument itself. For a shorter measurement, this duration can be shorted to 10 seconds. In clinical practice the audiologist easily can turn the signal on and off to obtain durations which coincide with whatever programming is taking place. The ISTS can as well be downloaded from www.ehima.com under the ”Documents” heading. It is available as 16 and 24 bit version and comes with terms to use. You can listen to a sound sample here:

10. Seems like you did a lot to alter the original speech recordings. Does this signal really have all the properties of natural speech?
It is as good as it can be. In our paper Holube et al. (2010), we give a detailed analysis of the ISTS. Long-term and short-term spectral as well as temporal analysis showed it’s very similar to natural speech, which is no wonder, because it is composed out of it. From the construction procedure it results that the fundamental frequency shows more variability than in some of the languages alone. But in other languages, like for example Mandarin, more variability in the fundamental frequency is quiet natural. Also, you can recognize that the ISTS is composed of different voices and you can understand some syllables or short words in your mother tongue or in other languages which might be familiar to you.
11. So in the clinic, what do I do with this test signal? Am I using it to adjust the hearing aids for my patients?
That’s one possible use, yes. This takes us back to the analysis procedure I mentioned earlier, which is part of the new measurement standards IEC 60118-15 and ANSI S3.42. The LTASS is a good measure for speech averaged over a longer time frame, and the amplification of hearing instruments can be studied by comparing the output of the hearing instruments versus their input. But if you would like to know how the signal processing impacts speech, you need to do a short-time analysis, the percentile analysis.
12. I have to say that I’ve never heard of percentile analysis for fitting hearing aids. How does it work?
Well. You may have been indirectly using it and not really thinking about it. For example, with the popular Audioscan Verifit system, which has been in use for over a decade, in the speechmap mode you observe the amplified speech signal (typically the male speaker, referred to as the “carrot passage”). This amplified signal usually has a range of 20-30 dB, depending on the compression characteristics of the instrument tested. The top curve of this range is the level exceeded 1% of the time (speech peaks), the lower curve is the level exceeded 70% of the time (speech valleys). The middle curve is the average (LTASS). So in fact, this is a type of percentile analysis, which has been routinely used for many years.
But let me explain how percentile analysis is implemented with the ISTS. First, consider that speech is not a stationary signal. When using this approach, the speech is again filtered in 1/3-octaves. The output of the filters is cut into windows with a length of 125 ms each and an overlap of 50% and the level of each window is calculated. The distribution of these short-term levels is the bases for the percentile analysis. The 50th percentile divides the level distribution in two halves. This level is exceeded by 50% of the short-term levels and 50% are below, i.e., the 50th percentile is the same as the median level. But this level is not the same as the average level since the level distribution of speech is not symmetric. The other measures known from statistics are the lower and upper quartiles which correspond to the 25th and the 75th percentile. The 25th percentile denotes that level which is exceeded by 75% of the short-term levels whereas the 75th percentile is exceeded by 25% of the short-term levels.
The standards committee selected the 30th, 65th and 99th percentile of the ISTS. The 30th percentile represents the soft parts of speech, the 65th percentile is similar to average speech and the 99th percentile describes the peaks of speech. The 30th percentile was selected instead of the 1st percentile because the latter one would be much more dependent on background noise in the measurement condition. The difference between the 99th and the 30th percentile describes the dynamic range of the speech signal. The LTASS and the percentile analysis for the ISTS with a level of 65 dB SPL at the input of a hearing aid is shown in Figure 1 (left panel) and the amplified ISTS at the output of a hearing aid is shown in Figure 1 (right panel).
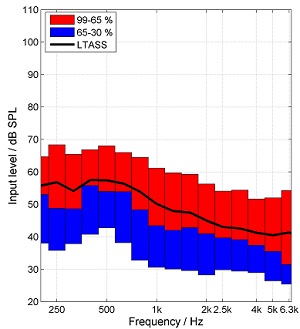
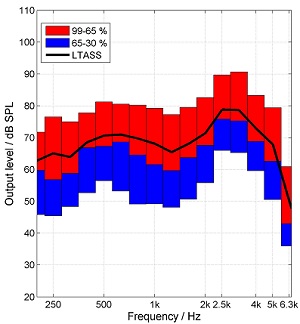
Figure 1. ISTS for an input level of 65 dB SPL (left) and at the output of the hearing aid (right). LTASS (black line), 30th percentile (lower boarder of blue boxes), 99th percentile (upper boarder of red boxes), and 65th percentile (border between blue and red boxes). From: “Elk test” for percentile analysis.
13. Sounds reasonable, but how can you use this percentile analysis for measuring hearing instruments?
The percentile analysis is conducted for the input signal and time windows near the specified percentiles are identified. The short-term levels of the same windows in the output signal are calculated and the difference between the respective output and input levels gives the gain for those parts of speech. Linear hearing instruments result in the same gain for all windows or percentiles respectively, but nonlinear hearing instruments apply more gain to the lower percentiles than to the higher percentiles and reduce the dynamic range of speech (see Figure 2).
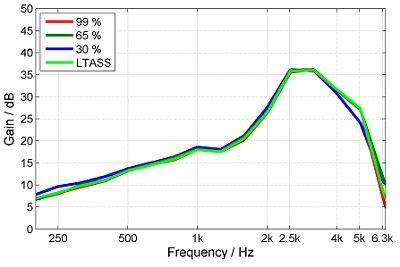
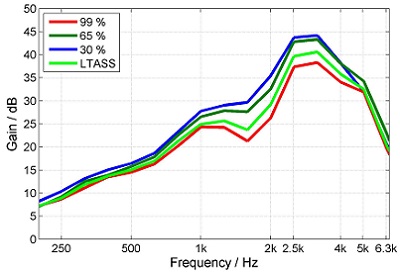
Figure 2. Gain for different percentiles for a linear hearing aid (left) and a nonlinear hearing aid with compression (right). From: “Elk test” for percentile analysis.
14. So will the output for different compression instruments set to the same compression ratios look the same?
Probably not. The level changes of speech interact with the attack and release times of the dynamic compression and also with other algorithms within a hearing instrument. The different components of speech, which have different short-term levels, are amplified differently. Short release times, like in syllabic compression, are more able to adjust to the lower levels within a speech signal and amplify those more compared to higher levels than hearing aids with longer release times. Therefore, syllabic compression (short time constants) reduces the dynamic range of the amplified speech more than automatic volume control (AVC; long time constants) (Figure 3).
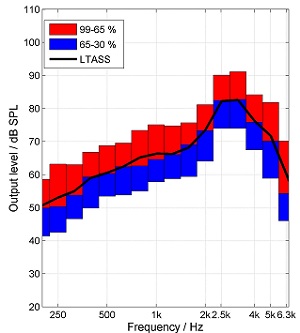
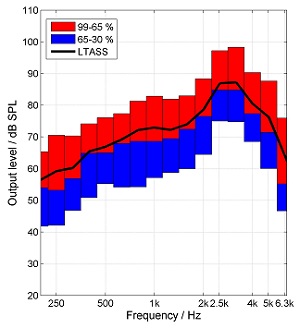
Figure 3. Percentile analysis of the output of a hearing aid with short (left) and long (right) attack and release times. The overall gain of the instrument was not altered, only the time constants. From: “Elk test” for percentile analysis.
15. I’m understanding this, but you still didn’t really tell me how I use the results?
The intension of IEC 60118-15 and ANSI S3.42 is to characterize the signal processing in hearing instruments for speech and describes only gain calculations. But measurement equipment also displays the percentiles of the output of the hearing instrument together with the hearing threshold and the uncomfortable level (Figure 4). When you look at those displays, you can make up your mind whether speech should be recognizable for your specific patient or which parts of speech might be below threshold or too loud. You can also use this analysis to counsel your patient and set a goal for long-term adjustments if the initial fitting is not acceptable (e.g., high frequencies sound harsh on the day of the fitting). To individualize your analysis, you can use the ISTS as the test signal in your probe microphone system. In Germany, we have a study-group which deals with hearing aid measurements, especially the percentile analysis. We have formulated recommendations for hearing instrument fitting using ISTS as well as calibration issues. These documents can be downloaded from the webpage of EUHA.
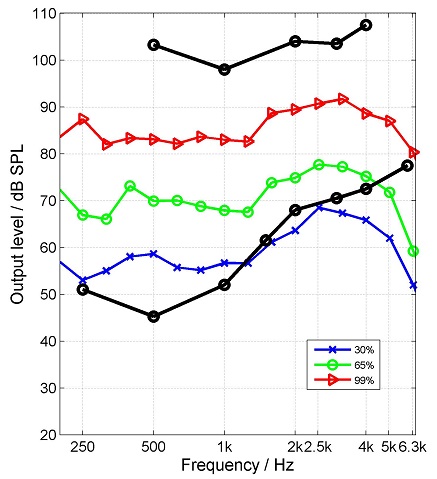
Figure 4. Percentile analysis of the output of a hearing aid together with the hearing threshold and the UCL (black lines). In this example, the top red curve represents the 99th percentile, the middle green curve is the 65th percentile, and the lower blue curve is the 30th percentile. The gain of the hearing aid might be considered too low in the high frequencies, leaving softer components of speech inaudible (note the 30th percentile is below the hearing threshold).
16. Are you saying percentile analysis is a replacement for the traditional fitting methods such as the NAL-NL2 and DSLv5.0?
No, certainly not. IEC 60118-15 and ANSI S3.42 describe a measurement and analysis procedure, and not a fitting method. Some of the probe mic systems allow for the ISTS to be used in conjunction with the prescriptive targets of the NAL-NL2. You can present the ISTS at different input levels, e.g., 55, 65, and 75 dB SPL and fit the LTASS at the output of the hearing aid to the respective NAL-NL2 targets. This might include that the ISTS is below threshold in the high frequencies if NAL-NL2 does not recommend more gain in this frequency domain. Unfortunately, NAL-NL2 does not prescribe targets for the percentiles because it includes no recommendation for the duration of the time constants.
Don’t try to fit the 30th, the 65th, and the 99th percentile to the NAL-NL2 targets for 55, 65, and 75 dB SPL, respectively. The different percentiles belong to the speech dynamics for one specific input level and they are influenced by the time constants of the dynamic compression algorithm as described above. But if you fit the LTASS for the ISTS to the NAL-NL2 targets, you can observe the percentiles and use them as information about the amount of compression applied by the hearing aid to the speech signal and the resulting speech dynamic range relative to the LTASS.
17. Other things I can assess with the ISTS?
Well, the good thing about the ISTS and the percentile analysis is (as I already said) that you can measure while the dynamic compression and the noise reduction algorithms in hearing aids are switched on and obtain the same and comparable results in different test boxes. Furthermore, you can even create your own signals like ISTS mixed with noise and observe whether the hearing aid is able to reduce the noise. For this purpose, you should pay attention to the 30th percentile of the mixed output signal of the hearing aid and should observe whether this percentile is reduced in level while the higher percentiles are still in place when changing from noise reduction off to on.
Some hearing aid special features, however, are more difficult to evaluate. For example, frequency compression is difficult to interpret since frequency components of the input signals are shifted to a different frequency region and therefore, the output signals in the different bands do not correspond to the respective input signals.
18. What about testing the hearing aid’s MPO?
As I described earlier, the ISTS is a broadband frequency-dependent signal. As such, the level in the different frequency regions is below the broadband level, especially in the high frequencies. Therefore, it is difficult to measure the upper limit of a hearing aid with the ISTS and compare this output to the patient’s UCL. For this purpose, you would need to apply a sinusoid signal of at least 85-90 dB SPL at the input of a hearing aid. On the other hand, sinusoids might generate hearing aid settings which are different than the MPO that would be reached in everyday life. To solve this problem, the percentile study group in Germany recommends a combination of the ISTS with short sinusoidal beeps at 90 dB SPL. This signal can also be downloaded from the webpage of EUHA.
19. So is that all I need to know about the ISTS?
Just about. I want to go back and explain one more thing that I mentioned earlier—the IFFM. We wanted to use the ISTS also as a masker in speech tests, but were concerned that the pause durations of up to 600 ms would be too long and might allow for easy detection of words or parts of sentences. Therefore, we shortened the pause durations to no more than 250 ms. To prohibit confusion with the ISTS, we rearranged the order of the sections within the signal and called this signal the International Female Fluctuating Masker (IFFM). We also composed a stationary noise by overlaying the speech material several times in random order. This noise has the same spectrum as the LTASS of ISTS and IFFM but no temporal fluctuations. We labeled this signal the International Female Noise (IFnoise). Both, IFFM and IFnoise are also available at www.ehima.com under documents. We showed that the speech recognition threshold (SRT), i.e., the threshold for a speech recognition score of 50%, is similar for sentences in IFFM as well as for natural speech (Holube, 2011). You can listen to the IFFM signals here:
IFFM
IFnoise
20. So all and all, has the ISTS been accepted as well as you thought it would be?
Oh yes, the ISTS was accepted by all hearing instrument manufacturers and released as a standard in IEC as well as ANSI. Also, all manufacturers of measurement equipment have implemented the ISTS in their products. As I described, in Germany, we have a very active group which discusses recommendations for audiologists for applying the procedures in their everyday practice of fitting hearing aids. I am glad that we don’t hear “you can’t measure this hearing aid because its signal processing is so complicated” any more.
References
American National Standards Institute/Acoustical Society of America. (2012). ANSI/ASA/S3.42-2012/Part 2/ IEC 60118-15:2012 Testing Hearing Aids — Part 2: Methods for characterizing signal processing in hearing aids with a speech-like signal (a nationally adopted international standard).
Bisgaard, N., Vlaming, M.S.M.G., & Dahlquist, M. (2010). Standard audiograms for the IEC 60118-15 measurement procedure. Trends in Amplification 14(2),113-120.
Byrne, D., Dillon, H., Tran, K., Arlinger, S., Wibraham, K., Cox, R.,...Ludvigsen, C. (1994). An international comparison of long-term average speech spectra. Journal of the Acoustical Society of America, 96(4), 2108-2120.
Holube, I. (2011, August). Speech intelligibility in fluctuating maskers. International Symposium on Auditory and Audiological Research (ISAAR), Nyborg, Denmark. Available from https://www.isaar.eu/
Holube, I., Fredelake, S., Vlaming, M., & Kollmeier, B. (2010). Development and analysis of an International Speech Test Signal (ISTS). International Journal of Audiology, 49, 891-903.
International Electrotechnical Commission (2012). IEC 60118-15, Electroacoustics - Hearing aids - Part 15: Methods for characterising signal processing in hearing aids with a speech-like signal.
Cite this Content as:
Holube, I. (2015, February). 20Q: getting to know the ISTS. AudiologyOnline, Article 13295. Retrieved from https://www.audiologyonline.com.