
 From the Desk of Gus Mueller
This month’s 20Q reviews some of the key findings from the recent MarkeTrak 10 survey. MarkeTrak surveys have been with us for over 30 years, and you frequently see them referenced in hearing aid publications. It seems, however, that we tend to focus on the more negative aspects of the findings. When we are encouraging audiologists to conduct frequency-specific LDLs, and set the patient’s AGCo kneepoints accordingly, we cite the large number of hearing aid users who are dissatisfied with loudness. When we are discussing the need for more advanced noise reduction algorithms, we cite the large number of hearing aid users who are dissatisfied in background noise. And of course, we all remember the MarkeTrak finding from the 1990s, that only 35% of hearing-impaired non-adopters stated they would wear hearing aids, even if they were free and invisible!
But market penetration and satisfaction keeps getting better with each survey, and maybe it’s time to talk about all the good stuff. How about these encouraging findings from MarkeTrak 10:
- Only 8% of hearing aid users are dissatisfied with sound quality.
- If we compare users of hearing aids that are </= 5 years old to </= 1 year old, we see that for following conversations in background noise there is a 7% improvement.
- For using hearing aids in the workplace, satisfaction has gone from 65% for MarkeTrak VIII (~2010) to 92% today.
- For listening in background noise, satisfaction goes from 27% for non-adopters to 76% for hearing aid users!
These are exactly the kind of things that hearing aid candidates need to hear, which is why MarkeTrak findings are such an important tool for counseling. And to review all the good news from MarkeTrak 10, we have a special 20Q guest author.
Kate Carr is President of the Hearing Industries Association. She has extensive expertise in non-profit management, government, cause marketing and advocacy. She has served as an Assistant to the President in the Clinton White House, as President and CEO of the Elizabeth Glaser Pediatric AIDS Foundation, Managing Director of Malaria No More and President and CEO of Safe Kids Worldwide. She also has worked in executive roles at the nonprofit organizations, Accelerate Brain Cancer Cure (ABC2), and the Welfare to Work Partnership.
In her excellent review, Kate reports on several different areas related to the fitting and dispensing of hearing aids, and even addresses a few new MarkeTrak topics, such as users and non-owners thoughts on PSAPs and OTCs. Are the consumers ready? Are we ready?
Gus Mueller, PhD
Contributing Editor
Browse the complete collection of 20Q with Gus Mueller CEU articles at www.audiologyonline.com/20Q
20Q: Consumer Insights on Hearing Aids, PSAPs, OTC Devices, and More from MarkeTrak 10
Learning Outcomes
After reading this article, professionals will be able to:
- List key findings from MarkeTrak 10 regarding hearing aid market penetration; reasons/motivation for hearing aid purchase; price/payment issues.
- Explain factors relating to hearing aid satisfaction based on MarkeTrak 10 research.
- Discuss how hearing care professionals can impact hearing aid satisfaction based on MarkeTrak 10 data.
- Report consumers' experiences with PSAPs and OTC devices based on MarkeTrak 10 research and list takeaways for hearing care professionals.
 Kate Carr
1. I have heard of the MarkeTrak surveys, but can you tell me more about them?
MarkeTrak surveys have been conducted under the guidance of the Hearing Industries Association (HIA) since 1989. HIA's mission is very straightforward: We work to be the trusted voice on hearing health care for product innovation, public policy, patient safety, and education. Our members are the companies that manufacture, distribute and sell more than 90% of the hearing aids sold in the United States on an annual basis, as well as components and battery manufacturers. Our work is focused on advocacy, market research, and increasing public awareness and education. You can learn more about our work at www.betterhearing.org and find resources to promote an annual hearing check at www.hearwellstayvital.org.
The first MarkeTrak survey was conducted in 1989 when data was collected on the estimated incidence of hearing loss within the U.S., household income and education related to hearing aid use, satisfaction with hearing instruments, new user rates by age, physical health effects of hearing loss, and many others. Since then, every three to four years, HIA commissions a detailed survey with comprehensive findings on these topics. Full reports are confidential to our members, but we are pleased to share some of these exciting findings with professionals via outlets such as 20Q.
HIA commissioned Az Marketing Research Inc. to conduct our most recent survey, an online survey to 20,072 households in October 2018. This representative sample, which is balanced and weighted to key U.S. census characteristics, reached 55,650 individuals of which 3,132 individuals reported hearing difficulty. Of this target population, 969 were hearing aid owners and 2,163 were hearing aid non-owners.
2. That sounds like a lot of useful data. Thinking big picture - can you identify one or two trends in MarkeTrak 10 that are significantly different from previous MarkeTrak research?
In virtually all waves of MarkeTrak surveys, a group of questions on one or more contemporary issues on hearing has been asked. These questions include things like binaural fittings, quality of life changes, the role of the medical community in respondents’ decision-making, to name just a few. In the current survey, MarkeTrak 10 (MT10), there were two additional special themes: Over-the-Counter (OTC) or Do-It-Yourself (DIY) hearing care, and third-party involvement in payments. Without a doubt, consumers with an interest in hearing aids will be seeing and perhaps considering some form of DIY hearing care once the OTC regulation is finalized and new devices become available. The growth of third-party payments for hearing aids will continue. Hearing care professionals need to become knowledgeable about the programs and to consider involvement in one or more programs to best serve their patients and customers.
3. Sounds interesting. First off, how are we doing with hearing aid market penetration? Are we making progress?
While the majority of Americans know someone affected by hearing loss, we learned that slightly more than one-third of those with self-reported hearing loss own hearing aids today. This rate is comparable for men and women, highest among older individuals, and lowest among middle-aged individuals. We have seen a significant increase in hearing aid adoption rates in the last ten years with the rate going from about 25% in 2008 to 34% for MT10. During this timeframe, hearing aid technology and benefit increased dramatically as well. Figure 1 displays the adoption rate obtained from our surveys going back to 1989. I should mention that MT9 and MT10 were online surveys, while the earlier surveys were paper/pencil. It is possible that this could have influenced our adoption rate findings, but the 4% increase from MT9 is encouraging. It’s not time to celebrate, however, as we certainly are not yet reaching every person that needs assistance.
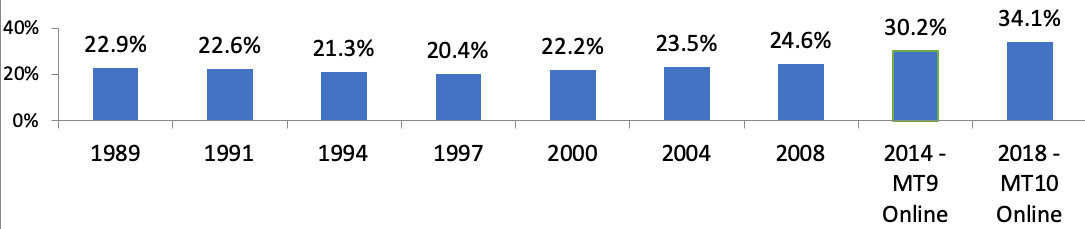
Figure 1. Hearing aid adoption rate (percent of individuals owning hearing aids) from 1989 to 2018. MarkeTrak 9 (MT9) and MT10 were online surveys, while all previous surveys were paper-and-pencil, mail-in response surveys.
4. Did you see any changes in the length of the journey from becoming aware of hearing difficulty to first obtaining hearing aids?
Let me first give you some demographics for the individuals in MT10. For our sample, the average age of individuals with hearing difficulty is 58 years of age and the average age of a first-time buyer is 65 years. Table 1 provides additional insights regarding ages for other factors. We also asked about the number of years that people were aware of having hearing difficulty. Hearing aid owners stated being aware of hearing difficulty for 14.6 years on average, as compared to hearing aid non-owners who had an average of 10.5 years. This pattern is similar to MT9.
To specifically answer your question, our data from those with self-reported hearing loss reveals, on average, that an initial discussion with a general medicine doctor (n=606), ENT (N=625), hearing care professional (n=1529) occurred four years after becoming aware of hearing difficulty. At this point, they had a hearing test, and the average wait to obtain their first hearing aids occurred at six years (Figure 2).
| Mean | Median | |
| Current age of individuals with hearing difficulty (n=3132) | 58 | 61 |
| Current age of non-owners (n=2163) | 54 | 57 |
| Current age of all HA owners (n=969) | 66 | 71 |
| Age when all owners got 1st HA (n=845) | 59 | 65 |
| Current age of first-time purchasers (n=566) | 65 | 70 |
| Age when first-time purchasers got HA | 62 | 67 |
| Current age of repeat purchasers (on 2nd+HA now) (n=381) | 69 | 75 |
| Age when repeat owners got 1st HA | 56 | 62 |
Table 1. Age demographics for all MT10 respondents (n=3132).
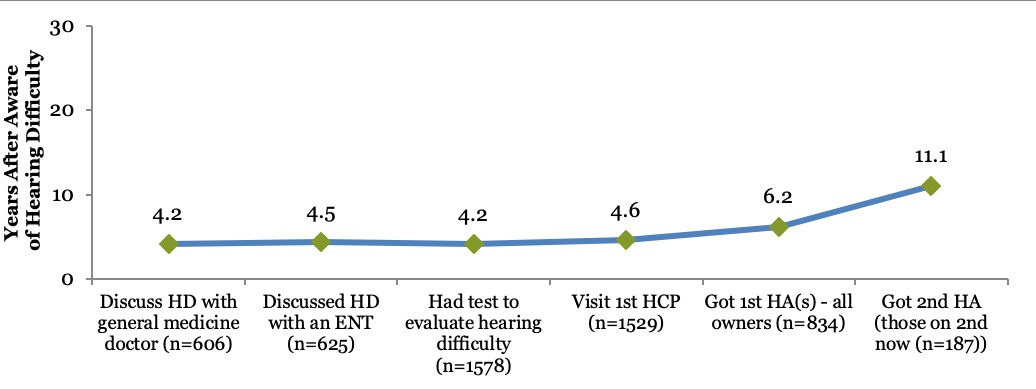
Figure 2. The average years for hearing aid owners to take each step in obtaining assistance after becoming aware of their hearing difficulty.
We found that hearing aid adoption rates increase with severity of the hearing loss, except for those with profound loss. For example, only 14% of those who self-reported a mild hearing loss have obtained hearing aids. The adoption rate goes to 37% for moderate hearing loss, and to 58% for those who say they have a severe loss. The majority of hearing aid owners say discussions with their hearing care professional and hearing test results motivated them to address their hearing loss. The reasons given for purchasing a hearing aid are displayed in Figure 3. Note that among the top reasons were that a hearing test clearly demonstrated a need, and they trusted the hearing care professional.
The reasons non-owners don’t take steps to obtain hearing aids cover the gamut. For those who have hearing difficulty but have not taken any action, there is a strong sentiment that they can hear well enough in most situations, with financial issues coming in second. The issue of cost is a major factor for those who have seen a hearing care professional and have a recommendation to purchase a hearing aid but failed to act. Figure 4 includes a summary.
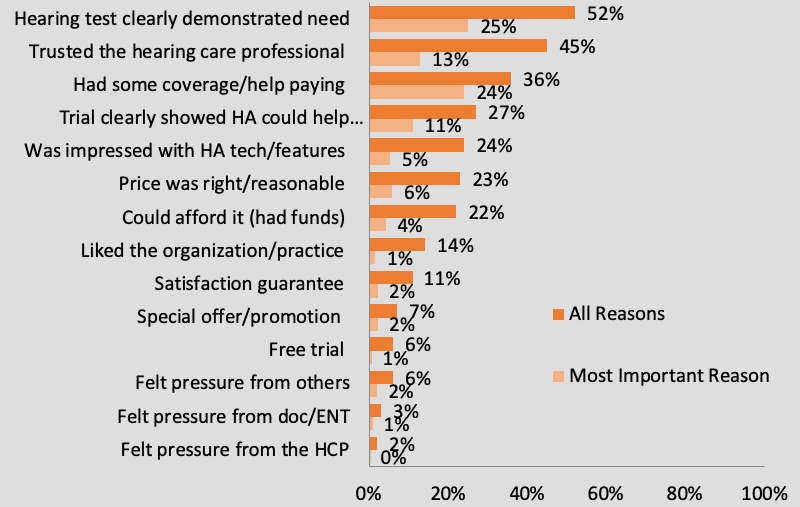
Figure 3. The reasons for the purchase of hearing aids by owners (n=969). Respondents could provide multiple responses.
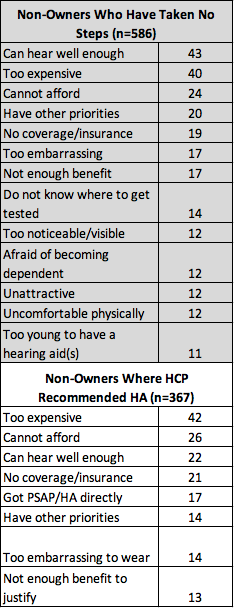
Figure 4. Top (gray shaded): Top reasons for non-owners who have not taken any steps to obtain a hearing aid. Bottom: Top reasons for no action to obtain a hearing aid even when a hearing care professional recommended hearing aids (participants could provide multiple responses).
5. Issues regarding price/ability to pay seem to be strong deterrents to consumers getting hearing aids. And third-party payments tie into this.
Most certainly. It’s interesting to see help with third-party reimbursement emerging as one of the most important reasons to purchase hearing aids. Having insurance is the single biggest motivator for non-owners to consider purchasing hearing aids. About half of hearing aid owners said that they had third party coverage for some or all of the cost of hearing aids. The main sources of third party hearing aid coverage are VA/Military, Medicare Advantage and HMO/Insurance. There has been a steady increase in third party payment as noted in Figure 5.
An important finding was that 48% of non-owners were not sure or not aware of discounts, partial or full payments. With more Medical Advantage plans offering coverage for dental, hearing and vision, there is an opportunity to increase our efforts to better educate patients and consumers.
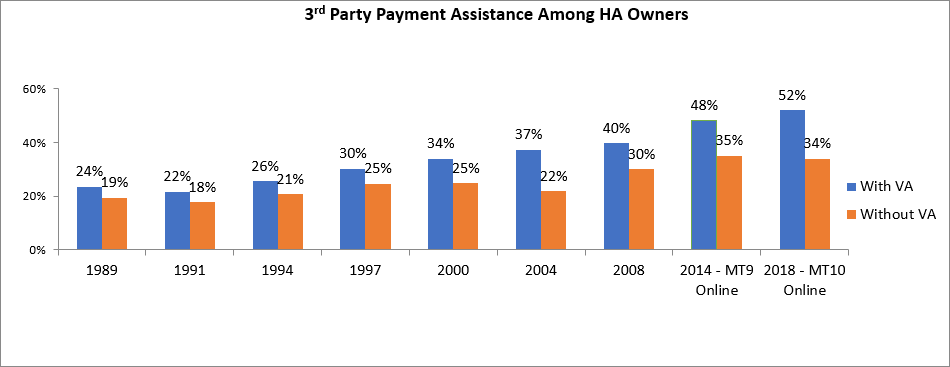
Figure 5. Percentage of third party reimbursement for hearing aids reported by hearing aid owners.
What would it take for these individuals to take action? That was one of the questions we asked. An interesting finding is that about one-third of non-owners assume they would have some level of assistance/coverage for the cost of hearing aids while 48% are not sure or aware of third party coverage. Having insurance or some type of coverage is the single biggest motivator for non-owners to consider when purchasing a hearing aid, although there are others that appear that they could have an impact, as listed in Figure 6.
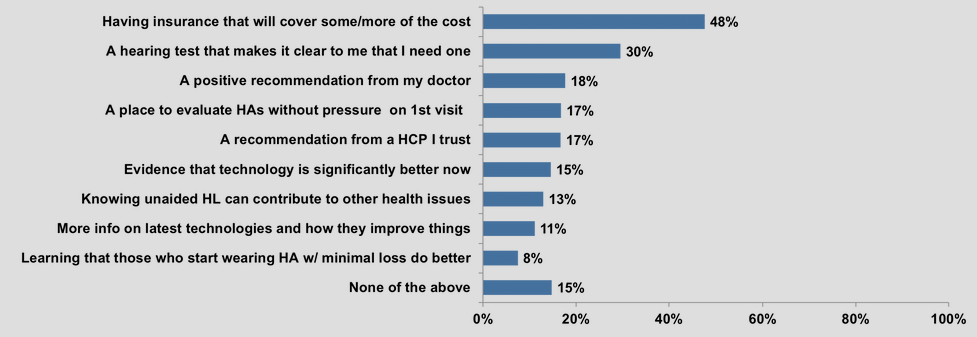
Figure 6. Motivation for non-owners to purchase hearing aid sooner (n=2157) – multiple responses allowed.
6. Did you ask your respondents their thoughts regarding how they got their hearing loss?
We did. About half of hearing aid owners and non-owners assume their hearing loss is an age-related issue. Many also conclude that their hearing loss is a result of loud noise exposure either on the job, music-related or from the military. For some items, we have essentially the same findings from owners and non-owners (e.g., age related, noise exposure on job). For other items, however, we do see a fairly large difference, such as exposure to loud music (hearing aid owners, 12% v. hearing aid non-owners, 24%). We suspect that this is due the age differences and degree of hearing loss for owners vs. non-owners.
7. Did you uncover any interesting insights on brands and hearing aid features?
Interestingly, most owners classify their hearing aid as a medical device. When owners were asked if they knew the brand of their current hearing aid and to list it (without researching) in our survey, only 44% could do so. The brand is not top of mind, including those who bought their hearing aid more recently. We suspect that the discussion of brand may not be relevant as many owners rely on the recommendation from their hearing health provider. As OTC devices come into the market, brand awareness could increase, and the brand discussion may become more relevant. More importantly, the discussion on the services related to the fitting of their device by the professional will become even more relevant.
Other interesting insights we found are that two-thirds of owners who purchased in the last five years report that their hearing aids have volume control, but only 41% report having a program button or switch to change their hearing aid’s response for different listening environments, like restaurant, outdoors, phone, etc. This could be because modern hearing aids do a lot of automatic switching for different listening environments, and the need for manual switching is less necessary. Or, the owner simply uses their smartphone. We were surprised that so few owners stated that they had directional technology, when this is more or less a standard feature on all RIC and BTE hearing aids, which are nearly 90% of hearing aids sales.
We found that roughly seven in ten of owners did not have rechargeable batteries or rechargeable hearing aids. The main reason owners have not considered or purchased rechargeable hearing aids or batteries is primarily because they were not familiar with them or they were not recommended to them. However, recent HIA sales statistics do point to an increase in the sale of rechargeable devices. Battery issues have consistently ranked high among the problems that MarkeTrak respondents identified. These issues are expected to decrease with the emergence of rechargeability. The summary of responses regarding hearing aid features is in Table 2.
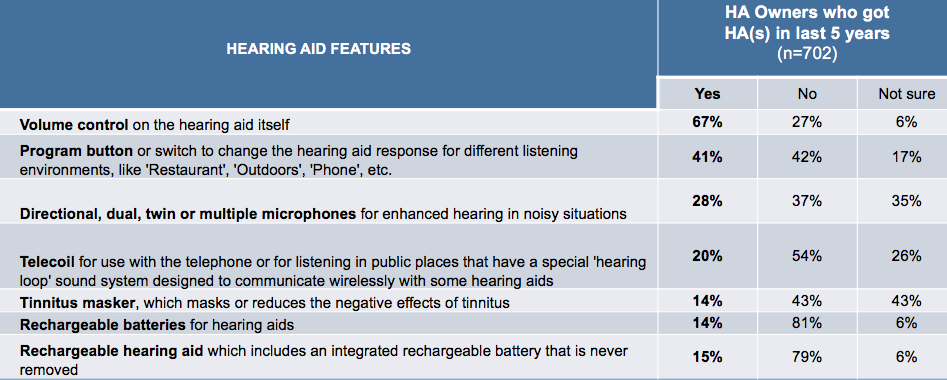
Table 2. Percentage of hearing aid owners reporting having specific features in hearing aids they purchased in the past five years.
8. What about wireless? I suspect that there has been an increase in the use of this feature since your last survey.
You are correct. The number of hearing aid owners with wireless capabilities has increased over time with more than half now able to make program changes, stream sound from a TV, cell phone or computer or increase the volume. This will not surprise anyone involved in hearing healthcare, as wireless features have become increasingly available in more types of hearing aids and at a broader array of price points since MT9 was fielded. An increasing number of hearing devices can be controlled via apps on the owner’s cellphone providing additional features, and in some cases, remote programming capabilities provided by their hearing professional. The very important aspect of this trend is that it underlies two other trends, the increase in quality of life benefits and satisfaction with both hearing professionals and their devices.
The innovative technology associated with hearing aids has advanced rapidly in recent years bringing not only superior sound quality, but many additional features associated with wireless capability and artificial intelligence. There is plenty of room for improvement when it comes to educating people about hearing aid technology. Sixty percent of all respondents said they knew little of nothing about hearing aids and their capabilities. While 78% of all respondents acknowledged owning a smart phone, only 35% of people understood that hearing aids can stream calls and audio from a smartphone to Bluetooth hearing aids.
9. With all this new technology—is this also leading to increased repairs?
It doesn’t appear that way. We found that very few hearing aid owners who purchased in the last five years have had to repair their hearing aids with half reporting never and 27% reporting just once. I believe this speaks to the state-of-the-art manufacturing techniques and robust components now being used in hearing devices. Secondly, improved resistance to moisture and dust has reduced the number of repairs. Also, it’s likely that increased education to patients by hearing care professionals on the importance of daily maintenance (earwax, moisture, etc.) has helped to reduce the need for repairs.
10. Let’s get to the really important stuff. Has hearing aid satisfaction increased over time?
Owners tend to be pretty happy with their hearing aids as the overall satisfaction rate increased from 81% in MT9 to 83% in our most recent survey. It’s no surprise that the newer the hearing aid, the more satisfied the owner. And hearing aids that sit behind the ear have a satisfaction rate of 84% compared to in the ear rates at 79%. These are impressive rates particularly if you compare them to consumer products like personal computers and cell phones that have satisfaction rates of 78% and 79% respectively.
Product quality, ease of use and appearance rank high for satisfaction. Sound quality, maintenance and physical comfort also rank high with more than 70% reporting being satisfied or very satisfied (Figure 7). It is also important to consider the number of respondents who report dissatisfaction (a rating of #1, #2 or #3). When we think of something as important as sound quality, consider that only 8% - yes, only 8%! - of respondents were dissatisfied with the sound quality of their hearing instruments. This is great news!
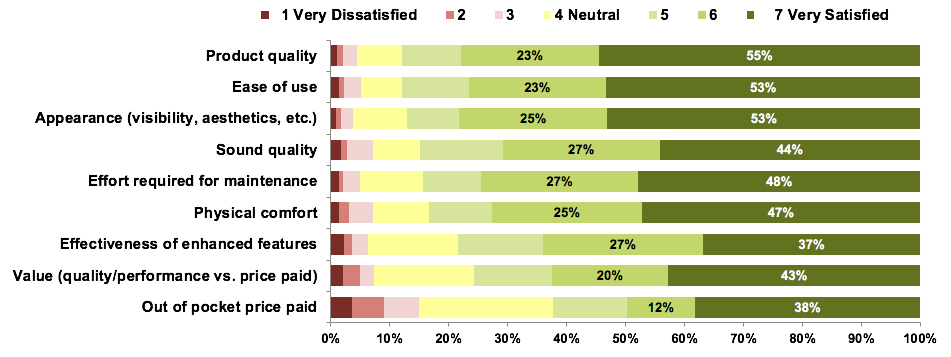
Figure 7. Overall satisfaction of the key attributes of hearing aids for owners that purchased within the past five years (includes numerical percentages for satisfied/very satisfied responses).
11. Logically, the more features, the more satisfied the patient should be. Was this true?
First, there were not large differences in satisfaction related to the features present on the hearing aids (Figure 8). There were several features, when present, increased satisfaction significantly. These features included: directional microphones, telecoil, app for smartphone, Bluetooth device, tinnitus masker, wireless hearing aid, multiple environments, and volume control on the hearing aids.
Owners are the least satisfied with the price paid which is typical for almost all categories of more complex durable goods. Overall, when it comes to satisfaction, there is no substitute for hearing aid performance. The hearing care professional also is a key contributor to satisfaction rates.
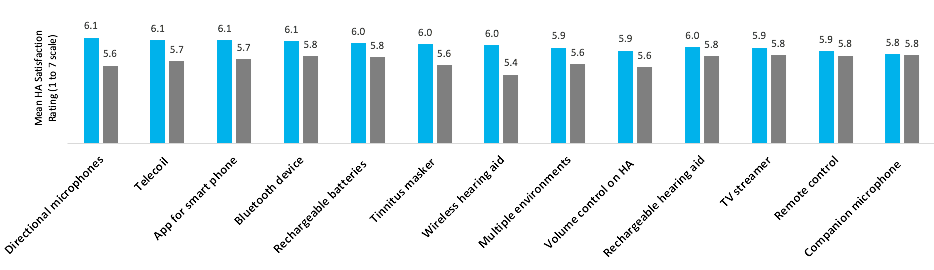
Figure 8. Overall satisfaction of current owners (purchased in the last 5 years) of their hearing aid based on the reported feature in their devices, on a 1 to 7 rating scale (#1 = Very Dissatisfied, #7 = Very Satisfied). Blue = My hearing aid has this feature/accessory; Gray = My hearing aid does not have this feature/accessory.
12. My patients care about how well hearing aids work in background noise. How are we doing in that department?
Quite well. Figure 9 has satisfaction ratings for a variety of listening situations, including “follow conversations in noise.” There are also items related to small groups and large groups, where we assume background noise was involved. One finding that we think is meaningful is the comparison between the age of hearing aids going from </= 5 years to </= 1 year. Notice that for items like “home with family members” or “conversations with 1 person” there is little or no difference. However, for "following conversations in background noise", there is a 7% improvement for the </= 1 year group. We think this may be a reflection of the new technology that has been introduced.
If you have a patient who is potential hearing aid user, who is “sitting on the fence,” some of the most powerful counseling information is the satisfaction of new hearing aid users to those people who do not own hearing aids. For listening in background noise, satisfaction goes from 27% without hearing aids to 76%!
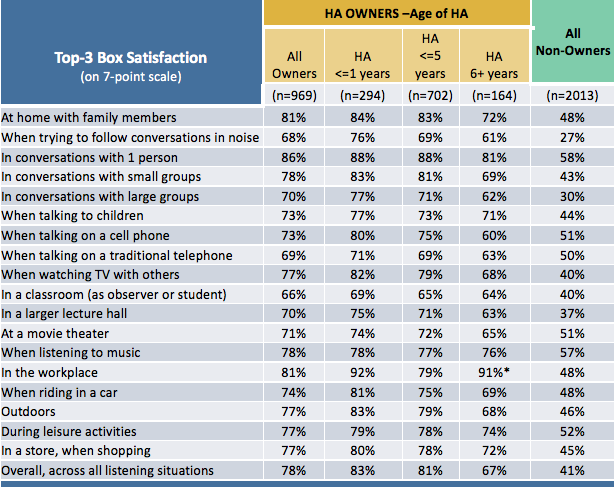
Figure 9. Satisfaction ratings for several different listening conditions for owners of hearing aids for different periods of time, and also for non-owners. Values shown are the combined ratings of “somewhat satisfied,” “satisfied,” and “very satisfied.”
13. That all sounds great - we are making significant progress! Does that mean that we also are improving the owner’s quality of life?
Much like other scientific studies that show how hearing aids improve quality of life, the owners in this survey report that their hearing aids regularly improve their quality of life. Owners report that they communicate more effectively and are more willing to engage in conversation and participate in group activities because they have hearing aids. They also noted improvements in work performance, relationships at work and relationships at home, to name a few. All results are shown in Figure 10.
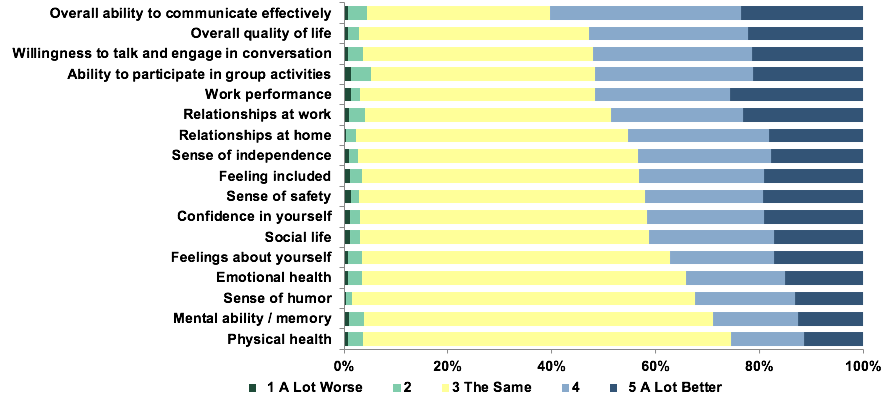
Figure 10. Quality of life changes observed by hearing aid owners who obtained hearing aids within the past five years.
14. Anything else related to quality of life?
Based on the data in Figure 10, it might not surprise you that hearing aid owners show fewer signs of depression compared to non-owners with comparable levels of hearing loss. The PHQ-2 depression symptom screening questions were used to identify persons who meet the first-step criteria for depression. The risk was three times greater for non-owners compared to owners. For hearing aid owners (n=656) the “at risk” was 11%. For non-owners (n=513; top 50% hearing loss group), the risk was 32%.
We also have some other encouraging findings regarding quality of life, which perhaps indirectly relates to depression. We found that hearing aid owners are more likely to regularly exercise, socialize and less likely to feel forgetful (see Figure 11).
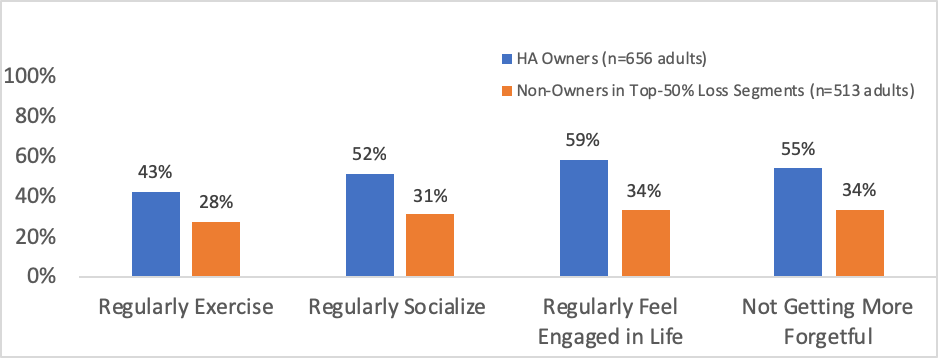
Figure 11. Comparison of four different Quality of Life measures for both hearing aid owners and non-owners.
15. You mentioned earlier that the dispensing professional plays an important role in overall hearing aid satisfaction. Do you have data to support this?
We do. Hearing aid owners almost unanimously agree that the hearing care professional they worked with played a substantial role in their journey with satisfaction rates at 94%. When asked about specifics, the highest ratings are for service quality during fitting, practitioner professionalism and service quality after purchase. The lowest ratings are for selection of hearing aids and purchase policies. These areas have the largest difference between owners and non-owners (Figure 12).
When respondents who saw a hearing care professional in the last five years were asked about the actions that impact overall satisfaction the most, the answers centered around putting patients first. The different items were rated on a seven-point scale from #1 Very Dissatisfied to #7 Very Satisfied. The ratings for each item are shown in the color-coded bars in Figure 12. The satisfied ratings (#5 to #7) were then combined to create the top three box percentage as an indicator of satisfaction and is shown in the top three box score. We suspect that the ratings shown for the non-owners reflect those individuals who progressed through the fitting process but did not elect to continue using hearing aids at the end of their trial period.
As shown in Figure 13, providing a realistic expectation about what hearing aids can do, considering the needs and abilities of the patient, addressing questions and concerns, and making it easy to come in for a follow-up visit were all also important.
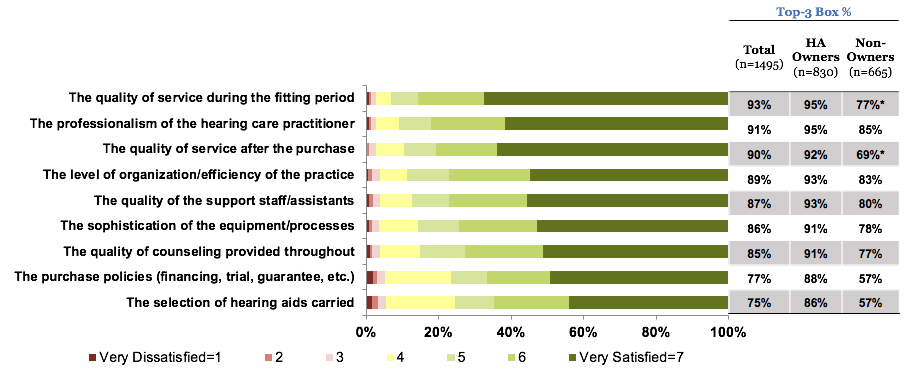
Figure 12. Level of Satisfaction with the Hearing Care Professional (HCP) for the total group, owners and non-owners (saw an HCP in the past five years). Top-3 box % referred to combined score of top three satisfaction categories (#5 -#7) on the 7-point scale.
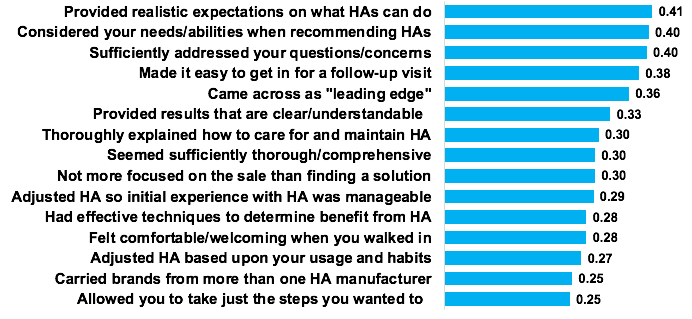
Figure 13. Relative degree to which each action influences the overall Hearing Care Professional satisfaction rating from owners and non-owners. The larger the coefficient, the more impact that area has overall.
16. Did you learn anything about the best method we should use to increase awareness about hearing loss and educate consumers about all the great technology that we have?
This may be surprising to some, but we asked all survey respondents if they were active on social media and found that more than half (61%) had visited a social media site in the last month. For the 61% of the respondents who did visit a site, Facebook was definitely the favorite with 90% of hearing aid owners/non-owners and PSAP non-owners reporting a visit to Facebook, slightly higher than PSAP owners (Figure 14). Other popular sites included YouTube, Instagram, Pinterest, Twitter, Google and LinkedIn. The takeaway is that you need to be visible and engaged on Facebook and other social media sites and use this to drive traffic to your website.
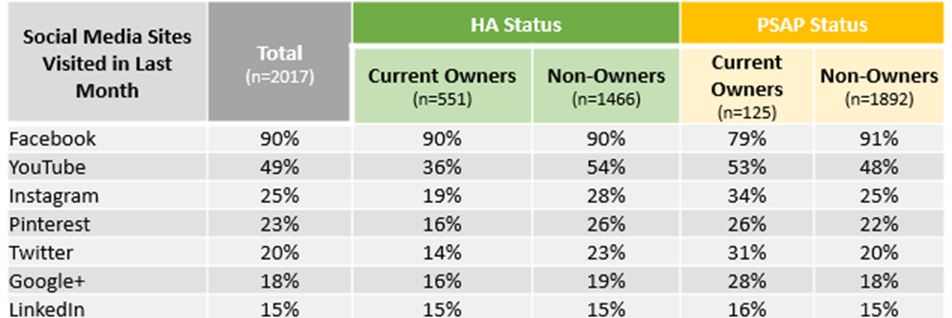
Figure 14. Popularity of different social media sites for the 61% of respondents who visited at least one social media site in the last month.
17. Back when we started our conversation, you mentioned a special area that you were going to explore with MT10 was the OTC/PSAP issue. What did you find?
We collected considerable data on this topic and can certainly share some of it with you. As you know, the August 2020 deadline for the OTC regulation is approaching and we wanted to gather insights from PSAP users that could inform future behavior of OTC owners. Interestingly, half of PSAP users classified their product as a hearing aid and half as an amplifier. Now, if their product was purchased directly and not through a hearing care professional, it was classified as a PSAP. Very few PSAP owners know their brand. This percentage, 16%, is even lower than the brand recognition for hearing aids at 44%.
Overall the satisfaction rates for PSAPs are significant yet not as high as hearing aids with fewer current PSAP owners satisfied with their device compared to hearing aid owners. The overall satisfaction rate for current PSAP owners (n=193) is 64% and as stated earlier the satisfaction rate for hearing aid owners is 84%. For individuals who once owned a PSAP but are not current owners (n=484) the satisfaction rate is 47%. When we probed deeper into owner satisfaction, we found that the scores for maintenance, reliability and price were best and lowest for richness of sound and effectiveness of enhanced features. About 8 out of 10 PSAP owners feel that their expectations have been met with half of all current owners saying their PSAP is better than expected. These expectations are exceeded when the sound quality is good, and the physical product is comfortable and made well.
Current PSAP owners are likely to purchase online with their personal motivation being tired of asking people to repeat (26%), felt ready, willing and able (26%), had a specific experience (23%) or life change that made it possible or more important (15%). PSAPs are primarily used in the home for watching TV (64%), communicating at home (54%), and in restaurants (42%).
Most of the PSAPs are 2 years old or less and few are older than 5 years. We saw a wide range of prices from less than $20 to more than $500 with the average price at $292 (Figure 15).
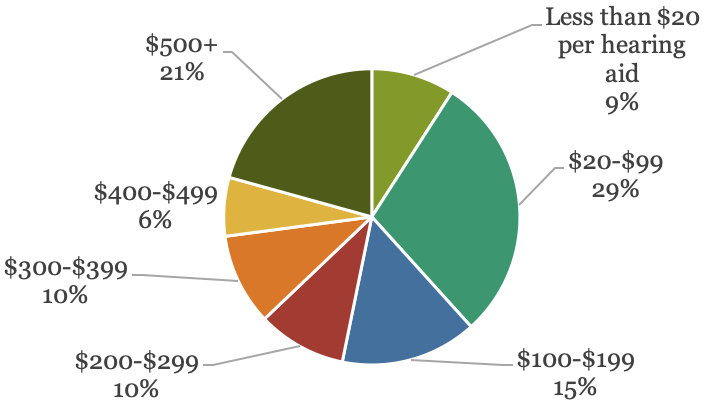
Figure 15. Shows the range of prices paid reported by 119 PSAP current owners.
18. How do the demographics of PSAP owners compare to those of hearing aid owners?
We found that owners of hearing aids are older and more likely to be retired than non-owners. PSAP owners are younger and more likely to be working. Additionally, a higher percentage of PSAP owners were males (Table 3). The proportion of hearing aid owners who wear their devices daily is 72% as compared to 59% of PSAP owners who report daily usage. Not surprisingly, hearing aid owners tend to wear their hearing aids in all situations while PSAP owners tend to use them primarily at home or possibly in those listening situations they view as difficult.
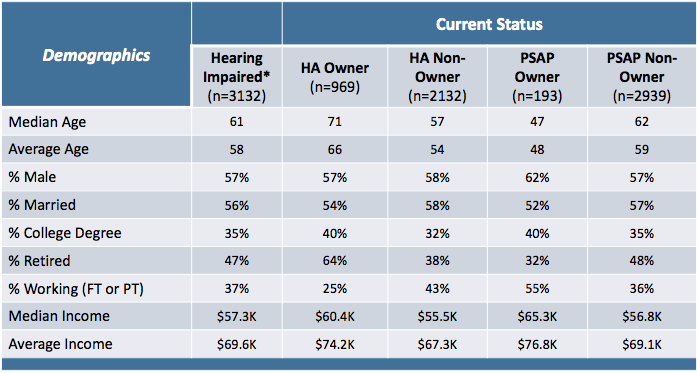
Table 3. Demographic data for respondents broken into the following groups; hearing impaired, hearing aid owners, hearing aid non-owners, PSAP owner, PSAP non-owner.
19. And how about OTC products?
As you know, the OTC product will require more decision making by the patient, and in some cases, will likely involve some degree of self-testing. For this reason, we asked all respondents with hearing difficulty about their comfort level performing some of these tasks on their own. The respondents rated their “level of comfort” on a four-point scale: Not at all comfortable; not very comfortable; fairly comfortable; and very comfortable.
Our data clearly demonstrates the ongoing role hearing care professionals can play. When it comes to making a decision about what device would be right for them, the majority of respondents were not at all or not very comfortable assessing their own hearing loss, with only 15% feeling very comfortable. When it comes to selecting the appropriate hearing aid, the majority were not at all or not very comfortable; only 15% felt very comfortable making this decision. Troubleshooting was also a concern for the majority of survey respondents. Figure 16 has a summary of these findings.
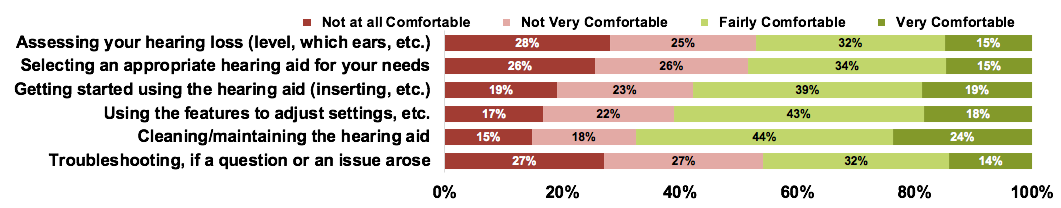
Figure 16. Comfort level reported by consumers with hearing difficulty for some of the tasks they may have to perform with OTC devices (from all respondents with hearing difficulty n=3113).
20. Thanks, a lot of great information to think about. Can you pull out your crystal ball and tell me what the results of MT11 will look like?
Well, lots of things are changing across the spectrum of hearing health care. I suspect that OTC products will be available when we field the research for MT11. Technology will continue to improve particularly with features that are related to artificial intelligence and machine learning. With advances in telehealth, we would expect to see more patients using remote programming, counseling and rehabilitation services through this medium. Health monitoring apps that are combined with hearing aids will provide additional insights into the health-related issues that are associated with hearing loss. Finally, baby boomers that are experiencing hearing difficulty might be more inclined to address their hearing health as they age well. And remember, 10,000 baby boomers turn 65 every single day.
Further information on MT10 can be found on the HIA website, www.betterhearing.org, in Hearing Review (August 2019), in Seminars in Hearing (Special Issue, February 2020) and in upcoming webinars at AudiologyOnline.
Citation
Carr, K. (2020). 20Q: Consumer insights on hearing aids, PSAPs, OTC devices, and more from MarkeTrak 10. AudiologyOnline, Article 26648. Retrieved from www.audiologyonline.com

