
Introduction
Students studying audiological testing enter the clinic with varying degrees of competency regarding the interpretation of acoustic reflex threshold (ART) test results. If a student clinician becomes lost in the maze of right and left, ipsilateral and contralateral "boxes" - often associated with the fairly common, but rather ghastly, 2x2 ART table, then clinical speed may be compromised as a student tries to recall the connection between pathology location and memorized tables. This tutorial reviews the basics of ART pattern interpretation with a clear, simple model for use as a teaching/learning tool for supervisors and students. This model is also shown as it relates to the traditional 2x2 table for cross reference. Students should be aware that the actual anatomical structures and "real life" clinical interpretations are more complex than those shown with this simple model, but this tutorial is intended as an approachable introduction. What follows are six introductory pieces of information and then a step-by-step illustrated guide to simple ART interpretation.
Six Introductory Pieces of Information
First, students must study the anatomy and physiology associated with the ART including the outer, middle, and inner ear structures, the vestibulocochlear nerve (VIII cranial nerve), and structures in the central auditory nervous system (CANS); specifically, auditory structures located at the level of the lower brainstem including the cochlear nuclei, superior olivary complex and facial nerve (VII nerve) nuclei. For this tutorial, students must be aware that the facial nerve innervates the stapedius muscle and that the stapedius muscle contraction is responsible for the acoustic reflex threshold in humans.
Second, the nature of a reflex must be understood. A reflex occurs when a signal is transmitted along a sensory neuron to an interneuron to a motor neuron causing a contraction of the muscle tissue innervated by the motor neuron. This is below the level of cognitive control; in other words, patients do not have to think about it. This is why one pulls a hand quickly away from a hot pot without thinking first, "Wow, my hand is burning" (that comes later) and this is why the stapedius muscle contracts in response to a loud sound, even though the patient does not consciously control the action. When a loud sound enters a normal ear, the stapedius muscle will contract on both sides regardless of which ear is stimulated. Therefore, the ART is a bilateral ("two side") reflex.
Third, the word ipsilateral (ipsi) means "same side" and contralateral (contra) means "opposite side". These terms refer to where the ART is measured relative to where the loud sound is presented. If the ART is measured on the same side in which a loud sound is presented, then it is an ipsilateral ART. If the signal is measured on the opposite side to that in which the loud sound is presented, then it is a contralateral ART. One additional way to remember this is: if the tone is presented on the probe side, then it is an ipsilateral ART. If the tone is presented on the earphone side, it is a contralateral ART.
Forth, "right" and "left" in ART testing refer to the ear that is stimulated by the loud sound. If the signal goes into the right ear and the ART is measured in the right ear, it is called a right ipsilateral ART. If the signal goes into the right ear and ART is measured in the left ear, it is called the right contralateral ART. Note that some audiologists reverse this and use a non-standardized method, which can be confusing (see Emanuel (2004) for more details).
Fifth, the response pattern can suggest a site of lesion, but other tests are necessary for confirmation. One can suspect, but cannot diagnose, site of lesion based solely on the results of ART testing.
Sixth, commercially available diagnostic bridges for testing ARTs are capable of producing high intensity stimuli (e.g., 120 dB HL and higher) and there is documentation in the literature that ART testing can cause permanent hearing loss and tinnitus (e.g. Hunter, Ries, Schlauch, Levine, & Ward, 2000). Although some authors have recommended a maximum presentation level of 110 dB SPL (Wilson & Margolis, 1999), there are no standards for safe presentation levels for pure tone stimuli. OSHA (1983) recommends a limit of 115 dBA for brief duration noise, but a pure tone results in a greater amount of energy concentrated over a smaller area of the basilar membrane compared with noise. In addition, some individuals are uniquely sensitive to the effects of loud sound. Therefore, clinicians should exercise caution in the presentation of loud sounds as well as be familiar with the literature in this regard.
With these six pieces of information in mind, students are ready to proceed to this ART model.
Acoustic Reflex Threshold (ART) Model
Figure 1 provides a model of the acoustic reflex pathway. It bears just about no resemblance to the actual anatomical structures which are extremely small, three dimensional and much more complex in terms of the nerve projections. However, this figure illustrates the main ART pathways and most of the key structures.
Figure 1. A simple model of the acoustic reflex pathway. The acronyms are as follows: ME = middle ear, IE = inner ear, VIII = vestibulocochlear nerve, CN = cochlear nucleus, SOC = superior olivary complex, VII = facial nerve. Note: (1) two of the structures in the pons (SOC and VII nucleus) are shown together for simplicity. They are actually separate structures. (2) A branch of the facial nerve ends at the stapedius muscle and the stapes is shown as a stirrup-shaped stick figure. (3) Some nerve projections are omitted for simplicity.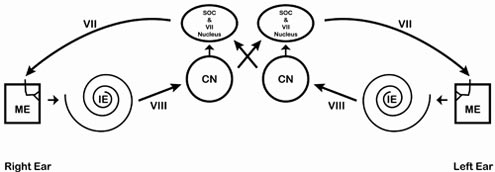
Imagine first a normal right ear and trace the pathway of a loud signal. The signal enters the right ear, travels through the outer, middle (ME) and inner ear (IE), along the VIII nerve, to the brainstem. When the signal reaches the brainstem, the signal arrives first at the cochlear nucleus (CN). From here, the signal travels to both right and left superior olivary complexes and both right and left facial nerve (VII) nuclei. The signal is sent from both facial nerve nuclei to both facial (VII) nerves, which results in a contraction of both stapedius muscles. Thus, both stapes bones are pulled outward and downward, in a direction away from the inner ear. This action makes it harder for energy to travel through the middle ear (increase in impedance/decrease in admittance). The lowest intensity level at which this contraction is measurable is the ART.
The Four Reflex Categories
Highlighted in red (right ear) and blue (left ear) in the following four diagrams are the pathways taken by the signal for right ipsilateral (Figure 2), right contralateral (Figure 3), left ipsilateral (Figure 4) and left contralateral (Figure 5) pathways.
Figure 2. Right ipsilateral pathway.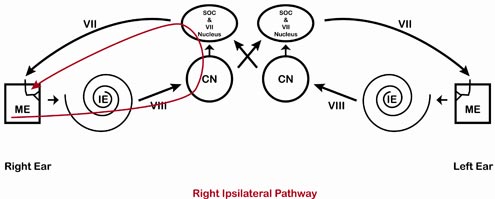
Figure 3. Right contralateral pathway.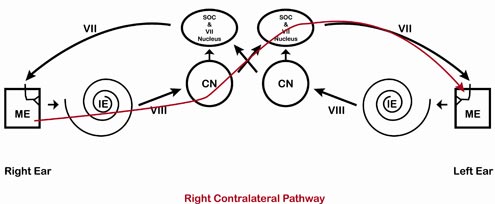
Figure 4. Left ipsilateral pathway.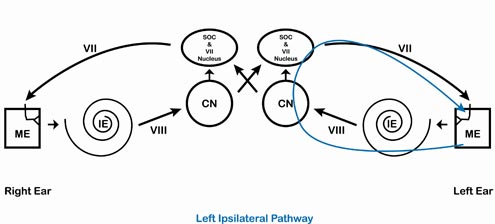
Figure 5. Left contralateral pathway.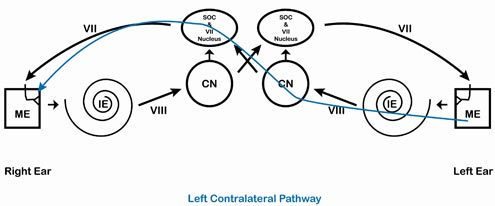
The information from this ART model can be translated into the traditional 2 x 2 ART table (Table 1) for ease of comparison with other textbooks. A normal ear should yield present ARTs from 500 to 2000 Hz at normal levels. This is shown with Normal or N, Present (or P), or Within Normal Limits (WNL) in all of the boxes in the table. The exact notation will depend on the clinical site. For the remainder rest of this tutorial, Normal (N) will be used. Normative values can be found in a number of sources (e.g., Gelfand, Schwander, & Silman, 1990; Silman & Gelfand, 1981; various audiology textbooks) and will not be discussed here. With the normal model and 2x2 table in mind, next examine what happens to the ART pattern for various auditory pathologies.
Table 1. Bilateral normal ART results.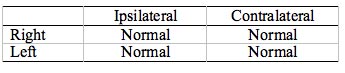
Cochlear Pathology
Imagine first a right cochlear pathology. The signal will affect the ART once the damage to the cochlea has reached a certain degree. For a cochlear hearing loss with air conduction thresholds below about 50 dB HL, the ART should resemble a normal ear. As the hearing threshold increases, the chances of an elevated or absent reflex increase.
Notice in Figure 6 that a right cochlear pathology is highlighted. Any pathway that crosses the damaged area will be affected by the cochlear pathology. So the ART will be absent or elevated whenever the signal is presented to the right ear, regardless of where it is measured. A signal entering the normal left ear will be unaffected, so ARTs will be present for stimuli to the left ear. Thus a pattern of elevated/absent responses on the right side (both ipsilateral and contralateral) and present/normal responses on the left side (both ipsilateral and contralateral) would be the pattern associated with a cochlear pathology on the right side. Table 2 shows this finding in a standard ART table.
Figure 6. Cochlear pathology, right ear. Note that right ipsilateral and right contralateral ARTs are elevated/absent and left ipsilateral and left contralateral ARTs are present.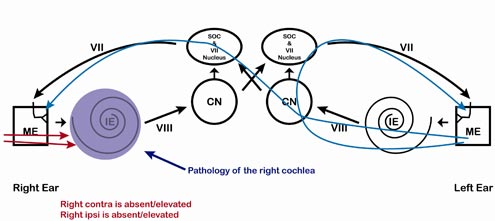
Table 2. Cochlear pathology, right ear. Whenever a tone enters the left ear, the ART is present/normal. Whenever a tone enters the right ear, the ART is elevated or absent. Note that the abnormal responses are located in the same row (both right ear).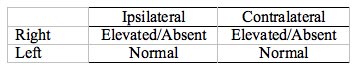
Vestibulocochlear nerve pathology
A vestibulocochlear (VIII) nerve pathology (Figure 7, Table 3) would result in the same pattern as a cochlear pathology; however it is much more likely that ARTs will be absent or unusually elevated compared with a cochlear pathology. Elevated/absent ARTs which do not agree with the hearing loss (again, consult normative values) are a cause for suspicion of retrocochlear pathology. Keep in mind the ART should be tested in combination with a battery approach for differential diagnosis as it is not a perfect test. For example, in an analysis of published studies, Turner, Shepard, and Frazer (1984) found 73% sensitivity and 90% specificity for prediction of acoustic neuroma (more correctly called a vestibular schwannoma) using the ART, so there is plenty of room for error in this test.
Figure 7. Vestibulocochlear nerve pathology, right side. Note that right ipsilateral and right contralateral ARTs are absent/elevated and left ipsilateral and left contralateral ARTs are present/normal.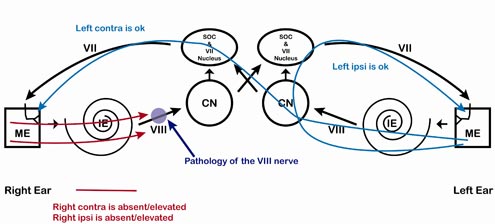
Table 3. VIII nerve pathology, right ear. Whenever a tone enters the left ear, the ART is normal. Whenever a tone enters the right ear, the ART is elevated/absent. The ART pattern is identical to the cochlear pattern but the response is more likely to be absent in a vestibulocochlear nerve pathology or unusually elevated compared with normative values for cochlear hearing loss.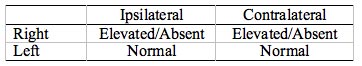
Facial Nerve Pathology
Facial nerve pathology causes a distinct ART pattern; specifically, ARTs are missing whenever ART is measured on the affected side (Figure 8, Table 4). This same pattern can also be seen if there is a problem with innervation of the stapedius muscle, dysfunction of the stapedius muscle, or disconnect between the stapedius muscle and the stapes. Often, facial nerve pathology is associated with other signs of facial nerve involvement, including a facial droop or history of VII nerve palsy (e.g., Bell's palsy).
Figure 8. Facial nerve pathology, right side. Note that anything that is measured on the right side will be affected. This includes right ipsilateral and left contra.\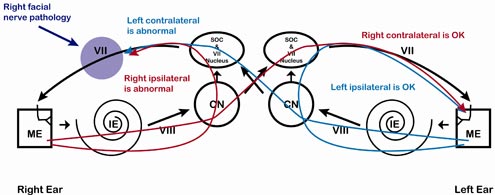
Table 4. Facial nerve pathology, right side. Whenever an ART is measured in the right ear (right ipsilateral and left contralateral) it is absent. Note the absent responses are in opposite corners of the box.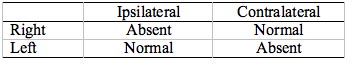
Middle Ear Pathology
Middle ear pathology will affect the signal "coming and going." In more useful terms, the middle ear pathology can decrease the intensity of the signal going into the ear and it can interfere with the ability to measure the ART. Figure 9 illustrates the location of the pathology and Tables 5 and 6 illustrate two examples of possible ART patterns for middle ear pathology. Table 5 shows a milder condition causing ARTs to be elevated and Table 6 shows a more severe condition, such as that seen in chronic otitis media, in which the entire middle ear cavity is filled with fluid. Middle ear pathologies may also cause bizarre ART responses such as an ART recording that deflects in a direction that is opposite of normal, which may be seen in stiffening pathologies such as otosclerosis, or a pulsing on the ART, which may be a result of a mass growing through the inferior wall of the tympanum (middle ear cavity). This paper will not cover these more advanced ART findings.
Figure 9. Middle ear pathology, right side. Note that anything that goes through the right ear or is measured in the right ear can be affected, depending on the severity of the pathology.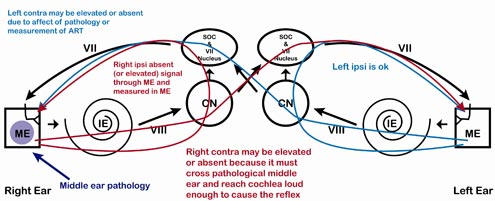
Table 5. Mild middle ear pathology, right ear. ART may be affected for signals traveling through the right ear (right ipsilateral, right contralateral) or signals measured in the right ear (right ipsilateral, left contralateral).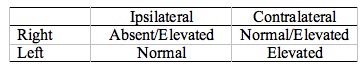
Table 6. Severe middle ear pathology, right ear. ART will be absent for signals traveling through the right ear and signals measured in the right ear. Left ipsilateral would be unaffected.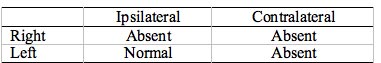
Intra-Axial Brainstem Pathology
This is the point when basic ART pattern interpretation is less straightforward. "Textbook" intra-axial brainstem pathology (Figure 10) causes missing contralateral reflexes and present ipsilateral reflexes (Table 7), but, as the saying goes, very few patients read the textbooks before coming into the clinic. This same pattern of missing contralateral reflexes can also be observed if you test ARTs using supra-aural earphone cushions for patients with bilateral collapsing ear canals; thus, be wary of this pattern in patients with unusually small or narrow, slit-shaped ear canals.
Figure 10. Small intra-axial brainstem pathology. A classical finding is missing contralateral responses, but this can also be seen with bilateral collapsing ear canals. One or both ipsilateral responses may also be missing, depending on the exact location.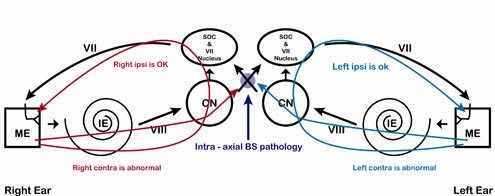
Table 7. Small intra-axial brainstem pathology (small). All contralateral ARTs are absent. All ipsilateral ARTs are present. This is a "textbook" pattern which will actually vary depending on the exact location and the structures that are compressed.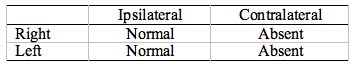
In actual practice, ARTs associated with intra-axial brainstem pathology will vary tremendously depending on exactly where the pathology is located and how large it is. As brainstem structures are very small, a small intra-axial pathology can cause pressure on a number of structures, causing ARTs to be affected on both sides. Figure 11 and Table 8 illustrate the ART results for a larger intra-axial pathology.
Figure 11. Larger intra-axial brainstem pathology. Depending on the location, size, and the extent to which surrounding structures are compressed, some or all of the responses will be absent. Due to the large number of nuclei located in the pons, other non-auditory neurological symptoms are also expected.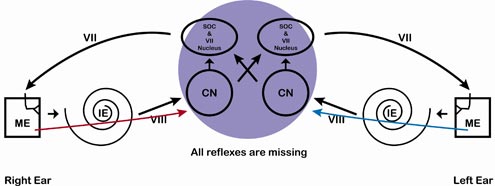
Table 8. Large intra-axial brainstem pathology. All ARTs are absent, but this is the least of this persons worries. Significant non-auditory neural symptoms are anticipated.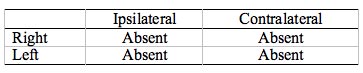
Extra-Axial Brainstem Pathology
Extra-axial brainstem pathology can result in a variety of ART patterns depending on the size and location of the lesion. The lesion may mimic a vestibulocochlear (VIII nerve) pathology or it could mimic an intra-axial pathology, or it could mimic facial nerve pathology or it may have a bizarre pattern depending on size and location. Note in Figure 12, that the ART pathway will depend on the location.
Figure 12. Extra-axial brainstem pathology may result in a myriad of ART patterns, depending on the size and location.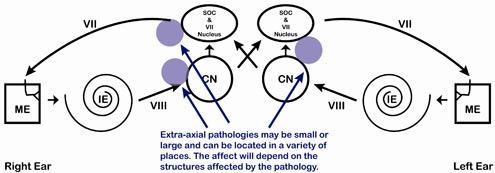
Problem Solving with ART Patterns
The following method can be used to teach ART interpretation to student clinicians. To determine the damaged pathway, have the student start with the ART model (Figure 1) and sketch in the pathways for ARTs that are normal. After obtaining an individual patient's ARTs, the pathology should be localized to the area that is not highlighted.
For example, examine the ART findings from Table 9a and 9b (note that you'll need to synthesize the results from the three frequencies, as in 9a, into one overall summary, as in 9b). Ask the student to determine where the pathology is located. Rather than recall memorized tables, have the student trace the pathway using the model in order to understand the pathways.
Table 9. (a) Example ART results for 500 - 2000 Hz and (b) Summary table.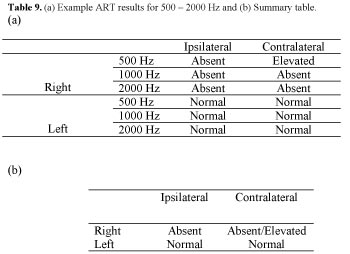
Figure 13. Example pathway traced on ART model. Note that any time the signal enters the left ear, the reflex is present and any time the signal enters the right ear, the signal is absent.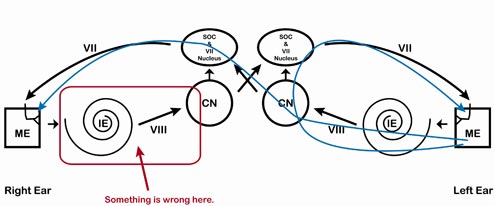
Point out to the student that as per Figure 13 the ARTs are missing whenever the signal goes into the right ear but present whenever the signal goes into the left ear. This is regardless of where the signal is measured. Therefore, ARTs indicate a problem along the right pathway somewhere. Further examination is required to determine the exact location along the right pathway. Ask the student to determine if the ART levels are consistent with cochlear or retrocochlear pathology based on published normative data. Point out that as clinicians, we need to combine findings from the entire audiological test battery to make appropriate recommendations for further testing, medical referrals, amplification, and so forth. Always keep in mind when both teaching ARTs and conducting ART testing, that ARTs are not meant to be used alone, but as part of a battery of tests to help in the evaluation process.
References
Emanuel, D.C. (2004, September/October). Probe ear or stimulus ear? How audiologists report contralateral acoustic reflex thresholds. Audiology Today, 36.
Gelfand, S. A., Schwander, T., & Silman, S. (1990). Acoustic Reflex Thresholds in Normal and Cochlear-Impaired Ears: Effects of no-response rates on 90th percentiles in a large sample. Journal of Speech and Hearing Disorders, 55, 198-205.
Hunter, L. L., Ries, D. T., Schlauch, R. S., Levine, S. C., & Ward, W. D. (1999). Safety and clinical performance of acoustic reflex tests. Ear & Hearing, 20, 506-514.
OSHA (1983). OSHA Instruction CPL 2-2.35, Nov. 9, 1983. Guidelines for Noise Enforcement. Occupational Safety and Health Administration, U.S. Department of Labor, Washington, DC.
Silman, S., & Gelfand, S. A. (1981). The relationship between magnitude of hearing loss and acoustic reflex threshold levels. Journal of Speech & Hearing Disorders, 46, 312-316.
Turner, R. G., Shepard, N.T., & Frazer, G. J. (1984). Clinical performance of audiological and related diagnostic tests. Ear & Hearing, 5, 187-194.
Wilson, R. H., & Margolis, R. H. (1999). Acoustic reflex measurements. In Musiek, F.E., & Rintlemann, W.F. (Eds.). Contemporary Perspectives in Hearing Assessment. Boston: Allyn & Bacon, 131-165.
Acoustic Reflex Threshold (ART) Patterns: An Interpretation Guide for Students and Supervisors
September 14, 2009
Continued and its subsidiaries provide professional education authored by qualified Subject Matter Experts for continuing education purposes. These materials are intended for educational purposes and do not constitute medical advice or a substitute for individual clinical judgment. Continued is not a clinical healthcare provider; the licensed professional is solely responsible for ensuring that the application of any techniques or information presented is within their legal scope of practice and jurisdictional requirements.

Related Courses
1
https://www.audiologyonline.com/audiology-ceus/course/innovation-in-hearing-healthcare-presented-37216
Innovation in Hearing Healthcare, presented in partnership with the National Acoustic Laboratories
Build your knowledge with this four-course series presented in partnership with the National Acoustic Laboratories (NAL). A world leader in hearing research and innovation, NAL shares applied research outcomes that are practical to a wide range of expertise, from clinical appointments to technology innovation. Maximize your skills and incorporate evidence-based research in your practice with these short, high-impact webinars designed to improve hearing healthcare.
auditory, textual, visual
129
USD
Subscription
Unlimited COURSE Access for $129/year
OnlineOnly
AudiologyOnline
www.audiologyonline.com
Innovation in Hearing Healthcare, presented in partnership with the National Acoustic Laboratories
Build your knowledge with this four-course series presented in partnership with the National Acoustic Laboratories (NAL). A world leader in hearing research and innovation, NAL shares applied research outcomes that are practical to a wide range of expertise, from clinical appointments to technology innovation. Maximize your skills and incorporate evidence-based research in your practice with these short, high-impact webinars designed to improve hearing healthcare.
37216
Online
PT240M
Innovation in Hearing Healthcare, presented in partnership with the National Acoustic Laboratories
Presented by Brent Edwards, PhD, Vicky Zhang, PhD, Joaquin Tomas Valderrama-Valenzuela, PhD, Simon Alperstein, MSc BE, Paola Incerti, MAudiology, AAudA, Jorge Mejia, PhD, Nicky Chong-White, PhD
Course: #37216Level: Intermediate4 Hours
AAA/0.4 Intermediate; ACAud inc HAASA/4.0; AHIP/4.0; BAA/4.0; CAA/4.0; Calif. SLPAB/4.0; IACET/0.4; IHS/4.0; Kansas, LTS-S0035/4.0; NZAS/3.0; SAC/4.0; Tier 1 (ABA Certificants)/0.4
Build your knowledge with this four-course series presented in partnership with the National Acoustic Laboratories (NAL). A world leader in hearing research and innovation, NAL shares applied research outcomes that are practical to a wide range of expertise, from clinical appointments to technology innovation. Maximize your skills and incorporate evidence-based research in your practice with these short, high-impact webinars designed to improve hearing healthcare.
2
https://www.audiologyonline.com/audiology-ceus/course/20q-update-on-cochlear-implants-38753
20Q: Update on Cochlear Implants: Hearing Preservation, Single-Sided Deafness, and Personalized Fitting
The course reviews new candidacy criteria for cochlear implantation, including when to consider referring for a cochlear implantation evaluation, considerations specific to new patient populations, and outcomes of cochlear implant use observed for these patient populations. The course also reviews the use of imaging to personalize the mapping of cochlear implant and electric-acoustic stimulation devices.
textual, visual
129
USD
Subscription
Unlimited COURSE Access for $129/year
OnlineOnly
AudiologyOnline
www.audiologyonline.com
20Q: Update on Cochlear Implants: Hearing Preservation, Single-Sided Deafness, and Personalized Fitting
The course reviews new candidacy criteria for cochlear implantation, including when to consider referring for a cochlear implantation evaluation, considerations specific to new patient populations, and outcomes of cochlear implant use observed for these patient populations. The course also reviews the use of imaging to personalize the mapping of cochlear implant and electric-acoustic stimulation devices.
38753
Online
PT120M
20Q: Update on Cochlear Implants: Hearing Preservation, Single-Sided Deafness, and Personalized Fitting
Presented by Margaret Dillon, AuD, PhD, CCC-A
Course: #38753Level: Intermediate2 Hours
AAA/0.2 Intermediate; ACAud inc HAASA/2.0; AHIP/2.0; ASHA/0.2 Intermediate, Professional; BAA/2.0; CAA/2.0; Calif. SLPAB/2.0; IACET/0.2; IHS/2.0; Kansas, LTS-S0035/2.0; NZAS/2.0; SAC/2.0
The course reviews new candidacy criteria for cochlear implantation, including when to consider referring for a cochlear implantation evaluation, considerations specific to new patient populations, and outcomes of cochlear implant use observed for these patient populations. The course also reviews the use of imaging to personalize the mapping of cochlear implant and electric-acoustic stimulation devices.
3
https://www.audiologyonline.com/audiology-ceus/course/guidelines-for-determining-ci-candidacy-37498
Guidelines for Determining CI Candidacy, presented in partnership with the ACIA
Considerable variation exists across the medical and audiologic communities regarding determination of cochlear implant (CI) candidacy. While criteria exist from the FDA for children and adults and from CMS for Medicare beneficiaries, different clinics and even audiologists within the same clinic use varying protocols to determine CI candidacy in different age groups and also considering factors other than hearing status. To provide guidance on this topic, the ACI Alliance Board of Directors commissioned four papers to provide guidelines for candidacy for children and adults with bilateral hearing loss and those with single-sided deafness. Task forces were appointed to develop the guidelines with membership drawn from across the care continuum to include audiologists, surgeons, speech-language pathologists, and others involved in CI patient care. This course will review each of those four candidacy guidelines.
auditory, textual, visual
129
USD
Subscription
Unlimited COURSE Access for $129/year
OnlineOnly
AudiologyOnline
www.audiologyonline.com
Guidelines for Determining CI Candidacy, presented in partnership with the ACIA
Considerable variation exists across the medical and audiologic communities regarding determination of cochlear implant (CI) candidacy. While criteria exist from the FDA for children and adults and from CMS for Medicare beneficiaries, different clinics and even audiologists within the same clinic use varying protocols to determine CI candidacy in different age groups and also considering factors other than hearing status. To provide guidance on this topic, the ACI Alliance Board of Directors commissioned four papers to provide guidelines for candidacy for children and adults with bilateral hearing loss and those with single-sided deafness. Task forces were appointed to develop the guidelines with membership drawn from across the care continuum to include audiologists, surgeons, speech-language pathologists, and others involved in CI patient care. This course will review each of those four candidacy guidelines.
37498
Online
PT240M
Guidelines for Determining CI Candidacy, presented in partnership with the ACIA
Presented by Sandra Prentiss, PhD, CCC-A, Daniel Zeitler, MD, FACS, Donna L. Sorkin, MA, Andrea Warner-Czyz, PhD, Margaret Dillon, AuD, CCC-A, Matthew Carlson, MD, Lisa Park, AuD, CCC-A, Nancy Young, MD
Course: #37498Level: Intermediate4 Hours
AAA/0.4 Intermediate; ACAud inc HAASA/4.0; AHIP/4.0; ASHA/0.4 Intermediate, Professional; BAA/4.0; CAA/4.0; Calif. SLPAB/4.0; IACET/0.4; IHS/4.0; Kansas, LTS-S0035/4.0; NZAS/3.0; SAC/4.0; Tier 1 (ABA Certificants)/0.4
Considerable variation exists across the medical and audiologic communities regarding determination of cochlear implant (CI) candidacy. While criteria exist from the FDA for children and adults and from CMS for Medicare beneficiaries, different clinics and even audiologists within the same clinic use varying protocols to determine CI candidacy in different age groups and also considering factors other than hearing status. To provide guidance on this topic, the ACI Alliance Board of Directors commissioned four papers to provide guidelines for candidacy for children and adults with bilateral hearing loss and those with single-sided deafness. Task forces were appointed to develop the guidelines with membership drawn from across the care continuum to include audiologists, surgeons, speech-language pathologists, and others involved in CI patient care. This course will review each of those four candidacy guidelines.
4
https://www.audiologyonline.com/audiology-ceus/course/20q-extended-high-frequency-hearing-37590
20Q: Extended High Frequency Hearing Loss - Translating Science into Clinical Practice
Hearing impairment in the extended high frequencies (EHFs) can occur in the presence of a normal audiogram. This 20Q reviews the current knowledge on EHF hearing impairment and the usefulness of EHF audiometry in the clinic.
textual, visual
129
USD
Subscription
Unlimited COURSE Access for $129/year
OnlineOnly
AudiologyOnline
www.audiologyonline.com
20Q: Extended High Frequency Hearing Loss - Translating Science into Clinical Practice
Hearing impairment in the extended high frequencies (EHFs) can occur in the presence of a normal audiogram. This 20Q reviews the current knowledge on EHF hearing impairment and the usefulness of EHF audiometry in the clinic.
37590
Online
PT60M
20Q: Extended High Frequency Hearing Loss - Translating Science into Clinical Practice
Presented by Srikanta Mishra, PhD, CCC-A
Course: #37590Level: Intermediate1 Hour
AAA/0.1 Intermediate; ACAud inc HAASA/1.0; AHIP/1.0; ASHA/0.1 Intermediate, Professional; BAA/1.0; CAA/1.0; Calif. SLPAB/1.0; IACET/0.1; IHS/1.0; Kansas, LTS-S0035/1.0; NZAS/1.0; SAC/1.0
Hearing impairment in the extended high frequencies (EHFs) can occur in the presence of a normal audiogram. This 20Q reviews the current knowledge on EHF hearing impairment and the usefulness of EHF audiometry in the clinic.
5
https://www.audiologyonline.com/audiology-ceus/course/ci-considerations-in-single-sided-39647
CI Considerations in Single Sided Deafness, in partnership with American Cochlear Implant Alliance
This two-part series covers considerations in the cochlear implant (CI) evaluation process, including outcomes, benefits, and quality of life for those with single-sided deafness (SSD). Both the adult and pediatric populations are discussed. A background on how CI utilization and perspectives for CI in SSD have changed and expanded in recent years are covered.
auditory, textual, visual
129
USD
Subscription
Unlimited COURSE Access for $129/year
OnlineOnly
AudiologyOnline
www.audiologyonline.com
CI Considerations in Single Sided Deafness, in partnership with American Cochlear Implant Alliance
This two-part series covers considerations in the cochlear implant (CI) evaluation process, including outcomes, benefits, and quality of life for those with single-sided deafness (SSD). Both the adult and pediatric populations are discussed. A background on how CI utilization and perspectives for CI in SSD have changed and expanded in recent years are covered.
39647
Online
PT120M
CI Considerations in Single Sided Deafness, in partnership with American Cochlear Implant Alliance
Presented by Allison M. Biever, AuD, CCC-A, Lisa Park, AuD, CCC-A
Course: #39647Level: Intermediate2 Hours
AAA/0.2 Intermediate; ACAud inc HAASA/2.0; AHIP/2.0; ASHA/0.2 Intermediate, Professional; BAA/2.0; CAA/2.0; Calif. SLPAB/2.0; IACET/0.2; IHS/2.0; Kansas, LTS-S0035/2.0; NZAS/2.0; SAC/2.0
This two-part series covers considerations in the cochlear implant (CI) evaluation process, including outcomes, benefits, and quality of life for those with single-sided deafness (SSD). Both the adult and pediatric populations are discussed. A background on how CI utilization and perspectives for CI in SSD have changed and expanded in recent years are covered.