
Audiologists are the "custodians" or "curators" of the ear. It is audiologists whose job it is to walk with the knowledge of how the ear works for the purposes of rehabilitation;namely, to counsel and educate patients, caregivers and even sometimes physicians during clinical encounters. Audiologists are taught the specifics of the cochlea and its physiology. This is their strength, or at least it ought to be. Can audiologists elucidate and enunciate the basis for daily common clinical encounters? This paper will examine a few:
- What exactly is the occlusion effect, and why does it occur?
- What does the outer ear and canal offer to the understanding of speech?
- Why do mammals have middle ears?
- If the middle ear makes up 33 dB, why can a conductive hearing loss be more than that?
- Why are hearing thresholds in dB Sound Pressure Level (SPL) shaped as a curve?
- Why does Carhart's Notch appear with otosclerosis?
- Why do we have acoustic reflexes anyway?
- Why do high frequencies stimulate the base of the cochlea and low frequencies stimulate the apex?
- Why does noise induced hearing loss (NIHL) drop at 4000 Hz and improve at 8000 Hz?
- Why does Meniere's disease often initially present with a rising audiogram?
- How does the asymmetrical traveling wave shape show itself with cochlear dead spots?
- The Dichotic Digit Test - Does it Test What Audiologists Say it Tests?
- What does the outer ear and canal offer to the understanding of speech?
The lay definition of the occlusion effect is that one's own voice sounds louder when one's ear is plugged. This is why hearing aids have vents. A more explicit reason for the occlusion effect is that low-frequency bone conducted sounds are louder for the plugged ear. Back in graduate school, audiologists learned that mass dominates the resonances in the lower frequencies and stiffness dominates in the higher frequencies. The lows resonate the mass of the skull, which in turn vibrates the osseus and cartilaginous portions of the ear canal. When the ear is plugged, this low-frequency energy is not allowed to escape (Figure 1). It has nowhere else to go but through the middle ear and into the cochlea;hence, the occlusion effect.
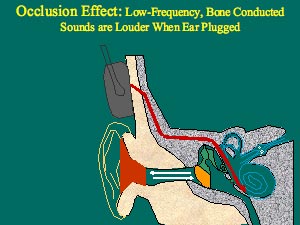
Figure 1.Low-frequency bone conducted sounds resonate the mass of the skull (gray color), which in turn vibrates the osseus and cartilaginous portions of the outer ear canal (beige color). This resonance normally escapes the open ear canal. When occluded (red color), the low frequency energy cannot escape, and so it is forced toward the cochlea, which results in a louder perception of sound when the ear is plugged. Figure created by the author.
Think about how your voice sounds on a recording. You are the only one who says the voice sounds terrible;everyone else thinks it sounds just like you. The reason is because you hear your own voice through bone and air conduction at the same time, while others hear you only via air conduction. When listening to your own voice on a recording, you are hearing yourself as others hear you - through air conduction alone. When you hear yourself talking, you are getting many more low-frequency sounds;the low frequencies of the voice are by far the loudest portion of speech. It is these lows that cause the skull to resonate, and it these lows that are heard most loudly when we experience the occlusion effect. Try experimenting with your own voice. Say "s" while repeatedly plugging and unplugging your ear. Now try the same thing while saying a lower frequency sound like "mmm." You should notice a robust effect with the "mmm" but not with the "s".
Some doctors swear by their tuning forks, right? Well, here's a good reason why: they are fantastic at delineating the type of hearing loss one might have, as opposed to the degree. The Bing tuning fork test is one based on the occlusion effect. Dr. Albert Bing (1844-1922) compared the sound of a low-frequency tuning fork held against the mastoid bone while the outer ear canal was repeatedly plugged and unplugged. The sound was louder when the ear was plugged. With conductive hearing loss, the occlusion effect is diminished and so also, the Bing test shows a less robust effect. Plugging the ear still blocks the low frequency bone conducted sound from escaping, but the middle ear pathology prevents the blocked sound from passing through the middle ear and going on to the cochlea. The Bing test can be done with tuning forks or simply by using one's own voice. Just have someone with suspected middle ear pathology (especially unilateral) say "mmm" while plugging and unplugging his/her good ear;then have the person do the same with the problem ear. The occlusion effect will be less noticeable for the affected ear.
What Does Ear Canal Resonance Offer to the Understanding of Speech?
Look at the combined resonances offered by the outer ear canal and the concha (Figure 2).
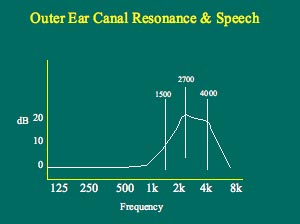
Figure 2. Note how the open adult ear canal has a resonance between 1500 and 4000 Hz. The peak occurs at about 2700 Hz. Note also that the "gain" offered by the unoccluded open ear canal and concha is on the order of about 15-20 dB. These frequencies are most important for discerning what the word was. During real-ear measures, the resonance at the very high frequencies will only be evident when the probe tube is inserted to within 5-6 mm of the eardrum. Figure created by the author.
These resonances might be the reason for the odd shape of the outer ear. It is well known that the most important frequencies for understanding speech lie roughly between 1000 - 4000Hz. Consider these resonances as well as the typical result of a real ear unaided ear canal resonance (REUR) measure. Note the peak at 2700Hz and the surrounding resonances between 1500 and 4000Hz. The outer ear creates an added 15-20 dB gain for these all-important speech sounds. The connection between speech and hearing here is unmistakable. The shape of the adult REUR also has a lot to do with the shape of NIHL, but more on that later.
Why Do Mammals Have Middle Ears?
Recall that where the footplate of the stapes sits inside the oval window, the cochlea is filled with perilymph fluid in the scala vestibuli. Most of the pressure of sound waves carried through air bounces off fluids. Imagine your head under water in a swimming pool. If I were standing on the edge of the pool talking to you, chances are you'd not hear a word. This is because fluid is much denser in composition than air. As a result, almost all of the sound will bounce off the surface of the water. Something has to help airborne sound "puncture" or penetrate the fluid-filled cochlea, and that is purpose of the middle ear.
The middle ear increases the pressure of incoming sound in three ways: the size of the eardrum relative to that of the stapes, the leverage action of the ossicular chain, and the buckling action of the eardrum or tympanic membrane (TM). The TM has 17 times the useful surface area as the footplate of the stapes (Figure 3). Recall that pressure is force over an area;when sound pressure upon the relatively large area of the TM is converged upon the much smaller stapes footplate, the pressure is therefore increased by a factor of 17:1.
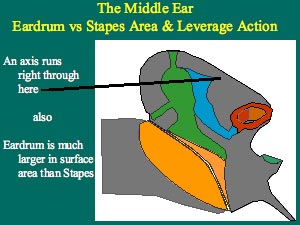
Figure 3. The middle ear increases the pressure of incoming sound, mainly due to the larger size of the eardrum relative to that of the stapes. A secondary manner in which the pressure is increased is due to the leverage action of the ossicular chain. Note how the manubrium of the malleus is slightly longer than the long process of the incus. The fulcrum is the straight line running through the head of the malleus and the short process of the incus. Figure created by the author.
Why are the three middle ear ossicles twisted about so strangely? This is to provide the leverage action that also serves to further increase the pressure by a factor of 1.3:1. Note on Figure 3 that the length of the manubrium of the malleus is about 1.3 times the length of the long process of the incus.
Lastly, the buckling action of the TM serves to increase the pressure of incoming sound upon it by a factor of 2:1 (Figure 4). The movement of the TM surface varies between the annulus (outer ring) and umbo (center where the manubrium of the malleus ends), and the areas in between. This is what is meant by the buckling action of the TM.
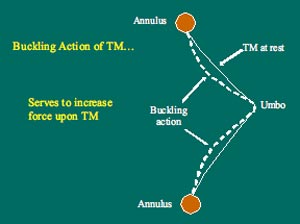
Figure 4. An illustration can best show the eardrum buckling action contribution of the middle ear. The TM is held fast by its outer ring, the annulus, and so it cannot be displaced there at all. The movement of the TM is least at the umbo, and greatest in the areas between the umbo and annulus. Less displacement at the umbo means more force at the umbo. This buckling action increases pressure by a factor of 2:1. Figure created by the author.
The impact of all these sound pressure increases in the middle ear can be determined by multiplying the factors together: 17 x 1.3 x 2 = about 44:1. How does this correlate to decibels (dBs)? Recall from hearing science that the decibel is based on logarithms. A 10:1 sound pressure increase corresponds to a 20 dB increase. A 100:1 pressure increase is a 40 dB increase;a 1000:1 pressure increase corresponds to a 60 dB increase, and so on. Accordingly, a 44:1 pressure increase would correspond to somewhere between a 20 and a 40 dB increase. Actually, the middle ear offers an increase of close to 30-33 dB.
If the Middle Ear Makes up 33 dB, Why Can a Conductive Hearing Loss be More than That?
All clinicians have encountered flat conductive hearing losses of 50-60 dB HL. When the oval window is pushed inward, the round window bulges. If, however, the round window were prevented from bulging outward, the oval window would be hard pressed to push inward, because cochlear perilymph fluid does not compress so easily. What kinds of middle ear pathology might prevent the oval and round windows from being pushed in and out? Otitis media might, because complete fluid build-up in the middle ear space would prevent the round window from bulging outward. Otosclerosis might also prevent the oval window from being pushed inward. Without oval/round window actions, the maximum degree of conductive hearing loss can well surpass the 33 dB that the middle ear adds to incoming sounds.
Dr. Heinrich Rinne (1819-1868) was the author of another tuning fork test that some ENTs rely upon. The Rinne test is based upon the dB increase offered by the middle ear. Rinne noted that when the tuning fork is held first against the mastoid bone and then held near the outer ear, it is normally the sound of the tuning fork held near the outer ear that is heard loudest. In other words, hearing by air conduction, which involves the outer and middle ears as well as the inner ear, is a much more efficient way to hear than hearing by simple bone conduction. This should occur for both those with normal hearing and those with SNHL. A healthy middle ear makes up 33 dB, and the Rinne test is a simple and eloquent demonstration of this increase.
Why Are Hearing Thresholds in dB Sound Pressure Level (SPL) Shaped as a Curve?
The dB increases offered by the middle ear have been detailed, but these increases are different for different frequencies. It works well to describe these increases in terms of "transfer functions." Transfer functions describe the differences between power spectrum for input sounds as compared to output sounds. To find the transfer function for the outer ear, one might measure the power spectrum for some input sound, and then measure the power spectrum for sounds at the TM. The difference between these input and output spectra would be the transfer function of the outer ear (it actually looks a lot like the resonance shown in Figure 2). Simply put, the transfer function of the outer ear shows the increases or decreases in dB SPL, as a function of frequency. The same thing can be done for the middle ear;the power spectrum for some input sound at the TM can be measured first, and then measure the same for the sound at the footplate of the stapes. In this instance, the transfer function of the middle ear shows the increases or decreases in dB SPL, as a function of frequency. The transfer functions of the outer and middle ears combined together form the curve of human hearing threshold, as shown in Figure 5. At quiet inputs, the ear is by far the most sensitive to frequencies between 500 to 4000 Hz. Normal human hearing thresholds actually require relatively more decibels in sound pressure level (SPL) at 125 Hz and at 8000 Hz. Thresholds of 0 dB HL, across the seven audiometric octave frequencies, therefore represent very different SPLs.
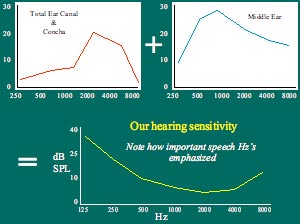
Figure 5. . Note how the transfer function for the outer ear (top left) and middle ear (top right) together contribute to the equal loudness curve (bottom). This curve actually represents the sensitivity of one ear under a headphone;it is 0 dB HL on the audiogram. The total outer ear canal and concha resonance (T) on the top right panel contributes some 15-20 dB of gain. The middle ear ossicular chain resonates at about 2000 Hz, and the middle ear cavity itself has two resonances, 900 and 1100 Hz;hence, the transfer function seen on the top left. Figure created by the author.
Why Does Carhart's Notch Appear with Otosclerosis?
The term sclerosis means "hardening." Otosclerosis is actually a growth of porous, soft bone tissue around the oval window and stapes. Therefore, some have deemed the pathology otospongiosis. A decrease in bone conduction thresholds, mostly at 2000 Hz, is commonly noted as a trademark for this pathology (Figure 6).
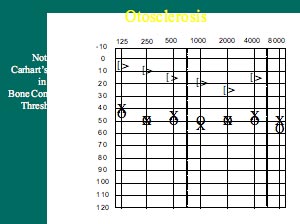
Figure 6. Carhart's Notch is evident as a drop in bone conduction thresholds. This is not an indication of hair cell damage;it is an artifact of the way bone conduction is tested. Compromises of both inertial and osseotympanic contributions to normal bone conduction occur with otosclerosis. The drop in bone scores is most pronounced at 2000 Hz, which is also the resonance of the middle ear ossicles. Figure created by the author.
Carhart's notch is actually a mechanical artifact of bone conduction testing. The notch does not truly represent a drop in cochlear sensitivity at 2000 Hz. Carhart noticed this phenomenon in the 1950s. Otosclerosis changes the contributions of the ossicular chain to bone conduction testing. There are actually three elements that contribute to normal, 0 dB HL bone conduction thresholds: 1) distortional bone conduction- hair cell stimulation caused by vibration of the skull with the bone oscillator, 2) inertial bone conduction- the tiny lag in ossicular chain movement when the skull is vibrating, and 3) osseotympanic bone conduction- the tiny vibration of the air column in the outer ear canal which can move the TM. With otosclerosis, due to the fixation of the stapes in the oval window, both inertial and osseotympanic bone conduction is compromised. The most obvious result of this is seen at 2000 Hz, which is the natural resonant frequency of the middle ear ossicles. Thus, Carhart's Notch does not represent cochlear hair cell damage at 2000 Hz.
Acoustic Reflexes: Why Do We Have Them?
Acoustic reflex (AR) testing used to be performed more frequently, yet there are compelling reasons to suggest why it should still be routinely performed today.
The brain-going parts of the AR arc are the outer and middle ears, the cochlea, the VIII nerve, and the low brain stem. The ear-going parts of the arc are the low brain stem, VII and V nerves, connecting to the stapedius and tensor tympani muscles of the middle ear, respectively. It is often taught that ARs are nature's own protection device against loud sounds. Loud incoming sounds tend to "set them off." However, ARs serve a more complicated purpose. ARs are most robust for low frequencies (500 and 1000 Hz). When the ARs contract, they attenuate or reduce the intensity of incoming low-frequency sounds by about 15 dB. This would mean ARs tend to reduce the upward spread of masking. They allow us to hear important high-frequency sounds by reducing the low-frequency sounds that would easily mask them.
What is little known about ARs is that they also occur while we talk;in fact, they occur approximately 50 milliseconds (1/20th of a second) before we begin to talk! Recall that in speech, it is the vowels that are loudest and lowest in frequency. It is therefore the vowel sounds that stimulate the AR when we speak. One plausible explanation is that the AR kicks in to enable us to hear high-frequency sounds while we speak!
ARs can also be thought of as a non-behavioral test of inner hair cells (IHCs). Otoacoustic emissions (OAEs) are a non-behavioral test of outer hair cells (OHCs). Normal IHCs and OHCs are shown in Figure 7.
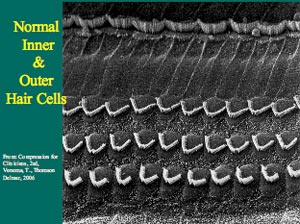
Figure 7. An electron microscope photograph shows normal healthy human IHCs and OHCs.
Damaged hair cells, especially OHCs, are shown in Figure 8. OHC damage often precedes IHC damage;furthermore, OHC damage often results in moderate sensorineural hearing loss (SNHL), while severe-profound SNHL is associated with both OHC and IHC damage. SNHL, however, does not necessarily always follow this route. There are widely different speech discrimination abilities for people who present with similar degrees of SNHL. For example, consider two people of similar age and similar linguistic abilities who have a similar 50 dB flat SNHL;one has good speech discrimination while the other has poor speech discrimination. Chances are the person with good speech discrimination will have ARs present, albeit at reduced sensation levels;the person with poor speech discrimination, however, will more than likely have absent ARs. All things being equal, IHCs are known to be responsible for poor speech discrimination. OHCs help IHCs to sense soft incoming sounds, but their damage will not normally result in as poor speech discrimination. Think of ARs and OAEs as excellent cross-checks;both are equally obliterated by middle ear pathology, as well.
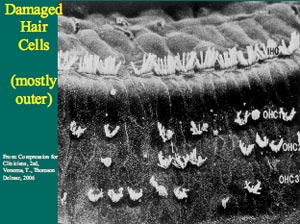
Figure 8. An electron microscope photograph shows damaged hair cells. Note that most damage is confined to the OHCs, as is typically the case.
Why Do High Frequencies Stimulate the Base of the Cochlea and Low Frequencies Stimulate the Apex?
The term cochlea is the anglicized form of the Greek word kochlias, which means "snail shell." Simply stated, the cochlea is responsible for changing fluid motion into electricity, and therefore is an incredibly complex organ. A little known fact today about Von Békésy, who contributed so much toward knowledge of the traveling wave, is that he won a Nobel Prize in 1961 for his research on the function of the cochlea.
Even Von Békésy, however, would not recognize the traveling wave as it is known today. He posited the "passive" traveling wave;namely, the dull rounded wave that occurs at unique places along the basilar membrane, according to the stimulus frequency. Today, it is common knowledge that high frequencies stimulate the basilar membrane near the base of the cochlea, and that low frequencies stimulate the basilar membrane near the apex of the cochlea. Not as well known, however, are the reasons why this occurs. Many believe that since high frequencies have relatively short sound waves, their ensuing traveling waves are also short, with peaks that occur near the basal "entrance" to the cochlea;accordingly, low frequencies have relatively long sound waves, and so their ensuing traveling waves are also longer, with peaks occurring further up along the basilar membrane. This concept is fundamentally false.
Sound waves in air have little in common with cochlear traveling waves. The basilar membrane, sandwiched between two sets of fluids, perilymph in the scala tympani and endolymph in the scala media, is the conveyer of all cochlear traveling waves. Consider that a 250 Hz tone has a wave about 1.5 meters (4.5 feet) in length. The entire length of the basilar membrane, however, is about 35 mm (just over an inch)! There is no way these lengths of airborne sound waves can enter the cochlea.
To understand how airborne sounds are represented in the fluid-filled cochlea, consider the physical properties of the basilar membrane. It is narrow at the base and wide at the apex of the cochlea. We actually have three rows of OHCs at the base of the cochlea, and five rows of OHCs at the apex of the cochlea. Recall that stiffness dominates in the higher frequency region and mass in the lower frequency region. High frequencies stimulate the base of the cochlea because the basilar membrane near the base has less mass and more stiffness. Low frequencies stimulate the apex because the basilar membrane there has more mass and it is more flaccid (Figure 9). These physical principles determine the specific places along the basilar membrane where the traveling waves will peak.
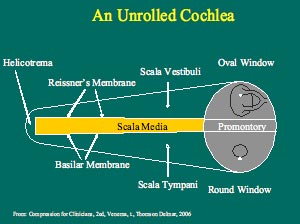
Figure 9. Note how the basilar membrane widens toward the apex of the cochlea. At the apex (left), the basilar membrane has more mass and less stiffness. At the base (right), the basilar membrane has less mass and more stiffness. It is the physical mass and stiffness qualities of the basilar membrane that determine the peak of the cochlear traveling wave. Figure created by the author.
The passive traveling wave was the one taught to audiology students in the 1980s. Knowledge of OAEs, however, served to flesh things out further, regarding the roles of the IHCs and OHCs. It is now known that the traveling wave also has an "active" component, where the traveling wave is amplified and also sharpened. These are the contributions of the OHCs (Figure 10). Their natural cochlear amplification of the wave enables us to hear soft sounds below the levels of conversational speech. Their sharpening of the wave enables us to distinguish among frequencies that are close together.
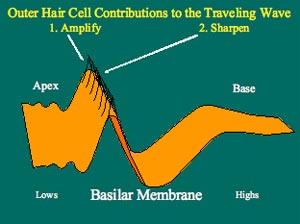
Figure 10. The dull, rounded traveling wave occurs with outer hair cell damage. First, soft sounds are no longer audible;second, the resolution required to separate or distinguish among frequencies close together is diminished. Outer hair cells tend to die first (not always), resulting in a moderate degree of SNHL. This degree is consistent with presbycusis. Figure created by the author.
People with OHC damage most often have poorer frequency resolution, or a reduced ability to distinguish between frequencies that are close together. No wonder people who wear hearing aids commonly report difficulty when listening to speech in background noise (Figure 11)!
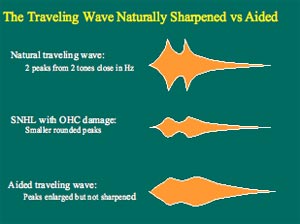
Figure 11. Outer hair cell damage removes the "active" component of the normal traveling waves that might occur with two stimuli close together in frequency. The middle panel shows traveling waves with reduced amplification and sharpness. The bottom panel shows what happened to the middle wave with amplification. Note that the amplitude is restored, but not the sharpness. Figure created by the author.
Recall that those with IHC damage tend to have remarkably poor speech recognition or discrimination abilities. Recall also, that the cochlea transduces fluid motion into electricity;it is the IHCs which primarily are responsible for this operation. Damage to IHCs generally follows OHC damage, but it can also occur at the same time. No MRI can detect the ratio of IHC to OHC damage in a living person;it is up to the audiologist to discern potential types of hair cell damage with speech testing, speech-in-noise testing, ARs and OAEs.
Why does Noise-Induced Hearing Loss (NIHL) Drop at 4000 Hz and Improve at 8000 Hz?
The audiometric configuration of NIHL (Figure 12) is unique and a good diagnostic indicator of this pathology. There have been several reasons offered as to why this configuration occurs. One such reason is that the AR is most robust for low frequencies, and so low frequencies tend to be most protected. The noise presented by the shooting of a gun, however, happens faster than the reaction time of the AR, and so the damage would seem to be done before the AR occurs. Poorer blood supply to the 4000 Hz region of hair cells is also given as a reason why NIHL is most pronounced at 4000 Hz. Another reason proposed is that the vector of the stapes footplate motion creates a particular fluid motion in the cochlea with consequent negative effects on the hair cells within the 4000 Hz region of the cochlea. The most eloquent reason for the peculiar shape of NIHL, however, is the complimentary shape of the outer ear canal and concha resonances, previously referred to as REUR. Noise tends to damage hair cells approximately a half-octave higher than the frequency of the noise spectrum. Since REUR adds 15-20 dB of gain to incoming sounds, then the noise spectrum is constantly filtered through the REUR. The peak seen at 2700 Hz can simply be pushed upwards half an octave, to about 4000 Hz!
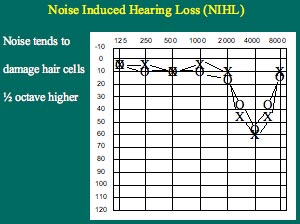
Figure 12.NIHL has a shape that looks like the typical REUR flipped upside-down, and shifted to the right about half an octave. Figure created by the author.
Why Does Meniere's Disease Typically Present with a Rising Audiogram?
There is a reason for the rising audiogram commonly encountered with Meniere's disease, especially at its early stages. True Meniere's is associated with an excess of endolymph fluid inside the scala media of the cochlea. The membranous boundaries or walls of the scala media are the basilar membrane and Reissner's membrane. These separate the scala media from the scala vestibuli and the scala tympani.
Recall that the basilar membrane is actually narrower and stiffer at the base of the cochlea, and that it is wider with more mass and also more flaccid at the apex of the cochlea. An excess of fluid build-up inside the scala media will tend to bulge its membranous walls. It is at the apex of the cochlea where the excess pressure of endolymph will make its mark and become most evident. The resultant mechanical interruption, due to the excess endolymph pressure, will mostly affect the low frequency hair cells. This is why Meniere's disease is associated with a rising reverse audiogram (Figure 13).
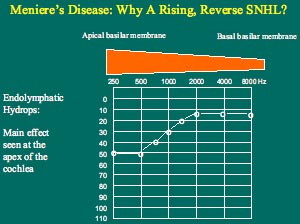
Figure 13. . The basilar membrane at the apex of the cochlea (low audiometric frequencies) is wider and has more mass, but is more flaccid than at the base of the cochlea (high audiometric frequencies). An excess of endolymph fluid pressure will bulge the basilar membrane mostly at the apex. This bulging will mechanically compromise the traveling wave motion and hair cell excitation mostly at the apex, causing a low frequency SNHL. Figure created by the author.
How Does the Asymmetrical Traveling Wave Shape Show Itself With Cochlear Dead Spots?
The traveling wave shown in Figure 10 has an asymmetrical shape. Its peak is closer to the steep front of the wave than it is to the more shallow tail. Note also that the steep peak always faces the apex (low frequencies). Figure 14 also shows the asymmetrical shape of the traveling wave envelope. A loud rumbling of a truck will easily mask the soft chirping of a canary, but a loud chirping of a canary will be hard pressed to mask the soft rumbling of a truck. Loud, low-frequency stimulation creates a traveling wave with a large peak near the apex, and a shallow tail sloping toward the base, whereas the soft chirp of a canary will make a small traveling wave with a peak confined near the base. The shallow tail of the asymmetrical traveling wave produced by the loud truck will cover the traveling wave produced by the soft chirping of a canary. This is why low-frequency background noise can easily mask soft high frequency consonants of speech. Loud high-frequency sounds, however, may very well make larger traveling wave peaks with higher amplitudes, but the steep wave front of these waves still remain fairly confined to the base of the cochlea. This is why loud high-frequency sounds do not so easily mask soft low-frequency sounds. This phenomenon is known as the 'upward' spread of masking.
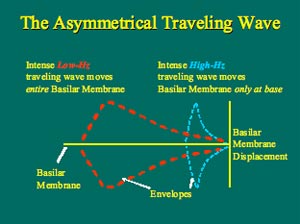
Figure 14. The traveling wave envelopes are shown for a low frequency tone stimulus (red) and a high frequency tone stimulus (blue). Both waves here are equal in amplitude. A soft high-frequency tone will produce a traveling wave that will fit inside of the envelope of the low-frequency traveling wave envelope. A soft low-frequency tone, however, will produce a traveling wave that will not fit inside the high-frequency traveling wave envelope. This is why lows mask highs better than highs mask lows. Figure created by the author.
The asymmetrical traveling wave also has implications for audiometry in general. In the presence of normal high-frequency hearing, a profound low-frequency hearing loss will present as a moderate reverse-slope, or rising, audiogram. Imagine intense low-frequency stimulation into a completely dead low-frequency hair cell region along the basilar membrane;this will produce a traveling wave with a large amplitude peak in the dead hair cell region, but the shallow tail of the same envelope will easily extend into the living mid-frequency hair cell region along the same basilar membrane. Mid-frequency hair cells will become excited, and the person will raise his/her hand indicating he/she heard the tone.
In the presence of normal low-frequency hearing, a profound high-frequency hearing loss might present as a steep, precipitously dropping audiogram. The high-frequency hearing loss, however, will be severe in degree. To appreciate why, imagine intense high-frequency stimulation into a completely dead high-frequency hair cell region along the basilar membrane. This will produce a traveling wave with a large amplitude peak in the dead high-frequency region. In this case, however, only a tiny piece of the steep front of the same envelope can extend into the normal mid-frequency region along the same basilar membrane. With stimulation of progressively higher frequencies, the peak of the traveling wave occurs further and further inside the dead hair cell region. Due to the steep shape of the front of the traveling wave envelope, dramatic increases of high-frequency stimulation are required in order for the steep front to extend into the healthy mid-frequency hair cell regions. This is the reason why high-frequency cochlear dead spots are associated with severe precipitous audiograms.
Implications for amplification are obvious;amplify moderate reverse and severe precipitous audiograms with care. Applying a lot of output into dead areas will not do much to rehabilitate the client. Clinicians might do well to amplify the transitions of these audiograms, not the worst thresholds. As the old saying goes, "one can help the dying, but not the dead".
The Dichotic Digit Test;Does It Test What Audiologists Say it Tests?
The last clinical encounter examined in this paper can be considered listening, as opposed to hearing. Children today, more often boys, may present in audiology clinics with diagnoses of attention deficit hyperactivity disorders (ADHD), attention deficit disorders (ADD), learning disabilities (LD), or central auditory processing dysfunction (CAPD).
Consider the testing audiologists do for diagnosing CAPD. Speech-in-noise tests are really examining cortical abilities of the student to tune out unnecessary auditory stimuli and to focus on the signal (speech) delivered from the teacher. Binaural fusion tests examine the low brain stem, where auditory messages from each ear mix together, as the pathways from each ear decussate (cross) from side to side. Dichotic listening tests tend to show the separation of the right and left hemispheres of the brain, and the integrity of the bridge that links them together, namely, the corpus callosum (Figure 15). Of all the types of testing for CAPD, dichotic listening tests are the most intriguing, because they have a demonstrable neurological locus, and because they show effects of maturation and also of gender. The latter two aspects are highly relevant to children in schools.
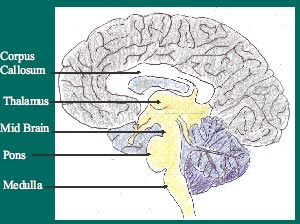
Figure 15. The lower part of the brain shown here is a sagittal slice. The corpus callosum is shown at the top, while some other auditory areas are shown below. Note that corpus callosum is white in color, meaning that it is highly myelinated with fatty tissue. This is necessary for good neural transmissions between the hemispheres. The corpus callosum is thought to be very involved in dichotic listening. Figure created by the author.
Dichotic listening involves the simultaneous presentation of different stimuli to both ears. The most commonly used dichotic test is the Dichotic Digits Test (Musiek, 1983), where numbers between one and ten are used (with the exception of the number seven, as it is the only digit having two syllables). The interpretation of dichotic testing is based on two major assumptions: 1) the left hemisphere of the brain is usually dominant for the representation of speech and language, and 2) with dichotic stimulation, contralateral pathways from the ears to the opposite hemispheres suppress the ipsilateral pathways from the ears to the same hemispheres. In most adults, there is a slight right ear advantage (REA). This would occur because the path from the right ear goes contralaterally to the dominant left hemisphere. In some children (especially boys), there is often a strong REA. The right ear does well for the same reason as most adults. The poor left ear performance is interpreted as follows: information presented to the left ear goes contralaterally to the non-dominant right hemisphere, and then has to cross the corpus callosum to get to the dominant left hemisphere. The pathway here is more convoluted and has more synapses (Figure 16). A poorly or incompletely developed corpus callosum in these boys is sometimes posited as the reason for the REA.
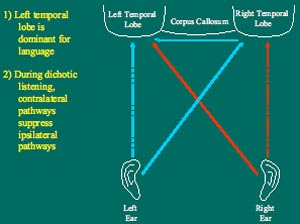
Figure 16. . The solid lines show the contralateral pathways from the ears to the dominant left hemisphere during dichotic listening. The red lines indicate pathways from the right ear, and the blue lines indicate pathways from the left ear. The dotted lines show the ipsilateral pathways that are suppressed during dichotic listening. Note that the left ear has a longer, more convoluted route to the dominant left hemisphere because it must go through the corpus callosum. Figure created by the author.
Some believe males tend to have a smaller and less myelinated corpus callosum than do females. Some would say this is why women can multi-task better than men. However, there is not a great amount of evidence to prove this physiological difference between males and females. On the other hand, some researchers take the position that a less-developed corpus callosum allows the right non-language dominant hemisphere to develop unchecked by the left hemisphere. They would say this is why males can detect moving objects in space better than females.
The challenge for all those interpreting tests of CAPD is to separate true performance from attention during performance. Are those who do more poorly on tests of CAPD simply not paying as much attention? Then again, if attention can be ruled out, can one improve performance with practice? Some would argue that this indeed can occur. Another question to consider is whether, in this case, we are testing gender rather than true CAPD.
Summary
It is the job of audiologists to elucidate and explain how the ear works for the purposes of rehabilitation. The specifics of the cochlea anatomy and physiology, and how its complex inner workings translate into clinical phenomena, are part of audiologists' education. That knowledge - and ability to communicate that knowledge during clinical activities - is audiologists' best marketing tool to patients, their caregivers and physicians.
References
Musiek, F.E. (1983). Assessment of central auditory dysfunction: The dichotic digit test revisited. Ear and Hearing, 4, 79-83.
Venema, T.H. (2006). Compression for Clinicians (2nd edition). NY: Thomson Delmar Learning.
