
To register to view the recorded course, click here. The handout for the recorded course contains several tables and figures that may be helpful for readers of this text course. The handout can be downloaded The handout can be downloaded here (PDF - slides) and here (PDF - article)..
In the first part of this series, we discussed why we even bother performing and using loudness discomfort levels (LDLs) in clinical practice. We talked considerably about the number of people who have trouble with loudness and are not satisfied with the way their hearing aids handle sounds. Several research articles and data were presented suggesting that loudness testing is likely not used as much as it could be, or from my personal standpoint, as much as I think it should be.
Intuitively, it would seem that if we put a little bit more effort into getting the output right, hearing aid users would be happier. While you can read the extent of the research on this topic Part 1, it is worth reminding you of the 2001 study published by Bentler and Cooley. They measured individual LDLs and plotted them to show the variance across ears, with a regression line to indicate the average. If you wanted to be conservative and not stray from the average more than 5 dB, according to Bentler and Cooley (2001), only 32 percent of the all people would be fit even somewhat appropriately. This is what is meant when we say "predicting from the audiogram." This study exemplifies why it can be risky business to predict a patient's LDL based on his or her pure tone thresholds.
One common method audiologists have used for years is letting the manufacturer's fitting software decide the maximum output. In a recent study, we conducted some electroacoustic testing of maximum output for the premier hearing aids of the six leading manufacturers (Mueller, Bentler, & Wu, 2008). When using the same hearing loss (50 dB HL across all frequencies), we simply wanted to see what the manufacturer believed was the correct setting for the maximum output. First, without entering any LDLs, we found a large variability, up to 20 dB at 2,000 Hz, across the six manufacturers. It's hard to say which software was "right", but for a given patient, they couldn't all be right! It certainly is not uncommon that hearing aids are programmed without any frequency-specific LDLs entered. As a reminder, for programming purposes, we need frequency-specific LDLs. Speech LDLs are of little or no value (although puzzlingly popular).
We then wanted to know what happened when we actually entered a 90 dB LDL into the software for all key frequencies (Mueller, et al., 2008). Interestingly, there were two manufacturers in which nothing happened at all; a good thing to know if you use one of those two companies. In some of the hearing aids the measured output dropped by as much as 10 dB, and others dropped somewhere in between 0 and 10 dB.
Author's Comments: First, we used a 90 dB HL LDL because we believed that no matter whose data a manufacturer was using, 90 dB would not be considered "average" for someone with a 50 dB hearing loss. A second point—you might think that the two companies who "did nothing" when the 90 dB LDL was entered, were doing something wrong. But, consider that with the NAL-NL1 algorithm, LDLs are not used. So, if a given manufacturer was using the true NAL-NL1 algorithm as their default fit, then you wouldn't expect them to change anything.
Because we saw the changes for four of the six products when LDLs were entered, we then wondered if the actual measured output was really what was reflected on the software's fitting screen. In four of the six instruments, there was very good agreement. This included the two companies with no output changes when LDLs were entered—the software correctly told you that they did nothing. What was concerning, however, is that one-third of the manufacturers' hearing aids did not do what the fitting screen said it did. In one case, it showed that the OSPL90 decreased by 6 dB. In the second case, the output actually did go down, but the software said it did not change, and then in the last case the software said it changed by 13-14 dB, when in actuality it only changed a few dB. This is just one example of why you have to be the brains when it comes to selecting the output for your patients, not the computer.
The group from University of Western Ontario published a very similar article comparing software output differences for young children (Seewald, Mills, Bagatto, Scollie, & Moodie, 2008). Although the study was for infants, it actually agrees with findings on adults (Mueller, et al., 2008). One major point from their study centered on the simulated real-ear saturation response (RESR) from five different manufacturers. They found that around 3,000 Hz, the output might differ by as much as 30 dB for the very same hearing loss. The take-home message here is that there is a big difference among manufacturers, and of course, for a child this is even more critical than for adults.
These studies clearly show that simply using an "average defalut" for MPO selection can be risky, and doing some testing related to the maximum output of the hearing aid is necessary. My thought is that this testing should include the pre-testing of LDLs, verification with the probe-mic measures, clinical behavioral measures of loudness, and possibly some post-fitting questionnaires. The responsibility is ours to get the output right, which greatly increases the chances of patient benefit and satisfaction with hearing aids.
The main focus, therefore, of this article will be on the application of LDLs in hearing aid fittings: how to use the hearing level (HL) LDL to make output adjustments; how to use automatic gain control (AGC) compression; probe-mic verification; behavioral measures; and self-assessment scales. If you have not yet read Part 1 of this series, I recommend taking the time to review that before proceeding with this discussion. Part 1 is available from Siemens both as an article and as a recorded course on AudiologyOnline.
Ready, Set, Go
Real-world applications for loudness requires some real-world calculations, so let's review some terms we need to understand to make the math happen. First of all, the reference-equivalent sound pressure level (RETSPL) is actually what you have to add to your hearing level (HL) values to convert that number to 2-cc coupler (assuming the use of insert phones, which are calibrated in a 2-cc coupler). This connect the audiometer to the test box. The real-ear dial difference (REDD) is the difference between the HL value and ear-canal SPL. So in one case, we are converting to the coupler and in the other case we are going directly to ear-canal SPL.
So, if you simply want to go from HL to the 2-cc coupler, you add the RETSPL to the LDL . If you already have coupler values and want to go to the real ear, you add the real-ear-to-coupler difference (RECD). That is a very common thing to do with children so that you can predict the output in the ear. You predict the real ear maximum output by adding the RECD to the OSPL 90.
Now, if you want to go from HL to the real ear in SPL, you simply combine those two formulas: HL + RETSPL + RECD = RESPL. And when you add the RETSPL and the RECD, you actually get something called the REDD. So let's actually put it to practice. You have a patient with a downward-sloping hearing loss, and you just did earphone LDLs at 500 and 3000 Hz using 2-dB steps, and you found that a Number 7 on the Cox Loudness Scale (Cox, Alexander, Taylor, & Gray, 1997) was 102 dB for 500 Hz, and 108 dB for 3000 Hz. You need to know where to set the ACGo, so you have to convert these values to be compatible with 2-cc coupler measurements, as that is the way the kneepoints are displayed in the fitting software. You need to add the RETSPL.
Remember that the RETSPL correlates with the way the audiometer and transducers were calibrated. You can obtain the RETSPL for different transducers, assuming your audiometer is calibrated accordingly, from the ANSI S3.6-1996 standard. In this particular example, the RETSPL is 6 dB at 500 Hz and 2.5 at 3,000 Hz. So, to try to convince you that this math is not too overwhelming, simply take the HL LDL, which was 102 at 500Hz, and add the RETSPL, which was 6, for a total of 108 dB in the 2-cc coupler. Do the same for 3,000 Hz. Take 108 + 2.5 = 110.5 or 111 dB.
How well is this going to work? Some might think these numbers will be too loud because we used a #7 rating on the loudness scale, which is "uncomfortably loud" rather than a #6 (loud, but okay). One argument is that we really do not want to set a hearing aid's maximum loudness at "uncomfortable" so the MPO should be lowered just a bit. But, the other argument is that these LDLs are based on pure tones, which will drive the hearing aid to it's highest MPO. The MPO will not be as high for inputs such as speech or noise. It depends on if you want to program the hearing aid for the average-case scenario or the worst-case scenario. Either way, this method puts us in a much better position to know what is happening in the real ear, which should get us very close to that +/- 5-dB window of acceptance.
Now that you have those LDL values converted to 2-cc coupler sitting in front of you, it's time to program the hearing aid. You will first want to adjust the MPO, which is controlled by the AGCo kneepoints for most instruments. To start, you will want to know the maximum output of the hearing aid you are working with, as with some manufactures the adjustments are relative, not absolute. This can be found on the manufacturer's specification sheet. Let's say you have a particular hearing aid with a maximum output of 108 dB, and you wanted it set at 102 dB. You would simply pull down the output -6 dB. In the example we just finished, we wanted it to be around 110 dB. If the output is already 108, you would just want to make sure the program software was set all the way to maximum output. What you are really accounting for here is that the MPO is set at or slightly below the patient's LDL (which you've converted to 2-cc coupler).
A Little About Compression
Let's back up a little bit and talk more about compression and how you can use it to get the output right. It is known that listeners with normal hearing have a wide dynamic range that accounts easily for soft inputs up through intense sounds. It is also well known that individuals with cochlear hearing loss have a much smaller dynamic range, which makes it difficult to distinguish between different levels of intensity when amplification is applied. This is one of the things for which amplification tries to account through compression. High-level compression (AGCo) works well to limit loud sounds, but with linear gain adjusted so that soft sounds are audible, average-to-loud inputs are then all "stacked" at the top, just below the LDL. An 85 dB SPL speech signal might only be 1 or 2 dB louder than a 75 dB SPL speech input signal. This accomplishes keeping loud sounds comfortable, but it can make the world sound "muffled" and less dynamic and exciting. Wide dynamic range compression (WDRC), however, can be used to repackage soft, medium and loud sounds equally into the patient's residual dynamic range. You still use AGCo to control the maximum output for loud sounds.
Geting To Know VIOLA
The way you repackage speech into the patient's residual dynamic range is all related to the WDRC kneepoints and ratios that you use. A nice way to look at this is through software that Robyn Cox devised, called the Visual Input Output Locator Algorithm or VIOLA (pronounced like the woman's name, not the musical instrument). Information about the VIOLA software can be accessed through her Hearing Aid Research Laboratory Web site at www.ausp.memphis.edu/harl Once you are on the HARL main page, click on Clinical Applications, and then click on VIOLA. While the software is not available online, here you can find out how to obtain it for a very minimal cost. This software allows you to input the threshold and LDL data at various frequencies, and it will predict the intermediate intensity levels. The prediction feature uses the seven categories based on Robyn Cox's (1997) Contour Test and loudness scale.
Using this software provides complete loudness ratings with the comparable intensity level attached and allows for a more accurate and complete hearing aid fitting. You can create an input/output function in VIOLA to see the targets for soft, average, and loud speech according to the patient's LDL data. VIOLA will also convert LDLs to 2-cc coupler by automatically applying the RETSPL and displaying the adjusted numbers. VIOLA will help you to make the right adjustments for the upper limits of loudness for speech inputs using WCRC to control loudness through the compression kneepoints and ratios. You can change the kneepoints and ratios to mimic your favorite product if you like. If you play around a little with changing the patient's LDLs, you will see how a lower or higher LDL will alter your desired WDRC settings (because the residual dynamic range becomes smaller or bigger). Again, this illustrates why it's risky to use "average values" when making important fitting decisions.
The Treatment for "Things are Too Loud!"
What do you do when your new hearing aid user tells you that things are just "too loud?" This is not always a problem that is easy to solve. If at all possible, question the patient carefully to determine if it is soft, average or loud sounds that are too loud. For starters, there are cases where all sounds simply are too loud. One solution might be to turn down the overall gain. Keep in mind, however, that this will not lower the overall MPO, but it reduces the probability that the person would ever reach it. This would be the case where the patient does not have their own volume control to adjust these sounds themselves. If environmental sounds are too loud, then you really have to turn down the AGCo knee point. Going a step further, if environmental sounds such as door slamming are okay, but loud speech is too loud, then you know you need to work with the WDRC.
Author's Comments: Knowing when to start tweaking the WDRC because the patient says that loud sounds are too loud is always a tough call. In research I conducted with Catherine Palmer and Ruth Bentler a few years back, we found that when we had the patients judge the "annoyance" of traffic and dinner party noises, they rated the annoyance level of these sounds much higher when they were aided versus unaided, even though we carefully adjusted the WDRC and the MPO. Interestingly, when we had normal hearing young adults do the same ratings, their annoyance results were the same as the aided ratings of the hearing impaired. That is, the hearing impaired were performing just like "normal." So do you want to change things, or just let acclimatization run its due course?
When adjusting for loudness, the key thing is to know is when to go after which compression setting. If the person was complaining that loud speech was the problem, I would suggest going into the AGCi. If the patient is experiencing all kinds of various environmental noises that are bothersome like dogs barking and babies crying, AGCo would be the better route. Loud music, such as a concert, would fall into this category as well. However, music LDLs tend to be higher than everyday environmental sounds, so this rarely is a problem (goes back to the topics we discussed in Part 1 of this series). Many times, it is better to make a separate program for music with a higher ACGo, and keeping the AGCi fairly linear. For most products, these two systems act independently, meaning that you should be able to change one without affecting the other.
Authors Comments: With more and more hearing aids having multichannel AGCo, a common question is how do you know what channel of AGCo to adjust when a patient has a loudness issue? It sure helps if you have an idea of the spectrum of the input signal that is causing the problem. If you're having a slow Friday afternoon, collect some SPL measures of different noises that your patients have complained about. Look at the overall level, and determine where the peak is located. Yes—this could mean going into the backroom and checking out the flush of the toilet—hopefully no one will be watching. And you know, you don't need a hundred dollar piece of equipment to do this. There are some smart phone apps that work amazing well.
Probe-microphone Measures
Because we now will be talking about formulas relating to the real ear, let's quickly review. If you want to go from HL on the audiometer directly to the real ear SPL (RESPL), use the following formula: HL + RETSPL + RECD = RESPL. The (RETSPL + RECD) is termed the REDD, so: HL + REDD = RESPL. You could measure this difference directly, but this seldom is done (with insert earphone from audiometer and probe-mic also inserted). It is always best to measure the actual RECD, especially in cases of pediatric fittings. For adults, you can get fairly close by using a table of average RECD values.
As an example, let's say you just tested a patient and learned that his HL LDL is 100 dB at 2000 Hz. The RETSPL at 2000 Hz is 2.5 dB, and the average RECD for a person 8 years and older is 7 dB, according to a table of average RECD values. Plug that into our formula, and we have 100 + 2.5 + 7 = 109.5. This is that patient's LDL in ear canal SPL, which becomes the upper-limit target for your real ear MPO testing. Now, you do not really have to do all of this math yourself—your probe-mic equipment does it for you. But there is value in knowing where the numbers actually come from.
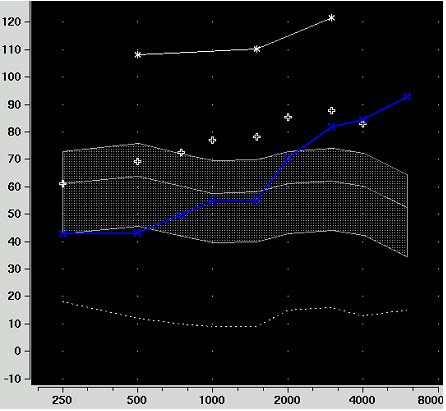
Figure 1. AudioScan Verifit screen shot with hearing thresholds (blue line) and LDL values (upper three dots) expressed in ear canal SPL.
When you input information into your probe-mic equipment, you should be able to see LDLs and thresholds in ear canal SPL. Figure 1 shows a typical screen shot from a Verifit system. The white line at the top is a graphed representation of LDLs and the blue line is the patient's thresholds in ear canal SPL. Now, using real speech, you would first verify the fitting for soft and average inputs (Figure 2). I'd suggest doing soft inputs first, and adjusting gain, not compression to obtain the best fit. Once the hearing aid output is meeting targets appropriately for these input levels, we move on to verifying loud speech using 75 dB SPL input. Finally, related to our discussion of MPO, we use a pure-tone sweep at 85 dB SPL.
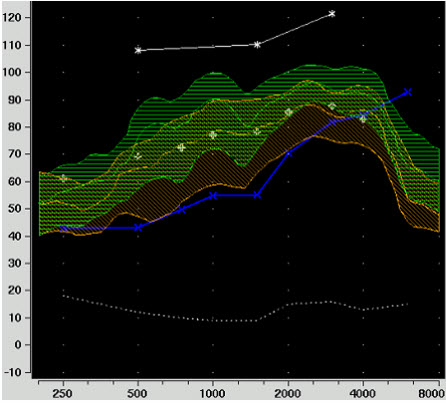
Figure 2. Soft (orange) and average (green) speech verification.
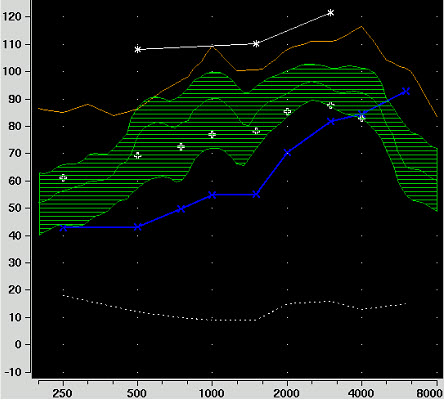
Figure 3. RESR (upper orange line) as measured with an 85 dB SPL pure-tone input.
Author's Comments: Some audiologists give the patient the Cox Contour loudness anchors while they are doing the probe-mic testing. In a perfect world, if the MPO on the screen falls below the LDLs, the patient should rate the signal a #6. Sometimes, the alert patient will shout out #7 and point to the screen and say "Right There." This of course is very helpful in knowing what channel of AGCo to adjust.
At the top of Figure 3, you can see where the RESR falls when an 85 dB SPL swept tone is introduced. What you are looking for is to see if this output falls under the patient's pure-tone LDLs. You see that there is a little peak at 1000 Hz, but the peak does not exceed the LDL. This may relate to how the AGCo was pre-set. Now you might say, "Is this RESR okay, or do I still have more work to do?" Well, there are some possibilities.
If you cannot get rid of the peak at 1000 Hz, then you really cannot raise the AGCo kneepoint, because things will then be uncomfortably loud and the patient will want to turn down the gain, which creates all kind of problems. If you can get rid of the peak, then the AGCo kneepoint could be raised by about 10 dB all the way across. You might think to add a little more AGCi compression at 1,000 Hz, which would then allow you to increase everything. But in the high frequencies, we might consider that it is not the AGCo that is limiting the output for that range; it could be the WDRC instead. If that is the case, raising the AGCo kneepoint as previously mentioned might not have any effect at all, because it would not be the AGCo that is limiting things at the top. But on the other hand, if we need that aggressive AGCi compression to match our 75 dB SPL speech inputs, then we probably should not change things, because while you are trying to solve one problem, you will just create a new one. It's easy to determine this, however, in about 15 seconds. Bump up the AGCo kneepoint by 5 dB and run another curve. If the RESR goes up, the AGCo is in control. If it doesn't, you know that the output is being limited by the WDRC.
The beauty of all this is that you will physically see what actually works when you are doing probe-mic measures. If you change one thing, you can run a curve to see what happened and then change something else and run another curve. This helps build your troubleshooting skills tremendously, and hopefully your patients will be impressed as well.
If you are fitting open products, keep in mind that there are also output problems for open products. You have to do the exact same kind of troubleshooting and maybe even more. If you keep all hearing aid setting constant, open fittings tend to have higher overall MPO than a closed fitting. This has to do with the residual ear-canal resonance that gets added onto the hearing aid output.
Verifying Output Using Aided Behavioral Measures
While the probe-mic verification will get you close, there also is an absolute need to conduct aided behavioral measures for loudness verification. Although you have accounted for these things using calculations and test-box verification measures, you never truly know how a person will respond until you ask them. Aided behavioral measures are a useful cross-check for several reasons:
Reason Number 1: There is something called monaural loudness summation, which is the difference between a tone and a broadband signal in a given ear. Much of our testing and hearing aid adjustments are based on pure-tone information. We know that there is summation for broad-band signals (speech), and this is accounted for in our calculations— for the average patient. But you know very well that not all patients are average!
Reason Number 2: There is also something called channel summation. Channel summation is the principle that the more channels you have in the hearing aid, the more the output can sum up. For example, let's say you delivered a flat 60 dB signal to a single-channel instrument. The WDRC would actually see 60 dB and apply that amount of gain; just say that was 20 dB. Now let's make this a 4-channel hearing aid, with 4 perfectly equal channels relative to the signal that is coming in. The signal is perfectly flat, and therefore it would now be re-categorized into four buckets instead of one bucket. So if you take this signal and you split it up into four buckets, you really would end up with 54 dB in each channel. Now, I know your second-grade math teacher might not agree that 54 + 54 + 54 + 54 = 60, but it is when you are adding dB. Now the WDRC applies gain for a 54 dB-per-channel input, not a 60 dB input. As you remember from your basic amplification class, WDRC applies more gain for softer inputs and less gain for louder inputs. So now for every channel, more than the 20 dB of gain that you programmed will be applied. In theory, rather than 20 it could be 22 or 23 dB, depending on what compression ratio you are using. All this extra gain for the four channels gets summed up, and the very simple bottom line is: the output is probably higher. The summing is greatest when the gain is equal, which is rarely the case in a real hearing aid fitting. For this reason, channel summation is very hard to predict, so the best way to find out about the effects of channel summation is to simply do behavioral testing with a broadband signal.
Author's Comments: Some prescriptive fitting approaches have attempted to account for channel summation, which gets rather messy when we now have products of 10, 20 or 30 channels. In general, it seems like the summation effect as not as great as we once thought it might be.
Reason Number 3: I'm sure you've heard of binaural summation. In this case, we know that when something is delivered to two ears, it is going to be perceived as louder. The research has not typically been performed with people using hearing aids, and it seems to be a little bit different with hearing aids, therefore there is no real consensus as to how much summation actually is present. However, there are theories. We know that summation around threshold is not very much, maybe 2 to 3 dB. We think that as the input increases, there is more summation. How much? It really seems to vary from person to person. Studies have shown very little to as much as 10 dB. Prescriptive fitting methods and the manufacturer's software usually try to account for this by using something around 3 to 5 dB.
Author's Comments: A common and very logical question is "If I'm doing a bilateral fitting, should I also do bilateral LDLs under earphones." The answer is probably not. It seems that even when a patient has loudness summation for loud sounds, their LDL for a bilateral signal is very similar to their LDL for a monaural one. If you read Part 1 of this series, you might recall that LDLs are related to sound quality. Sound quality is better for a bilateral signal, which seems to counter the summation effect, and you end up with pretty much the same LDL. If I'm wrong on this, you'll still get things right when you do your behavioral aided loudness testing.
Because of these three reasons, it's good to do some loudness testing, even if you did use the unaided LDLs to set the AGCo kneepoints. So what procedure is recommended for behavioral loudness verification? The general procedure I recommend is modeled after the 1994 IHAFF protocol:
- Seat the patient in either a sound booth or a quiet room and deliver continuous discourse in the soundfield.
- Provide the patient with the Cox Contour anchors.
- Conduct the testing in the bilateral aided condition.
- Use the 7-point loudness anchors from the Cox Contour Test (Cox, et al., 1997). Conduct loudness ratings of speech for soft (45 dB SPL), average (60-65 dB SPL) and loud (80-85 dB SPL) inputs. I'd repeat the 85-dB input a couple times, as it often takes the patient a while to "settle in" (especially the new user). You may need to emphasize the difference between "annoyingly loud" and "uncomfortably loud."
- If you are having difficulty or getting unexpected scores, you may have to do some individual ear identification.
It is equally important to perform an obnoxious noise test. If you recall from Part 1, there is a definite difference in the measured LDL of loud sporting-event applause and fingernails on a chalkboard. Clinically, we use informal obnoxious noises like the hand clap, the door slam, or the book drop. But there are better ways to do it.
Author's Comments: There are a couple ways to add some science to your obnoxious noise test. Since, at some point in your verification process you will have your patient sitting in front of a probe-mic system, use the noises stored in the equipment's software. This works especially well in that you will be able to measure the exact level of the signal at the patient's ear. A second method is to use the noise from the software of your manufacturer's fitting software. For this, you may have to pull out your sound level meter to assure that the noises are at the desired 85 dB SPL level. In both cases, you'll have the patients hooked up to the fitting software, so real-time changes are possible.
HONK If You Believe in Appropriate Hearing Aid Output
Dr Cox has provided us with a low-tech tool for conducting aided loudness measures. The HONK is an actual obnoxious noise kit that came out of Robyn Cox's HARL lab at Memphis (Cox, 2009a; 2009b). There are specific supplies in the HONK kit: one 12-ounce metal coffee can with 3 nuts and bolts inside, and 2 glass jars with 24 total glass marbles. With the plastic lid on, shake the coffee can with the hardware. Considerable lab measurements indicated this as a broadband noise around 80 dB SPL with peaks upwards of 100 dB. Take the two glass jars and toss the marbles back and forth between the jars to generate a high-frequency signal (you might want to practice this at home with adult supervision). This introduces a noise in the 5 to 10 kHz range, with peaks all the way up to 115 dB SPL. You would use both of these stimuli with the same loudness scale and ask your patient to rate the loudness levels. Because these are environmental sounds, any LDL problems would be handled by changing the MPO kneepoint (AGCo) rather than WDRC.
Verification of Output Using Self-Assessment Questionnaires
If you're following all this you can see that getting the output right is obviously a step-by-step process. We started with obtaining the earphone LDLs, then preprogramming the instruments, followed by probe-mic measures to ensure that the MPO was below the measured LDLs, and then we did behavioral testing in the clinic to take care of summation and stimuli effects. Hmm . . . this all sounds like fitting a hearing aid (as opposed to dispensing one)!
So what do we have left? The real world. It is certainly possible that things could be a little bit different in the real world than in your clinic. There might be certain noises outside of the clinic walls that are just too loud for them. Wouldn't it be nice to have a pal to help you determine if the patient is happy? Well, indeed, there is a PAL (Profile of Aided Loudness) out there (Palmer, Mueller, & Moriarty, 1999).
Finding A PAL?
The PAL consists of 12 questions that the patient ranks for loudness on the same Cox Contour #0 to #7 point scale. There are separate questions for soft, average, and loud sounds. The patient also lists how satisfied they are with that particular rating on a scale of 1 to 5, from not good at all to just right. For loud sounds, the patient will rank four different questions for sounds like door-slamming, dog barking, etc. After the patient rankings, you compare the correlation between the loudness ranking and their satisfaction. Ideally, the patient would rate the "loud sound" example a #6 for loudness (loud, but okay), with a satisfaction ranking just right.
A scenario which can be puzzling is when a patient ranks the loud questions at a #6, right where we would expect, but their satisfaction rating is down around a #3, which is just "okay." You might suspect that this is because they are not used to hearing things as loud, so consequently they are not satisfied even though you did your job correctly. Another possible outcome, which hopefully doesn't happen too often, is where the patient is ranking everything at #7 (uncomfortably loud), and satisfaction is at a #2 (not too good). This is an easy one, as you know it's time to start over. Go back and repeat some of your testing and reprogram if you have to, and send them back out again.
Author's Comments: For the PAL, there are only four questions related to loud sounds, and it's very possible that your patient won't hear all of them during the first few weeks of hearing aid use. The questions for loud were specifically chosen because they have good inter- and intra-subject reliability. It was very difficult to find loud sounds that met this criteria. You might be interested to know that the most consistent rating for #6 for all age groups was "horses galloping." That sound was rarely rated a #7 or a #5. So, if one of your patients frequents the race track, you know what question to ask (sorry, we did not ask about greyhounds galloping)!
The APHAB And Aversiveness
Another real-world validation measure is the Adult Profile of Hearing Aid Benefit (APHAB) (Cox & Alexander, 1995). The APHAB has 24 questions, with 6 questions assigned to each of the following categories: ease of communication, background noise, reverberation, and aversiveness. The later of which is very pertinent to this topic. Aversiveness is the annoyance from loud sounds. The questions related to aversiveness ask the patient about specific scenarios or loud sounds, with a rating for with and without hearing aids. You can compare how your patients score against the normative data from satisfied patients to see where they fall. It can help serve as a guide to where you need to reduce problems or provide additional counseling to the patient.
Author's Comments: Don't think you necessarily did something wrong if the aided aversiveness problems are worse than unaided. This is the expected finding. Except—they shouldn't be too much worse. Check out the norms.
In summary, when you are administering these real-world scales, it is very common that the patient has not experienced all the items on the list. Talk to them about loud sounds that they have heard and what was bothersome. Maybe a church bell ringing was bothersome, which is not an item on any list. It is possible, maybe even probable, that they will rank loudness worse with aided. If this is the case and everything is programmed and verified appropriately, that simply means you just need to sit down and have a chat with them, not necessarily change the programming. Continue to emphasize the difference between annoyance and uncomfortable. Whenever possible, try to compare their ratings with the satisfied hearing aid users or with people with normal hearing.
Author's Comments: A note regarding the patient complaint of annoyance from loud sounds when you know you have the hearing aids programmed correctly so that loud sounds are not uncomfortable. I used to send my hearing aid patients home with a large printout of the following statement: "You have to hear what you don't want to hear to know what you don't want to hear." I won't say it worked all the time, but it did save a couple fittings!
See? It's Not That Hard
Using LDLs to set individual output limits on amplification is not a daunting task. In fact, the short amount of time invested will likely result in fewer unhappy patients making follow-up visits for adjustments. There is a wealth of information and testing materials available to add this step to any fitting protocol. The steps are simple: measure ear-specific LDLs, convert HL LDLs to 2-cc coupler values, set the AGCo kneepoints to correspond to these values, verify output targets in the real-ear, perform behavioral measures, and follow-up with real-world self-assessment measures.
References
Bentler, R.A., & Cooley, L.J. (2001). An examination of several characteristics that affect the prediction of OSPL90 in hearing aids. Ear and Hearing, 22(1), 58-64.
Cox, R.M. (2009a). Verification and what to do until your probe-mic system arrives. The Hearing Journal, 62(9), 10, 12-14, 16.
Cox, R.M. (2009b). Verification and what to do until your probe-mic system arrives: the second of two parts. The Hearing Journal, 62(10), 10-14.
Cox, R.M., & Alexander, G.C. (1995). The abbreviated profile of hearing aid benefit. Ear and Hearing, 16(2), 176-186.
Cox, R.M., Alexander, G.C., Taylor, I.M., & Gray, G.A. (1997). The contour test of loudness perception. Ear and Hearing, 18(5), 388-400.
Mueller, H.G., Bentler, R.A., & Wu, Y. (2008). Prescribing maximum hearing aid output: Differences among manufacturers found. The Hearing Journal, 61(3), 30-36.
Palmer, C.V., Mueller, H.G., & Moriarty, M. (1999). Profile of aided loudness: a validation procedure. The Hearing Journal, 52(6), 34, 36, 40-42.
Seewald, R., Mills, J., Bagatto, M., Scollie, S., & Moodie, S. (2008). A comparison of manufacturer-specific prescriptive procedures for infants. The Hearing Journal, 61(11), 26, 28, 30, 32, 34.

