Learning Outcomes
After this course learners will be able to:
- Describe the need for, and procedures associated with conducting real-ear probe-microphone measures.
- Describe the times when aided soundfield testing might be necessary, and what are the possible pitfalls.
- Describe the origin, identification and treatment of the hearing aid occlusion effect.
- Describe three common self-assessment outcome measures, and the procedures for their administration.
Introduction
In Volume 6 (Part 1) of our QuickTakes Hearing Aid Fitting Toolbox, we reviewed different tests that need to be conducted prior to the actual fitting, providing some step-by-step guidelines for conducting the measures. We are now ready to sit down and do the hearing aid fitting itself. The core of this process is the verification of hearing aid gain and output to a validated prescriptive method—something that we also talked about back in QuickTakes Volume 3.5—but we’ll go into some practical issues this time around. We’ll also address a couple other factors related to verification, and then end with a section on real-world validation.
V6.5: Real-Ear Probe-Microphone Measures
To state the obvious, to verify something, there must be a gold standard that is used as the reference. We actually have several goals when we fit hearing aids, including good audibility, optimizing speech understanding, appropriate loudness, good sound quality, and a fitting that is acceptable to the average patient. Fortunately for us, smart people have put all these fitting goals into a pot, stirred them up, and created a reasonable blending that can be tailored to individual patients based on their hearing loss. Of course, we are referring to validated prescriptive fitting approaches, and today we have two, the NAL-NL2 and the DSLv5. And, by using the term validated, we are referring to evidence-based findings that the fitting method provides optimum levels of benefit and satisfaction for the average patient, which nearly always highly correlates to good audibility, sound quality, speech understanding and loudness restoration.
In the software from all hearing aid manufacturers, after the audiogram and LDLs have been entered, the hearing care provider (HCP) has the option of selecting the NAL-NL2 fitting algorithm, doing a couple mouse clicks, and “presto” the hearing aid is fitted to NAL-NL2 for that patient, right? Wrong! There are two reasons why this doesn’t work (Mueller, 2020):
Reason #1. Once a hearing aid company has licensed the NAL-NL2, they are allowed to make alternations, and can still call the algorithm “NAL-NL2.” What has been common practice over the years, therefore, is for most if not all manufacturers to alter the NAL algorithm to more closely resemble their proprietary fitting—that is, significant gain reduction in the higher frequencies, especially for soft inputs, beginning ~2000 Hz. It’s common that this reduction is 6-10 dB or more. Hence, while the fitting screen may show a “fit-to-NAL” it is not a fit to the real NAL, and it is unlikely that the patient will not experience the same degree of benefit.
Reason #2. The second reason why simply doing a mouse clinic on “NAL-NL2” doesn’t work, even if the manufacturer’s NAL was the true NAL, is that this results a fit for the average person, with the average coupling. The actual output in the real ear, however, will vary based on microphone location, the residual earcanal resonance, the residual volume in the ear canal (real ear coupler difference; RECD), and the openness/tightness of the coupling. The only alternative, therefore, to verify that the fitting is indeed to the NAL standard, is to conduct real-ear probe-microphone verification.
Probe-Mic Verification
The act of using a probe-microphone to assess hearing aid output in the earcanal is commonly called real-ear measures (REM, pronounced “RHEM”). It is also possible, however, to conduct aided measures in the soundfield, as we’ll talk about in the next section, which, the last time we checked involves “real ears,” so this also would be REM. To avoid confusion, therefore, we’ll use the term probe-mic measures, or PMM.
Today’s validated prescriptive fitting methods provide research-based earcanal SPL targets—we no longer think in terms of “gain,” which was common decades ago. The most commonly used method in the U.S., for adults, is the NAL-NL2, which is what we’ll use as the reference here. All the procedures we discuss, however, also apply to those of you who prefer to use the DSL fitting algorithm.
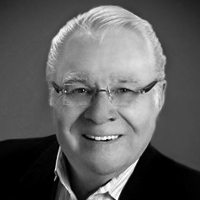
The goal of the fitting simply is to obtain a real-ear output that is reasonably close (+/- 5 dB) to that prescribed by these targets. This is accomplished with probe-microphone measures, using a real-speech input and earcanal SPL as the definitive measure, sometimes referred to as “speech mapping.” In Figure 1, a sample fitting screen is shown, which displays the patient’s thresholds, the fitting targets, the LDLs, the LTASS and the spectrum of the amplified speech signal (30th percentile to 99th percentile) (see Mueller et al, 2017, for review).
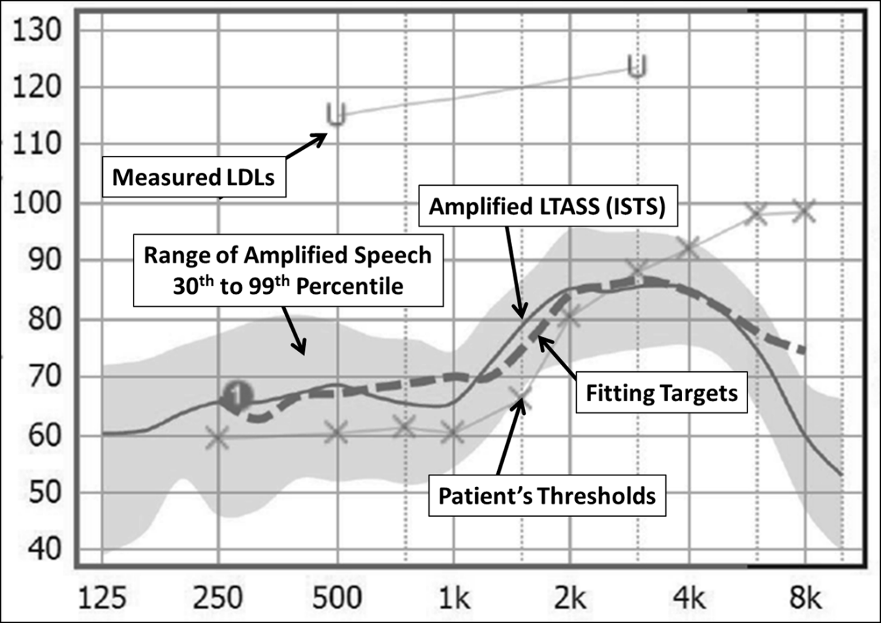
Figure 1. Typical probe-mic fitting screen showing patient’s thresholds and LDLs (converted to earcanal SPL), the prescriptive fitting target, the amplified LTASS and the spectrum of the input speech signal.
Probe-Mic Verification Procedures
- Enter patient’s audiogram and LDLs into software.
- Position the patient appropriately; should be seated 2-3 feet from loudspeaker at 0 degree horizontal and vertical azimuth.
- Place probe assembly on ear; probe tube should be inserted so that probe tip is within 5-mm of eardrum. Use the equipment’s automated probe fitting guide for correct placement, or if this is not available, place marker 30 mm from tip, insert probe, and then align marker with inter-tragal notch.
- If possible, conduct real-ear coupler difference (RECD) test. Enter the patient’s RECDs into the probe-mic fitting software.
- Place hearing aids on ear and pre-program to the manufacturer’s NAL-NL2 fitting. Note in the probe-mic software if this is an experienced or new user, a unilateral or bilateral fitting. Also select type of coupling (e.g., open vs. vented vs. closed).
- With most modern equipment, testing can be conducted bilaterally if desired.
- Select the appropriate calibrated speech-signal input. The most commonly used, available on all probe-mic equipment, is the international speech test signal (ISTS), which is what we recommend.
- Conduct verification by starting with the presentation of the 55 dB SPL input signal. Make programming adjustments until a satisfactory match to target is obtained.
- Following the programming for 55 dB SPL input, present the 75-dB SPL input signal. Continue programming until the output is at least within 5 dB at each frequency and has a general contour consistent with the targets.
- After the programming for the 75 dB SPL input, present the 65 dB SPL input signal. Given that this input is mid-way between 55 and 75, a close match to target is expected. Make minor adjustments as necessary, but keep in mind that these adjustments for 65 dB SPL could impact the output for the 75 dB SPL signal.
- Most probe-systems will calculate both SII values and rms error. Check these for each presentation level to ensure that they are within appropriate range.
- The final step is to conduct the REAR85 verification (the patient’s measured LDLs serve as the guidelines for this programing). A step-by-step for this real-ear verification was detailed in QuickTakes Volume 6.3 (Part 1).
The importance of this verification procedure cannot be emphasized enough. As an example, shown in Figure 2 on the left panel is the “automatic” programming of the hearing aid by the manufacturer’s software for a 65-dB input for a typical downward sloping hearing loss. Note that the LTASS falls below targets starting at 1500 Hz, is 12 dB below at 2000 Hz, and as much as much as 30 dB below for the higher frequencies! The right panel reveals that after a few minutes of programming, it was possible to provide the patient with the appropriate fitting.
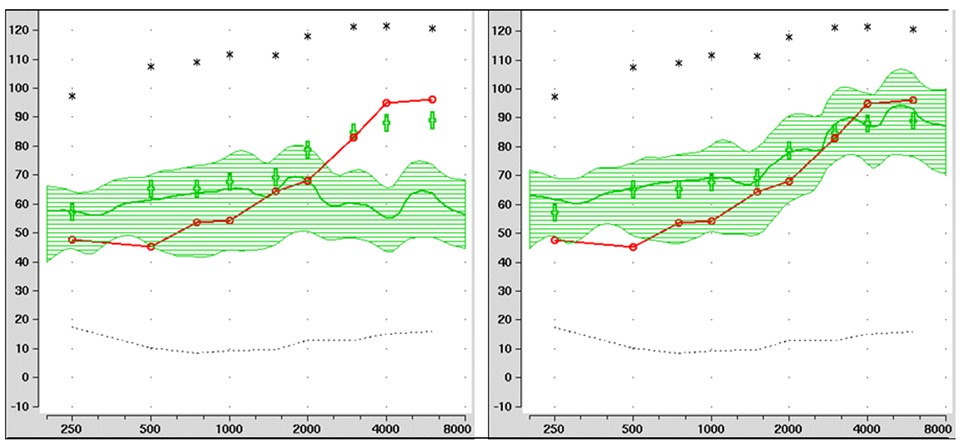
Figure 2. Example of a poorly-fit hearing aid (left panel) with limited audibility present, compared to the same hearing aid after re-programming, establishing good audibility through 6000 Hz (right panel). Figure courtesy of Dr. Lori Zitelli, University of Pittsburgh.
Scoring the Goodness of the Fitting
As we mentioned, many probe-mic systems now calculate the SII for the aided speech output for different inputs levels, and also, the RMS (root mean square) error for the match to the fitting target. We’ll talk a little more about both of these procedures.
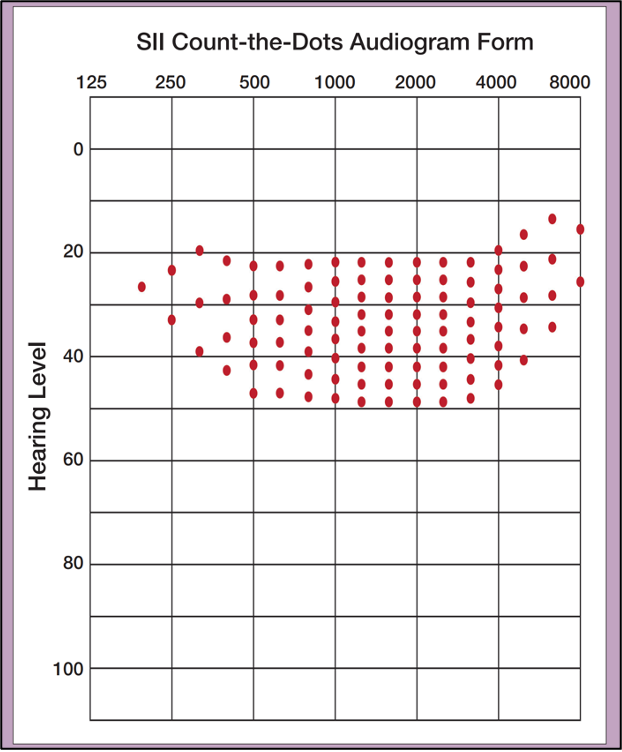
Speech Intelligibility Index. Methods to calculate the audibility of speech have been available since the 1940s—most notably the Articulation Index (AI), which in recent years has become the Speech Intelligibility Index (SII). A simplified clinical procedure also has been available for 30 years—a count-the-dot audiogram Mueller and Killion, 1990), which has been modified to agree with the SII calculations—See Appendix A for the most recent 2010 version (Killion and Mueller, 2010).
It is not the goal of the fitting to obtain an SII of 100% (i.e., 1.00), as this isn’t needed for good speech understanding. In general, for adults with a typical downward sloping mild-to-moderate hearing loss, for a 65 dB SPL input, we would be looking for an SII around .65 to .75 (for adults). As you would expect, as the input becomes softer, the “acceptable” SII becomes smaller. Also, the “acceptable” SII will become smaller as the degree of the hearing loss becomes larger, simply because of the limits of amplification. The rules are somewhat different for children, and charts are available which provide guidance for both children and adults (Dao et al, 2021; Bagatto et al, 2011).
Root Mean Square (RMS) Error. Regarding the RMS error, you can more or less think of it as the “average absolute dB error,” although the math will give you slight differences. If indeed you missed target by exactly 5 dB at each key frequency, then your RMS error would be 5 dB. Using the fitting goal of having an RMS error of 5 dB or smaller, however, does provide some forgiveness for missing target by more than 5 dB. For example, if your fitting error was 3 dB at 500 Hz, 1000 Hz, and 2000 Hz, but 8 dB at 4000 Hz, the RMS error would still be below 5.0 (4.7 dB). One, therefore, must still use some clinical reason. Consider that a fitting that had errors of 0 dB at 500 Hz, 1 dB at 1000 Hz, 2 dB at 2000 Hz, 10 dB at 3000 Hz, and 2 dB of 4000 Hz, would have a passing RMS error of 4.7, but most of us would not consider it a “passing fitting.”
Automatic Probe-Microphone Fitting
Today, most all major manufacturers have an arrangement with one or more probe-microphone manufacturer, where the software of the two systems talk to one another. Much of the fitting then becomes “automatic.” This is not new, and has been used for over 20 years, but it only recently has been adopted by a large number of manufacturers. Each hearing aid manufacturer and probe-microphone company tend to have their own name for it. We’ll call it autoREMfit. The purported advantage is that it makes the fitting more efficient (faster), and while not advertised, it also tends to allow someone less skilled the ability to do the fitting. Research has shown that when compared to an experienced clinician, the fitting indeed is slightly faster, and the fit to target, is almost as good (Mueller 2020, Mueller and Ricketts, 2018).
Too good to be true? The autoREMfit approach has become popular in some clinics in recent years. But the old adage “if it sounds too good to be true it probably is” might apply in this case (Mueller, 2018). A couple things to consider:
- Some autoREMfit procedures only fit to average inputs. Our observation has been that these fittings tend to “under-fit” for soft inputs. An example of this is shown in Figure 3. These are findings from 16 different patients who had been autoREMfit for the 65-dB SPL input. Note that on average, soft inputs are under-fit by ~10 dB. The HCP must then go into the software and “fix” the mistakes for soft inputs, which involves changing amplifier gain, which then will alter the autoREMfit match-to-target for average inputs. In effect, there would be no benefit of autoREMfit.
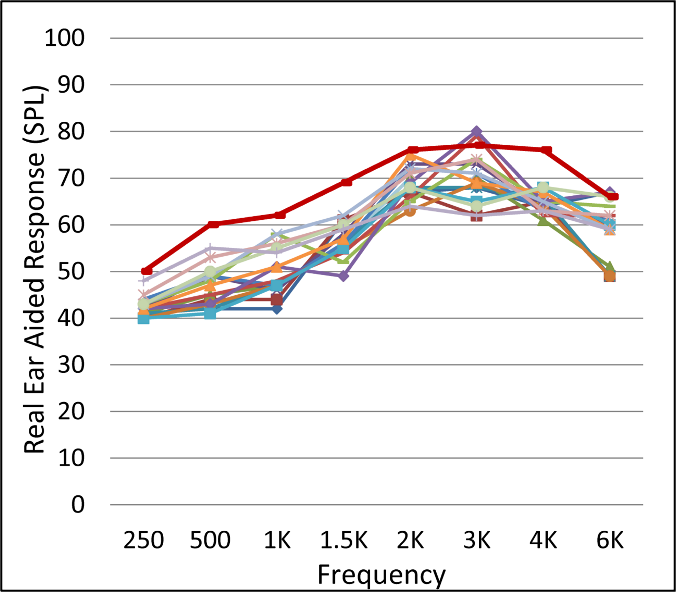
Figure 3. Example of output for soft-speech input for 16 different fittings, after autoREMfit for a 65-dB input. Upper dark red line represents the NAL-NL2 target for this soft-speech input (Mueller, 2020).
- Another concern involves whether the hearing aid software or the probe-mic software is controlling the fitting. As we discussed at the beginning of this article, in many cases, the manufacturer’s NAL algorithm is not the true NAL—the common alteration is less gain in the higher frequencies. If the hearing aid software is running the show, then what might appear as a fit to target, really isn’t.
Frequently Asked Questions
Q: I’ve heard that it’s best to let the patient use the hearing aids for a few weeks and then do probe-mic measures when they return for a follow-up appointment. Makes sense?
A: No. I guess that this approach is based on the assumption that some form of acclimatization is going to occur? Most acclimatization is for soft inputs, and the patient isn’t going to acclimatize to something that they can’t hear. Our thought is that you fit the patient with what is best for them from the beginning. Seems strange to send them out the door with something you know isn’t the best. And what if they come back in three weeks and say they love their “bad” fitting (which could happen). Are you going to change it?
Q: Is it okay to just verify for the 65-dB input?
A: Well, it’s better than not verifying at all, but skipping the other input levels can lead to serious mistakes. We know that most manufacturer’s default fitting is pretty linear, meaning that when you have average “just right” the programming is probably too soft for soft inputs (See Figure 3), and too loud for loud inputs. Moreover, for many patients, the audibility provided for soft inputs is the most important aspect of the fitting, so it’s something that we certainly want to get right.
Q: It seems like most patients prefer less gain than what is called for by the NAL-NL2 algorithm. Why is this?
A: We can’t really think of a good reason. The NAL-NL2 algorithm was based the average desired gain for nearly 200 hearing aid users. Hence, we would expect some to prefer less gain, but others to prefer more gain, and most (~60%) to be within the +/- 5 dB window of average. Recall that the desired gain/output is reduced for new users, and for bilateral fittings, so ensure that this is noted in your probe-mic equipment for these patients. Otherwise, it would “appear” that what they prefer is below target, as the targets would not be correct.
Q: Is it true that for all the special features to work, one must select the manufacturer’s proprietary algorithm?
A: First, given that considerable research has shown that performance is the best with the NAL-NL2 rather than a proprietary algorithm, one would assume that manufacturers would optimize their features for this setting. But, if you’re concerned, you could initially select the proprietary, and then still program the output to the NAL-NL2.
Q: There are charts showing the acceptable SII range for the DSL, but are there charts for the NAL too?
A: Good question. Most of the SII charts indeed have been based on DSL fittings (Dao et al, 2021). There are data, however, showing that for several different audiogram configurations, when fit to respective targets (for adults), for average inputs, the resulting SIIs for the DSL and the NAL are essentially identical, so you couldn’t get into too much trouble using the DSL guidelines when fitting to the NAL (Johnson & Dillon, 2011).
Q: Is there really evidence that using probe-mic measures to verify fitting algorithms really leads to better patient benefit and satisfaction?
A: Most certainly (See Mueller, 2020, or review). As we stated in a previous installment of QuickTakes, real-ear hearing aid verification should be embraced. It’s what we do better than anyone else. We own the ear canal! Verification to a validated algorithm is not only good for the patient, but good for our profession. Down the road, it just might be what separates us from Aisle 7 of the neighborhood pharmacy.
V6.6: Soundfield threshold measures
As we have reviewed, the preferred method of determining the real-ear gain and output of hearing aids is to conduct probe-microphone measures, which clearly is the gold standard (Mueller et al, 2021). These measures then can be used to ensure that validated prescriptive fitting targets are obtained. An alternative method, however, which can provide some limited information, is to conduct pure-tone testing in the soundfield. One option is to obtain both unaided and aided threshold measures, and calculate the difference, which will provide a “functional gain” value—which should be very similar to the insertion gain calculation (REIG) obtained with probe-mic equipment. Another option is to only conduct aided measures, which roughly can be used to estimate the degree of audibility for speech. All of these measures are fraught with factors that reduce the validity and reliability—which we will review—but there are some instances when they may be necessary. We’ll talk about both of them, starting with functional gain.
Functional Gain Measures
The popularity of gain-based prescriptive fitting began in the 1970s, fueled by the original NAL, and the publications of Lybarger (1/2 gain rule), McCandless (POGO) and Ken Berger (who traveled the U.S. conducting workshops on his method) (see review of early fitting methods in Ricketts et al, 2019). As clinicians gradually started abandoning the time-honored method of using speech testing to select the best hearing aid, they needed a replacement to go along with these new prescriptive approaches. Given that all these methods prescribed “gain,” soundfield functional gain measures was the logical verification strategy (probe-microphone insertion gain measures did not routinely become available until the mid-1980s; Mueller et al, 2017).
Reasons for Using Functional Gain
The efficiency, validity and reliability of probe-microphone measures are so much greater than functional gain, one might ask why we are still talking about it 40 years after probe-mic measures have been available? A reasonable question. Here are some possible answers:
- Current fitting of systems that deliver sound through bone conduction present a challenge to verification. The same challenge is present for cochlear and middle ear implants, as probe-microphone earcanal SPL assessment is not helpful. While some unique verification procedures are available, some HCPs might choose to verify these devices through functional gain or simply aided soundfield thresholds.
- There are cases when there is excessive cerumen in the earcanal that plugs the probe tip (preventing probe-mic measures), but does not occlude the canal, so threshold measures are probably valid. Best clinical practice would have this patient return for the probe-mic verification after an ear cleaning, but sometimes this isn’t possible.
- Some middle-ear pathologies and conditions cause probe-mic measures to be invalid, or not possible (e.g., large perforations, mastoid cavities, etc.). Functional gain may be the only alternative.
- Some federal government, state agencies and third-party payers will not accept probe-microphone data, and still require aided soundfield documentation before determining fitness for duty or approving funding. In such cases it might be necessary to conduct functional gain or at least aided thresholds. We would recommend, however, that this is conducted in addition to, not instead of probe-microphone verification of the fitting.
Measurement of Functional Gain
The measure of functional gain is quite simple (until one starts to consider potential pitfalls).
- The patient is first seated in an audiometric test booth, positioned at a calibrated location, usually one meter from a loudspeaker located at 0-degree azimuth.
- The patients are instructed to not lean forward or back, or turn their heads (although they nearly always do anyway).
- Masking is applied via earphone to the non-test ear. Simply putting an earplug in the non-test ear is not satisfactory.
- Using pulsed pure tones, thresholds are obtained for the key test frequencies (e.g., usually 250 Hz through 6000 Hz) using a conventional threshold determination procedure.
- Following this testing, the hearing aid is placed on the ear, presumably programmed to gain that approximates validated prescriptive targets. Threshold testing is repeated.
- The aided thresholds are subtracted from the unaided, and this value is the frequency-specific functional gain.
- These gain values are then compared to the prescribed gain values of the NAL-NL2 to determine if there is a match, and what programming changes are needed.
- Following the re-programming, the aided testing is repeated to determine if the desired gain has been obtained.
Understanding the Many Pitfalls
On the surface, functional gain testing sounds like a simple substitute for probe-mic insertion gain measures. In one respect, it is even simpler in that extra equipment is not required. There are many limitations with functional gain, however, which must be considered whenever this procedure is attempted, or when it is compared to insertion gain testing (see Ricketts et al, 2019). These limitations include:
- Eliminating the non-test ear: Most people being fitting with hearing aids have fairly symmetrical hearing loss, and therefore, whenever soundfield testing is conducted it is important to ensure that the non-test ear is eliminated.
- Room masking effects: Most of today’s hearing aids use low threshold compression, and provide the most gain for low-level inputs. One of these inputs, of course is the ambient noise of audiometric test rooms. This seemingly low-level background noise will be amplified by 30 to 40 dB in some cases, which possibly will then prevent the patient from hearing the target pure-tone signal for the aided testing.
- Low-level expansion: Nearly all hearing aids have low-level expansion, a circuit designed to reduce gain for low-level signals. If the patient only has a mild hearing loss, and aided thresholds are expected to be in the 20 dB HL range, the expansion circuit may reduce the input of these signals, which would make aided thresholds appear worse than they actually are.
- Input compression: Most of today’s hearing aids have WDRC with low kneepoints. Once the signal if above this kneepoint, it will be compressed. Hence, what is a 60 dB HL value on the audiometer dial, will be less than this value after signal processing—this will make thresholds appear worse than they really are.
- Gain information provided: With WDRC instruments, it is important to verify gain for a variety of inputs ranging from soft to loud. Functional gain (even when all contaminating variables are eliminated) only provides information for low-level inputs, as threshold measures are used. It is very difficult to interpolate gain for higher input levels with only this information.
- Frequency information provided: While it would be possible to conduct some type of frequency sweep and use a Bekesy-type tracking procedure for functional gain measurements, this isn’t done. Rather, only key frequencies are tested. Many important aspects of the hearing aid fitting involve peaks and dips in the gain and output, which often are not revealed with functional gain measures at discrete frequencies.
- Efficiency: Once the patient is set up, a probe-microphone assessment of gain can be accomplished in 10 seconds or so. During the hearing aid fitting process, it often is necessary to repeat this measure a dozen or more times as the frequency response and compression is tweaked to obtain the best fitting, and this happens for a family of input signal levels. It’s unlikely that either the haring care provider (HCP) or the patient would have the endurance for a dozen or more repeats of functional gain measures.
- The test-retest reliability for probe-mic measures is ~2 dmB. Reliability is considerably worse for functional gain. This is because of room calibration problems, room reflections, patient positioning, patient movements, threshold test procedures (5-dB steps), and other factors. Research has shown that for two different functional gain values to be significantly different at the .05 level, they would have to differ by more than 15 dB. Even at the conservative 0.2 level of confidence, critical differences are around 10 dB (Hawkins et al, 1987).
Aided Soundfield Thresholds
A component of functional gain testing is the aided soundfield thresholds. Some HCPs use these alone as a verification method, observing what portion of average speech has been made audible. See the example in Figure 4. This was for a TSA worker, whose employment required a soundfield aided audiogram. He was wearing a hearing aid which provided the aided thresholds shown in the lower audiogram, presumably the proprietary algorithm which we know underfits for soft inputs. The hearing aid was then programmed to prescriptive targets using probe-mic measures, and a follow-up aided soundfield audiogram was conducted, shown in the Figure as the upper plot. The aided findings now are providing audibility for the majority of the average speech signal (assuming everything was calibrated properly).
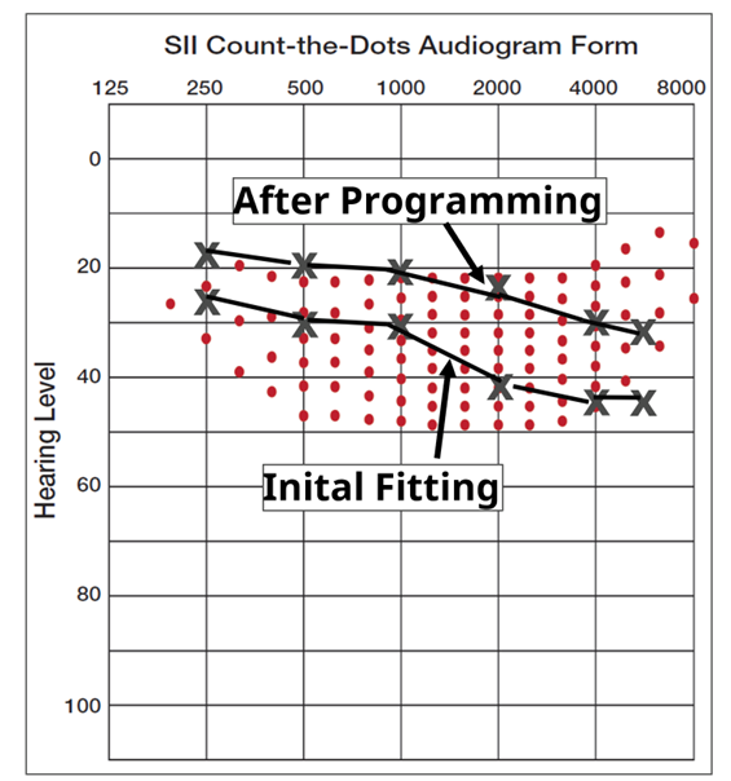
Figure 4. Example of aided soundfield testing for two conditions. The bottom audiogram is for the initial proprietary fitting, and the upper plot is following a fitting to prescriptive targets using probe-mic equipment.
Despite all the limitations, testing aided audibility in the soundfield has been especially popular over the years when evaluating pediatric patients. In some cases, this approach is used to determine the “best” product, by testing aided thresholds for different models from different manufacturers. The “winner” is the product that provides the best aided thresholds (e.g., a 10 dB aided threshold is considered better than a threshold of 20 dB). While on the surface, this thinking might seem reasonable, there can be a problem with applying this strategy. When the threshold numbers are this low, the measured threshold has little relevance to real-world hearing aid use because the world is not as quiet as an audiometric test booth. Ambient noise masks out low-level sounds; this happens for people with normal hearing and hearing aid users alike. The average quiet living room has an ambient noise level of 42 dBA, and most real-world situations have even higher levels of ambient noise. Hence, aided soundfield thresholds lower than these levels are probably not very meaningful in many real-world listening situations. The conversion from dBA to HL varies from frequency-to-frequency, but we can consider 20 dB HL roughly the cut-off value. That is, a hearing aid providing an aided soundfield threshold of 5 dB in a test both, would probably provide no more audibility in the real world than a hearing aid providing a 20 dB soundfield threshold. And, of course, all the pitfalls of functional gain testing, also apply the aided testing for audibility.
Frequently Asked Questions
Q: Is it okay to simply use the thresholds from the earphone testing for the calculation of functional gain?
A: No. While it might be a tempting time-saver to use the earphone thresholds as the unaided reference, this is risky practice, for a couple of reasons. First, it’s simply good science to use the same setting for the unaided and aided, so that all test conditions are the same; moreover, earphone thresholds were probably obtained at an earlier date and the patient’s hearing could have changed. Secondly, soundfield calibration may not match earphone calibration—in some clinics, differences are 10 dB or more between these presentation modes. If both measures, however, are taken in the soundfield, then these errors will not matter for functional gain calculations, as we are only looking at difference values (gain), not absolute thresholds.
Q: You mentioned that many of the special features of today’s hearing aids interfere with aided soundfield testing. Is it possible to turn them off?
A: Probably some of them. You could program the hearing aid to linear processing fairly easily. It might not be possible to turn off a feature like expansion, however, in many products. And of course, you are still going to have all the other pitfalls.
Q: I’ve typically used warble tones for soundfield measures. Is that okay?
A: Probably, but why? The patient is used to hearing pulsed tones from the initial audiologic testing, so we would recommend staying with this signal. In sharply-sloping hearing losses, it’s also possible that the frequency range of the warble could elicit a response from an area adjacent to the test frequency.
Q: Can I be fairly certain that the threshold I obtain in the soundfield is the patient’s true threshold?
A: Maybe, but there is a very good chance that 50 dB HL calibrated for your insert earphones is not 50 dB HL in your soundfield. As we mentioned, for functional gain, this isn’t too critical, but if you are only doing aided soundfield, then it is. In a survey of over 400 audiologists, the findings showed that while over 80% of the respondents conducted some type of soundfield testing, only a small percentage knew how the soundfield was calibrated. Moreover, the survey findings showed a lack of standardization among sound field test rooms, great diversity in the stimuli used for sound field testing, and inconsistent calibration methods (see Ricketts et al, 2019). The bottom line is, before conducting soundfield testing, conduct a careful calibration, with frequency-specific information.
Q: Is there some work-around when a government agency says that have to have aided thresholds?
A: Yes, there is. Probe-mic measures can give you values that are very close to what functional gain would reveal—maybe better. Set up your probe-mic equipment to conduct insertion gain, rather than the common REAR speech mapping. Program the hearing aid to desired NAL-NL2 targets—ensure that targets are met for soft inputs. Use the stored average REUG (do not measure) and then conduct the REAR (ISTS input) for a 50 dB input. The equipment will calculate insertion gain. Use these REIG values to correct the earphone audiogram to “predicted” aided audiogram (e.g., if the threshold was 50 dB at 2000 Hz, and the REIG was 30 dB at 2000 Hz, then the aided threshold would be predicted to be 20 dB). Some probe-mic equipment will do this conversion for you—an example is shown in Figure 5. We say “predicted,” but given all the pitfalls of aided soundfield testing, these predicted values are probably more valid than if actual threshold measures had been conducted.
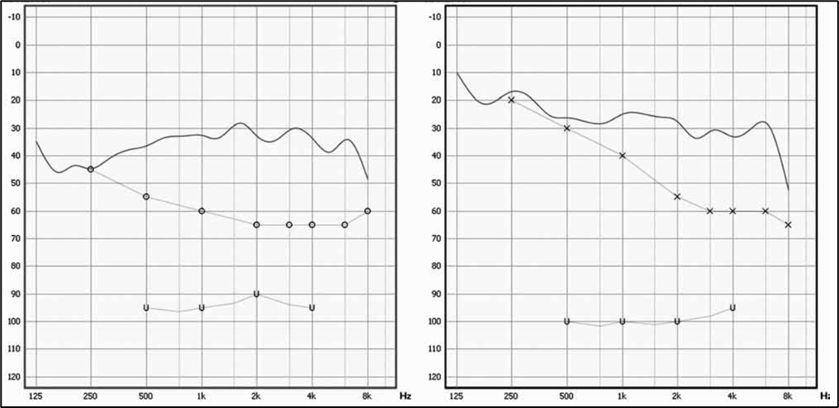
Figure 5. Example (right and left ear) of probe-mic equipment using the measured insertion gain, and then applying this gain to the unaided audiogram to construct a “predicted” aided audiogram.
V6.7: Identification and treatment of the hearing aid occlusion effect.
Now that we have finished the fitting, it’s time to talk about potential post-fitting problems. One of these is the hearing aid occlusion effect (OE). This is something that every hearing care provider (HCP) has experienced with a patient at one time or another. The sensation for the patient can be highly annoying and it is more likely to be annoying for patients having better than 30-40 dB HL thresholds in the lower frequencies. There are situations wherein the patient was not bothered by the occlusion effect initially, but after using hearing aids for a while, finds it distracting. Some patients will report only using one hearing aid rather than two to minimize the annoyance, or simply discontinuing hearing aid use in general.
The most common report from patients is that their voice sounds “booming,” “hollow” or “echoing” when they talk. Another interesting description of the OE is “It sounds like I'm talking in a barrel” (Mueller (2003). In 20 years or so, we probably won't hear that one much anymore. People just don't talk in barrels as much as they used to. Of course, you might hear all these same complaints from someone who doesn't have a large OE, but rather is experiencing unwanted hearing aid gain in the low frequencies—an important differentiation that needs to be made, which we’ll discuss later.
Surprisingly, there really wasn't much written about the hearing aid OE until the 1980s. A report by Macrae (1980) from the National Acoustic Laboratories in Australia is one of the first on the topic. Interestingly, von Bekesy indirectly talked about the hearing aid OE in his 1960 book, Experiments in Hearing, where he states, “For maximally useful hearing, it is important to reduce not only the sounds of vocalization but also noises produced by chewing, swallowing, and the like.” (Mueller, 2003).
Over the past decade or so there has been a tendency to do more “open” fittings, and to use more instant-fit earmolds, which tend to be more open, even when the HCP might think that they are closed (See QuickTakes Volume 4.2). As a result, the OE isn’t as common as it once was, but common enough that it warrants discussion here.
What Causes the Occlusion Effect?
While the occlusion effect has been around a long time, many still do not understand its origin, with some even believing it’s related to the low-frequency gain of the hearing aid (which it is not). Here is a review of the nature of the occlusion effect (adapted from Mueller et al, 2014):
- When we talk, certain sounds, especially vowels, reach 120–130 dB SPL or more in the back of the throat.
- The high intensity sounds travel via the mandible (bone conduction) to the condyle, which is adjacent to the ear canal.
- This bone-conducted signal (typically below 750 Hz) then becomes an air-conducted signal by vibrating the cartilaginous portion of the ear canal (in general, the lateral 2/3).
- In normal situations, when the ear is open, this low-frequency energy escapes out the ear canal and does not contribute significantly to our perception of our own voice.
- If the lateral portion of the ear canal is plugged with a hearing aid or ear mold, this signal cannot escape, and the resulting trapped energy in the residual ear canal volume is reflected back to the eardrum and transmitted to the cochlea in the typical air-conducted manner.
- These sounds will then change the perception of our own voice and can also increase the sounds of chewing (particularly crunchy foods), and even vascular noise and breathing.
- The OE affects different speech sounds in different ways, boosting some vowels as much as 20 dB, and other vowels very little, and hence, it’s not just a matter of our voice sounding louder, but also “different.”
As we stated earlier, and as is shown in the pathway we just described, the occlusion effect is not at all related to the signal going through the hearing aid, or to the amplification provided by the hearing aid. In fact, the occlusion effect will be the same whether the hearing aid is turned on or off!
Quick Differential for Hearing Aid Occlusion Effect
As we mentioned, patients might have the same complaints regarding low-frequency hearing aid gain, as they would have for the hearing aid occlusion effect. The treatment, however, is very different, so it’s important to determine the cause of the complaint. This is most accurately determined using probe-mic measures, but there is a simple clinic procedure that often provides a quick differential diagnosis.
- Conduct this testing for each ear independently.
- Fit the hearing aid to the prescribed NAL-NL2 algorithm, and turn them on.
- Have the patient read a passage that contains vowels that trigger the occlusion effect. Just to have a little fun, we suggest the following: “Through three cheese trees three free fleas flew.” Any passage with words with the “ee” and “eye” sounds will work (Mueller et al, 2017).
- If there is a problem, we would expect the patient to state that the sound of his own voice is unusual (which is why we are doing this procedure).
- Mute the hearing aid, and have him read the passage again. Is the problem still present, or did it go away? If present, it’s the occlusion effect. If gone, the problem was related to hearing aid gain.
Probe-Mic Assessment of the Occlusion Effect
As mentioned, the best method to assess the presence and magnitude of the occlusion effect is to conduct probe-mic assessment. In some ways, this is similar to the speech mapping we discussed earlier, but there are important procedural differences (Mueller et al, 2017).
- Position the patient, probe assembly, and probe tip as we discussed in the first section of this paper.
- Configure the probe-microphone system so that the selected input is live voice. The terminology and set-up vary among manufacturers.
- With the ear open, have the patient vocalize an “ee” at 75 dB SPL. Some probe systems will have an SPL gauge for this. It also easily works to use a cell phone sound level recording app. Place the phone ~one foot in front of the patient.
- Analyze the spectrum of the signal (as you would for speech mapping), and save.
- Place the earmold/eartip/hearing aid in the ear, but do not turn on.
- Again, have the patient vocalize at 75 dB SPL, analyze, and store the measure. Importantly, ensure that vocalizations for the two measures have the same input SPL. If the patient could not strongly vocalize at 75 dB SPL, switch to 70 dB SPL. What we are concerned with is the difference measure.
- Compare the differences between the two curves. If similar, no occlusion effect is present. If the closed ear finding is significantly higher than the open ear results, the difference is the occlusion effect (recall that the hearing aid was turned off, so it can’t be hearing aid gain).
- Ignore the differences in the 3000 Hz region. These relate to the ear canal resonance, which likely will be reduced when the ear is closed, and are unrelated to the occlusion effect.
An example of the results of what we have just described are shown in Figure 6 (Mueller et al, 2017). This patient was using a closed dome, and stated his voice sounded so hollow that he could not use the hearing aids. Observe that for 200-400 Hz region, his own voice was enhanced by ~20 dB for the dome he was wearing (output for “open” vs. Dome A). When the replacement vented dome was used (Dome B output) note that the occlusion effect dropped by about 12 dB, as was no longer annoying. The peak for the open fitting in the 2000-3000 Hz region is the earcanal resonance, which predictably was not present with either dome was in the earcanal.
What you also see in Figure 6, is for the frequencies of ~400 Hz and higher, the new vented dome had little impact in reducing the occlusion effect. Fortunately, for this patient, simply reducing the effect ~200-400 Hz was enough to relieve the annoyance. For some patients, however, you will see that the maximum effect is around 500 Hz or higher. This then will require more aggressive venting, or an open fitting in some cases.
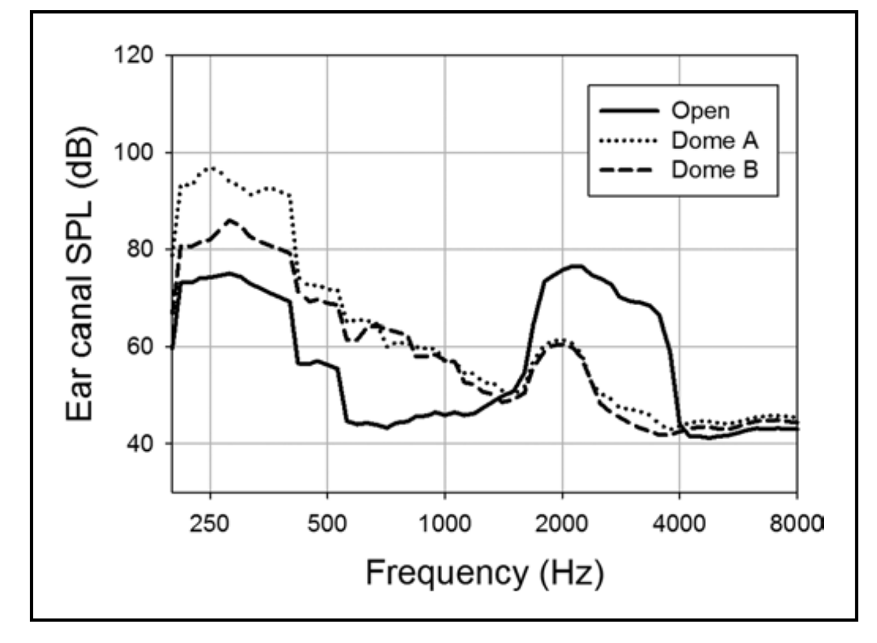
Figure 6. Assessment of the occlusion effect for two different instant-fit domes. Dome A was closed, Dome B was vented (adapted from Mueller et al, 2017). The difference between the two upper curves and the bottom curve is the “occlusion effect.”
Addressing the Occlusion Effect Problem
Let’s start by stating what does not assist in solving the occlusion effect problem: reducing low-frequency gain of the hearing aid. In fact, if the patient was appropriately fitted, this would actually give him a second problem—not enough audibility for low-frequency inputs.
There are basically two ways to treat the occlusion effect problem on a post-fitting visit. One is to make a new ear mold or hearing aid shell that fits more deeply into the ear canal (Bryant et al, 1991). By sealing the ear mold or shell beyond the second bend, the vibration of the cartilaginous portion of the canal is held to a minimum and the occlusion effect is mostly prevented from occurring. Shown in Figure 7 are the occlusion effect findings for two different CIC instruments, fitted to the same individual. The one CIC terminated about 12mm from the eardrum, a fairly common depth. The other, was fitted deeply, and terminated 3-4 mm from the eardrum. Note the large difference in the occlusion effect.
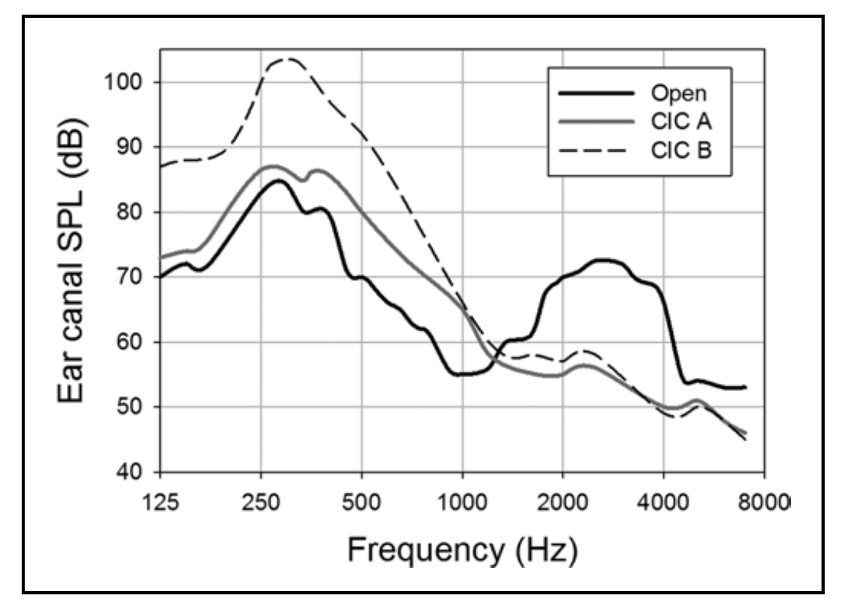
Figure 7. Example of the occlusion effect for two different CIC hearing aids. CIC A was fit deeply in the ear while CIC B was a shallower fit.
Although tackling the problem in this manner is an earnest goal, the side effects of a deep fitting ear mold or shell can cause significant amounts of discomfort and even pain for some patients. The earmold/hearing aid also can be difficult to insert. Therefore, this solution, although theoretically sound, is not very practical for most patients.
The second, and by far more popular, way to fix the occlusion effect problem is through venting, either traditional venting in an earmold or custom product, or by fitting a more open instant-fit tip. Not all occlusion effect problems have the same peak frequency—if the peak of the effect is around 200 Hz, this will be much easier to solve with venting than if the occlusion peak is around 750 Hz or higher. An example of this is shown in Figure 6. As we mentioned earlier, note that venting reduced the occlusion effect significantly for the 200-400 Hz range, but had little impact for 500 Hz and above.
Increasing venting will not provide a solution for more severe losses, where the low-frequency gain is needed for audibility. However, these patient usually will not complain of the occlusion effect, as it is exceeded by the low-frequency gain of the hearing aid. Venting often will not work with many custom hearing aid fittings either, where it often isn’t possible to create a vent large enough to provide the necessary leakage.
Step-by-Step Treatment Process
The general treatment process for the post-fitting complaint of occlusion goes something like this:
- Determine that indeed the patient is reporting the occlusion effect, and not a general dissatisfaction of too much low frequency amplification.
- Using our earlier guidelines, measure the magnitude of the occlusion effect using probe microphone techniques.
- If the occlusion effect is less than 5 dB or so, the complaint may be related to low frequency gain not the occlusion effect. Most patients do not find the occlusion effect to be particularly bothersome until it reaches 8-10 dB or greater (Mueller et al, 1996).
- For fittings using an “open ear-tip,” determine if the fitting is open through the use of REOG measures or direct measurement of the occlusion effect. If the REOG shows the fitting to be open (or nearly open; REOG is similar to the REUG), or the occlusion effect is near zero, reconsider if the complaint is truly the occlusion effect.
- If a significant occlusion effect is observed, fit with more open coupling, or increase vent size. Repeat probe-mic occlusion measures to ensure that improvement was made. Do not rely on patient comments, which tend to be unreliable.
- If the fitting has been made more open, before the patient leaves the clinic ensure that: 1) You have not created a feedback problem, and 2) The increased venting did not remove necessary low-frequency information needed for speech understanding (e.g. you still have adequately matched your desired low frequency gain targets—reprogramming usually is necessary).
Frequently Asked Questions
Q: You mention the pathway for the OE. How do you know that the bone-conducted component from the mandible doesn’t simply go straight to the cochlea?
A: While that might sound possible, we know that if we place an earmold (or hearing aid) deep in the earcanal, the OE is eliminated, supporting the notion that there is not a direct bone-conduction pathway (See Figure 7).
Q: I have heard that you can reduce the occlusion effect by increasing gain in the low frequencies?
A: This will not reduce the effect, but it is possible that in some cases it might reduce the annoyance of the effect. Recall that we said that the occlusion effect not only makes things louder, it also distorts the own-voice signal. Adding more low frequency hearing aid gain could possible mask some of these distortions, making the own voice sound more “normal.” The down side is now the patient will have that unnecessary gain in the low frequencies that very possibly will cause background noise to be more problematic.
Q. You didn’t mention “ampclusion?” I’ve heard that term tossed around quite a bit. Doesn’t that fit into this discussion?
A. “Tossed around” is a good description. We didn’t mention it directly, partly because we are not sure we understand what it is. It seems to be a somewhat popular term, and has been used in several articles—one of the first was something that Robert Sweetow published (Sweetow & Valia, 1997). We did some checking, and it seems the term was coined by Steve Painton in a JAAA article (Painton, 1993). According to Painton (page 152), ampclusion is “the combination of occlusion and low-frequency amplification that results in the ‘hollowness’ or ‘head in the barrel’ complaints.” So, if we’re understanding this correctly, if you know that the patient's problem is caused by the OE, then the patient would not have ampclusion, as there is no “combined” effect. Moreover, we don't use “ampclusion” because we don't view the combined effects as the major clinical issue. It's possible that there could be an OE problem at 200 Hz, and too much gain at 500 Hz, but usually the problem is one or the other. For effective treatment and management, we need to determine which of the two factors is the prime contributor to the problem. Additionally, when we say “combined” we need to think about “adding dB.” If, for a given patient, the occlusion effect was 15 dB, and the hearing aid gain was 15 dB, the “combined effect” is not 30 dB, it’s . . .only 18 dB! We doubt that 18 dB vs 15 dB is going to change the patient’s perception of the problem.
Q: If adding equal dB only makes a 3 dB difference, why is it that some patient say that they notice a big difference when only wearing one vs two hearing aids.
A: Good question. Our best guess, would be that because of the different geography of the two ears, and the difference in the depth and tightness of the fitting, the occlusion effect might be larger for some frequencies in one ear than in the other (e.g, the right ear might have a peak at 200 Hz, whereas the peak in the left ear might be at 500 Hz). When you combine them, the result at the brain is the highest output across all frequencies.
Q: Some hearing aids aid have an own-voice processing feature. Does this help reduce the occlusion effect?
A: No. Remember that the occlusion effect is the same when the hearing aid is “on” or “off.” These algorithms are successful, however, for reducing the annoyance of the patient’s own voice from the gain of the hearing aid, but that’s a different issue.
Q: It seems like men have more occlusion effect problems than women. True?
A: We often hear this. Is this because males have a lower fundamental frequency and therefore more hearing-aid induced occlusion? Probably not. Research has compared the occlusion effect for males and females, all fitted with similar custom instruments (Mueller et al, 1996). There was no significant difference between gender for ether the peak or the magnitude of the occlusion effect. We suspect that the perception that there is a larger occlusion effect for males, is because that males fitted with hearing aids are more likely than females to have normal or near-normal hearing in the low frequency. This is because of occupational and recreational activities; males are more apt to have a noise-induced hearing loss. This will lead to more “complaints” of the occlusion effect, not necessarily a larger occlusion effect.
V6.8: Self-assessment outcome measures.
As we’ve worked our way through the previous sections of this Volume, we’ve looked at important pre-fitting measures, the verification of the fitting algorithm, and also potential post-fitting issues. While it is tempting to assume that if we indeed selected the right product, chose the right features, programed gain and output appropriately, and did the right counseling, all will be well. Probably so, but not always, which is why there is an additional measure that is important—real-world validation, typically accomplished with self-assessment inventories.
While validation sounds similar to verification, there is a big difference. We like to use the example of trying to replicate our mom’s chocolate chip cookies—something many of us have attempted. We can use exactly the same ingredients and baking temperature (the prescription), conduct verification with measuring cups and spoons, verify consistency before putting it in the oven, and bake precisely at the right temperature for the correct time—a lot of verification. But we really don’t know that we got it right until we take the first bite—the validation! Regarding hearing aids, the “bite” for the patients is using their hearing aids in their everyday listening environments. And this is something that we need to assess.
Reasons for Using Self-Assessment Inventories
- As reviewed by Ruth Bentler and colleagues (Bentler et al, 2016), health care is becoming more consumer-driven. In many cases, the consumer decides what treatment is selected and when it is complete. The major index of quality of service is self-report outcome and satisfaction.
- Many real-world experiences simply cannot be measured effectively in laboratory conditions. The effectiveness of automatic features and signal classification depend heavily on the lifestyle and listening environments of the individual patient.
- As we’ve discussed in previous QuickTakes, there are several Best Practice documents available, all based on an evidence-based practice paradigm. Self-reports of outcome are becoming the new ‘gold standard” for measuring and reporting success. The norms tell you how your patient compares to other patients of similar demographics.
There also are many practical uses of the results of self-assessment inventories that hearing care providers (HCPs) often find useful for management and decision making (Mueller, 1997): Comparison of different dispensing sites or personnel; Comparison of different fitting procedures across groups of patients; Comparison of different circuitry or products across groups of patients; Post-fitting counseling effectiveness across groups of patients—does extra effort result in improved real world satisfaction and benefit; Documentation of service/practice effectiveness—You know you do a good job, but do you have data to prove it?
Practical Elements When Selecting Outcome Measures
Robyn Cox (1985) suggested that there are practical elements that the HCP should consider when choosing an outcome measure to use routinely:
- Clinician burden: This relates to the challenges for the audiologist in learning how to administer, score and interpret the test.
- Patient burden: This refers to the difficulty encountered by the patient in reading, understanding, and completing the items of the questionnaire. The reading level and cognitive level of both items and instructions should be considered.
- Scoring: Busy clinical audiologists are looking for a questionnaire that is convenient, quick, objective and easy to score. Automated scoring usually is preferred but not always available. Most of us have little trouble scoring the HHIE by hand, but the APHAB . . . without automation, more math and time than what we would like to invest.
- Utility: This characteristic relates to the extent to which the data from the scale can be readily applied for treatment, planning or counseling. A scale with a good utility would be the COSI, as the patient response relates directly to a listening condition identified by the patient.
Cox (1985) goes on to state that it also is important to consider: norms, reliability, validity and sensitivity. A lot of things to think about, but we’ll try to help. We have selected three outcome measures that we believe cover all the important domains, each of them assisting in validating the overall fitting process. Two of these measures already were introduced in QuickTakes 6.4, as they also are pre-fitting tools.
Abbreviated Profile of Hearing Aid Benefit (APHAB)
Provides “percent of problems” the patient has for three different listening conditions involving speech understanding (in quiet, in background noise and in reverberation) and problems related to annoyance of environmental sounds (aversiveness scale). As we discussed in QuickTakes Volume 6.4 (Part 1), these values can be obtained as a pre-test or unaided measure. At this point, for validation, we will use the same scale as an aided measure. We then can compare the findings to norms for hearing aids users (see Appendix B), or by looking at the aided to unaided difference score—as a benefit measure (Cox and Alexander, 1995).
To review, the APHAB is composed of 24 items that are scored in four subscales (six questions each):
- Ease of Communication (EC): The strain of communicating under relatively favorable conditions.
- Reverberation (RV): Communication in reverberant rooms such as classrooms.
- Background Noise (BN). Understanding speech when background noise is present.
- Aversiveness (AV): The unpleasantness of environmental sounds.
The APHAB can be administered as a paper and pencil test, or more commonly using a computer software version—the APHAB is included in the Questionnaire Module of the NOAH software. Scoring software also is available from the University of Memphis Hearing Aid Research Lab. The 24 items of the APHAB are scored on a seven-point scale. A percent value, shown on the form, is designated for each letter answer.
In addition to the norms published for unaided and aided findings (see Appendix B), there also are norms for older individuals with normal hearing. It is always comforting to the patient (and the HCP too) to inform him or her that with their hearing aids, they are performing equal to someone with normal hearing. The norms can be found at: https://harlmemphis.org/abbreviated-profile-of-hearing-aid-benefit-aphab/).
Step-by-step. The following is an example of how the APHAB can be used as an outcome measure:
- Have patient complete the 24-item scale, either on a laptop/iPad, using paper and pencil, or in response to HCP reading the statements to the patient (ideal).
- The patient must answer at least three questions in each category for the test to be valid. If several statements are skipped, the HCP can create similar scenarios to elicit response.
- If the patient previously completed the APHAB for unaided, it is okay to let them see their answers. If pre-testing was not conducted, have the patient answer the statements for both unaided and aided.
- Following automated scoring, compare the patients results to the norms for unaided, aided and degree of benefit.
- Conduct counseling relative to the findings. If the aided results, or the benefit fall below expectations (e.g., >75th percentile), consideration should be given to hearing aid programming changes.
The International Outcome Inventory for Hearing Aids (IOI-HA)
The IOI-HA is a short inventory used to quantify the effectiveness of hearing aid treatment (Cox and Alexander, 2004). This inventory is unique in that it addresses several domains related to hearing aid use, and is the outcome measure that is available in the greatest number of different languages, allowing for hearing aid outcome comparisons around the world. It can be useful for clinical comparisons across groups based on differences in clinical setting, treatment option, or even evaluation of the performance of individual HCPs. Alternatively, it can be used as a very quick way to evaluate patient outcomes to reinforce the positive impact of our services.
While many self-assessment inventories have several questions related to only one domain, the IOI-HA consists of seven items that focus on different aspects of hearing aid outcomes, but only one question/domain. The domains assessed are:
- Benefit from hearing aids
- Daily use
- Satisfaction with amplification
- Impact of using hearing aids on significant others
- Residual activity limitation
- Residual participation restriction
- Impact on quality of life
Step-by-step for IOI-HA administration. The IOI-HA purposely was designed to be easy to administer and score:
- The inventory is meant to be given in paper-and-pencil form. It is very self-explanatory, and there are no formal instructions. See Appendix C for the IOI-HA form.
- To score the outcome, each answer is given a number value 1 (worst) through 5 (best). For this measure, a higher score is indicative of a better outcome.
- The general norms are shown in Figure 8. The shaded box indicates what would be considered “acceptable”. The 7 categories (on the X-axis) represent the domains mentioned earlier.
- If a patient falls below “acceptable” for one of the categories, further explanation of the problem is warranted, and appropriate counseling applied.
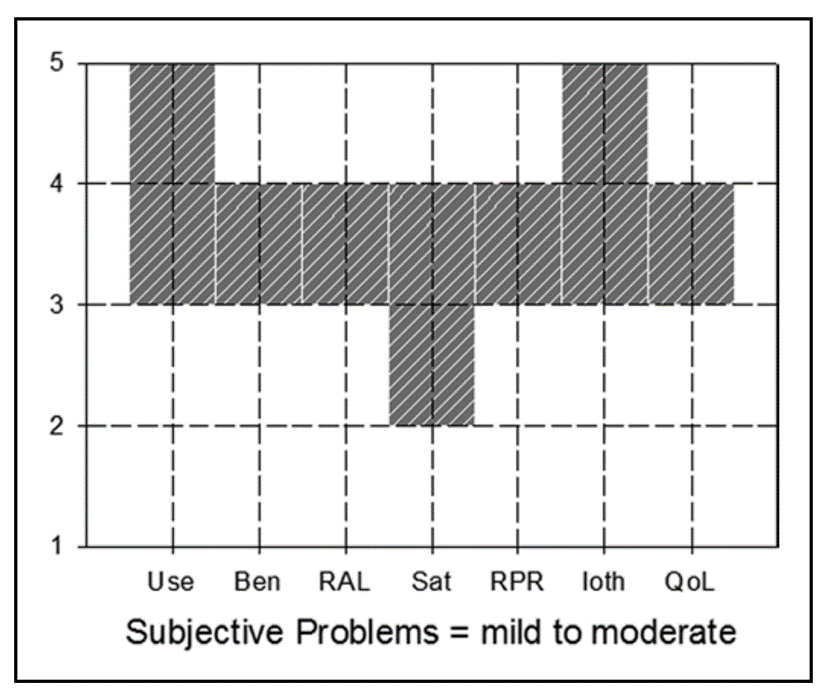
Figure 8. Norms for the IOI-HA. Acceptable ratings are anything within the shaded boxes. The labels on the X-axis are the seven domains (left-to-right): Use, Benefit, Residual activity limitation, Satisfaction, Residual participation restriction, Impact on significant others, and Impact on quality of life.
The IOI-HA is a quick way to obtain a general overview of how the patients feel about their hearing aid settings and how they are doing with them. The survey can help HCPs go straight to their patients’ issues and spend more time on counseling after adjusting the hearing aid settings. This particular scale requires very little time to administer and score. A PDF version of the scale in English and for all translations, and all normative data can be found at: https://www.memphis.edu/ausp/harl/downloads/.
The Client Orientated Scale of Improvement (COSI)
As we reviewed in QuickTakes Volume 6.4 (Part 1), the process begins by having the patient identify up to five specific listening situations in which he or she would like to hear better. It is important to stress these are listening situations, and not necessarily just communication. After all situations have been identified, it is then helpful to go back, review all situations, and have the patient rank order them. Simply place a 1 for most important, 2 for the second most important, and so on in the box to the left of the item. All this happens before the patient leaves with the hearing aids on the day of the initial fitting.
The completed COSI more or less then serves as an agreement between the patient and the HCP. Recall that initially, we have the patient rate expectations for each one of the situations listed. It is now time to determine of those expectations were met, after the patient has had those listening experiences in the real world.
Shown in Figure 9 is the completed COSI for same patient that we discussed in QuickTakes Volume 6.4 (Part 1), a new hearing aid user, following 3-weeks of hearing aid use. All in all, we would consider this a successful fitting, as we are obtaining at least some benefit for all listening conditions. Note that the two items where a rating of only “Slightly Better” was obtained are listening conditions where even someone with normal hearing has difficultly. Interestingly, the COSI listening situation he nominated last, but in the end was rated #1 (hearing grandchildren), was a situation with a “Much Better” rating.
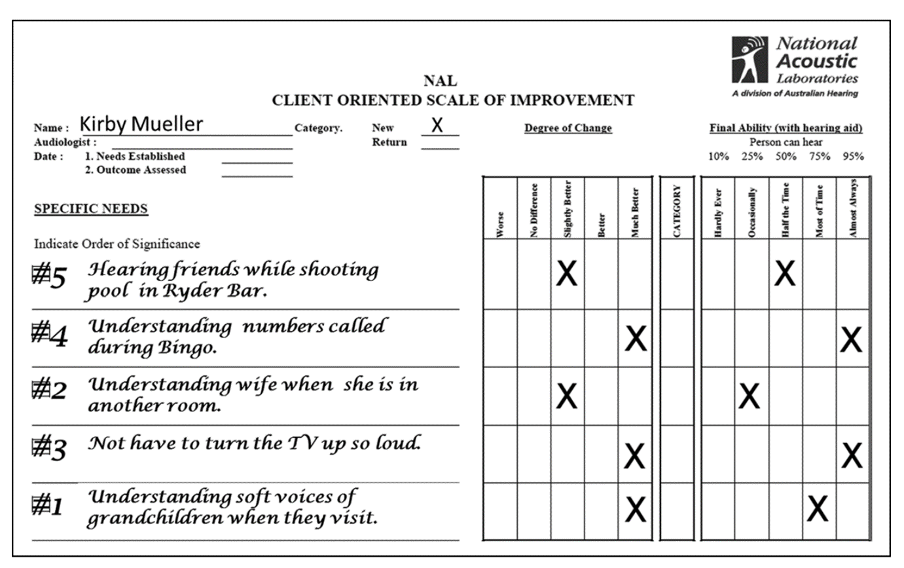
Figure 9. Completed COSI form following three weeks of hearing aid use. Patient rated both “Degree of Change” and “Final Ability.”
Step-by-step for COSI. The first three steps are accomplished during a pre-fitting appointment, or on the day of the fitting.
- Have the patient select 3-5 listening situations where he or she have problems, and would like improvement. Ensure that these are situations that are frequently encountered.
- After situations are selected, have the patient rank-order them regarding which are the most important.
- Have the patient rate their expectations for each of the situations under the “Degree of Change” heading (See example in QuickTakes 6.4).
- Following several weeks of hearing aid use, have the patient rate both “Degree of Change” and “Final Ability.” Determine if any ratings fall lower than expected, and counsel accordingly.
- Compare the ratings for Degree of Change to the previous expectation ratings. Discuss how actual performance compares to the initial expectations, and counsel accordingly.
A final thought about outcome measures: Research has shown that simply giving your patients an outcome measure and asking about satisfaction significantly improves satisfaction.
Frequently Asked Questions
Q: What about using the HHIE as an outcome measure?
A: That would work fine. We reviewed it as a pre-fitting measure in QuickTakes Volume 6.4 (Part 1). We chose to keep our review here to three scales, to make it more clinically manageable. There certainly is ample data available for expected aided results for both the HHIE and HHIA, much of it provided by the work of audiologist Larry Humes. A review of some of his recent (open-access) Ear and Hearing article (Humes, 2021).
Q: What if, for the COSI, the patient said they didn’t experience the items on the list?
A: This shouldn’t happen. When this form is initially competed (at the time of the fitting) this is why we don’t allow the patient to randomly select items (they may pick something that just happened the night before), but rather, discuss with them if the area they selected happens frequently. We like to use a percentage. What percent of your average week does this listening situation occur? If it’s only one hour, once a week, you don’t want it on the list.
Q. Should the aversiveness rating on the APHAB agree with the patient’s LDLs?
A: Yes, we would expect that if the patient had unusually low LDLs, you would expect a high percent of problems for the Aversiveness listening situations. There isn’t a direct relationship, however. Fingernails on a chalkboard (are there still chalkboards?) might be very aversive, but not exceed the patient’s LDL.
Q: It seems that with the APHAB, the Aversiveness findings are usually worse for the aided condition, compared to unaided.
A: Yes, this is the expected finding, especially for the first few weeks, even when care is taken to set the MPO appropriately. Consider that the 50th percentile for “percent of problems” for unaided is 14%, whereas for aided, it’s 38% (See Appendix B). We suspect that following the fitting, patients, especially new hearing aid users, are just a little overwhelmed by everything being louder. It’s probable that after several months of hearing aid use, the Aversiveness scores for aided would be more reasonable.
Q: What if the Degree of Change on the COSI falls below expectations for all items?
A: That would be unusual, unless the patient was allowed to only pick very difficult listening situations. We normally see that expectations are met, or even exceeded. Assuming expectations were reasonable, we would expect that perhaps these results indicate that the patient has motives to make the fitting appear inferior (he just saw an ad for a pair of $600.00 OTCs).
Q: On the COSI, is it necessary to have the patient complete both the Degree of Change and the Final Ability?
A: You are probably seeing that these ratings tend to be very similar, but they are providing somewhat different information. Given the simplicity of collecting the data, we would suggest having the patient rate both.
Q: When is the best time after the fitting to conduct these outcome measures?
A: Research has shown that scores will probably be the most reliable and valid following two months or so of daily hearing aid use. Because of regulations regarding hearing aid return policies, however, we suggest that these measures are conducted ~2-3 weeks following the fitting. This provides the opportunity for post-fitting counseling and programming tweaking within the 30-day window.
References
Bagatto, M., Moodie, S., & Malandrino, A. (2011). The University of Western Ontario Pediatric Audiological Monitoring Protocol (UWO PedAMP). Trends in Hearing. https://doi.org/10.1177/1084713811420304
Bentler, R.A., Mueller, H.G., & Ricketts, T. (2019). Modern Hearing Aids: Verification, Outcome Measures, and Follow-up. San Diego: Plural Publishing.
Bryant, M.P., Mueller, H.G., & Northern, J.L. (1991). Minimal contact long canal ITE instruments. Hearing Instruments, 42(1), 12–18.
Cox, R.M. (1985). A structured approach to hearing aid selection. Ear and Hearing, 6(6), 226-239.
Cox, R.M., & Alexander, G.C. (1995). The abbreviated profile of hearing aid benefit. Ear and Hearing, 16(2), 176-186.
Cox, R.M., & Alexander, G. (2002). The International Outcome Inventory for Hearing Aids (IOI-HA): Psychometric properties of the English version. International Journal of Audiology, 41(1), 30-35.
Dao, A., Folkeard, P., Baker, S., Pumford, J., & Scollie, S. (2021). Fit-to-Targets and Aided Speech Intelligibility Index Values for Hearing Aids Fitted to the DSL v5-Adult Prescription. Journal of the American Academy of Audiology, 32(2), 90-98.
Hawkins, D.B., Montgomery, A.A., Prosek, A.A., & Walden, B.E. (1987). Examination of Two Issues concerning Functional Gain Measurements. Journal of Speech and Hearing Disorders, 52(1), 56-63.
Humes, L.E. (2021). An Approach to Self-Assessed Auditory Wellness in Older Adults. Ear and Hearing, 42(4), 745–761.
Johnson, E.E., & Dillon, H. (2011). A comparison of gain for adults from generic hearing aid prescriptive methods: impacts on predicted loudness, frequency bandwidth, and speech intelligibility. Journal of the American Academy of Audiology, 22(7), 441-459.
Killion, M.C., & Mueller, H.G. (2010). Twenty years later: A new count-the-dots method. Hearing Journal, 63(1), 10-17.
Macrae, J. (1980). Earmold Venting and the Ear Canal Occlusion Effect. Chatswood, Australia: National Acoustic Laboratories Department of Health, Informal Report #74, 1980.
Mueller, H.G. (2003). There's less talking in barrels, but the occlusion effect is still with us. The Hearing Journal, 56(8), 10-16.
Mueller, H.G. (1997). Outcome measures: The truth about your hearing aid fittings. The Hearing Journal, 1997, 50(4), 21-33.
Mueller, H.G. (2018). Is autoREMfit a reasonable verification alternative? AudiologyOnline. Available from: https://www.audiologyonline.com/
Mueller, H.G. (2020). Perspective: real-ear verification of hearing aid gain and output. GMS Z Audiol (Audiol Acoust), 2, Doc05. DOI: 10.3205/zaud000009
Mueller, H.G., & Killion, M.C. (1990). An easy method for calculating the articulation index. Hearing Journal, 43(9), 14-17.
Mueller, H.G., Bright, K.E., & Northern, J.L. (1996). Studies of the hearing aid occlusion effect. Seminars in Hearing, 17(1), 21–32.
Mueller, H.G., Ricketts, T.A., & Bentler, R.A. (2014). Modern Hearing Aids: Pre-fitting and Selection Considerations. San Diego: Plural Publishing.
Mueller, H.G., Ricketts, T.A., & Bentler, R. (2017). Speech Mapping and Probe-Microphone Measures. San Diego: Plural Publishing.
Mueller, H.G., & Ricketts, T.A. (2018). Hearing aid verification: Will autoREMfit move the sticks? AudiologyOnline. 2018 Jul 9. Available from: https://www.audiologyonline.com/articles/20q-hearing-aid-verification-226-23532 37.
Mueller, H.G., Coverstone, J., Galster, J., Jorgensen, L., & Picou, E. (2021). 20Q: The new hearing aid fitting standard - A roundtable discussion. AudiologyOnline, Article 27938. Available at www.audiologyonline.com.
Painton, S.W. (1993). Objective measure of low-frequency amplification reduction in canal hearing aids with adaptive circuitry. Journal of the American Academy of Audiology, 4(3), 152–156.
Ricketts, T.A., Bentler, R.A., & Mueller, H.G. (2019). Essentials of Modern Hearing Aids. San Diego: Plural Publishing.
Sweetow, R., & Valia, A. (1997). Effects of electroacoustic parameters on ampclusion in CIC hearing aids. Hearing Review, 4(9), 8–22.
Appendix A. The Killion-Mueller Count-The-Dots audiogram (free to copy).
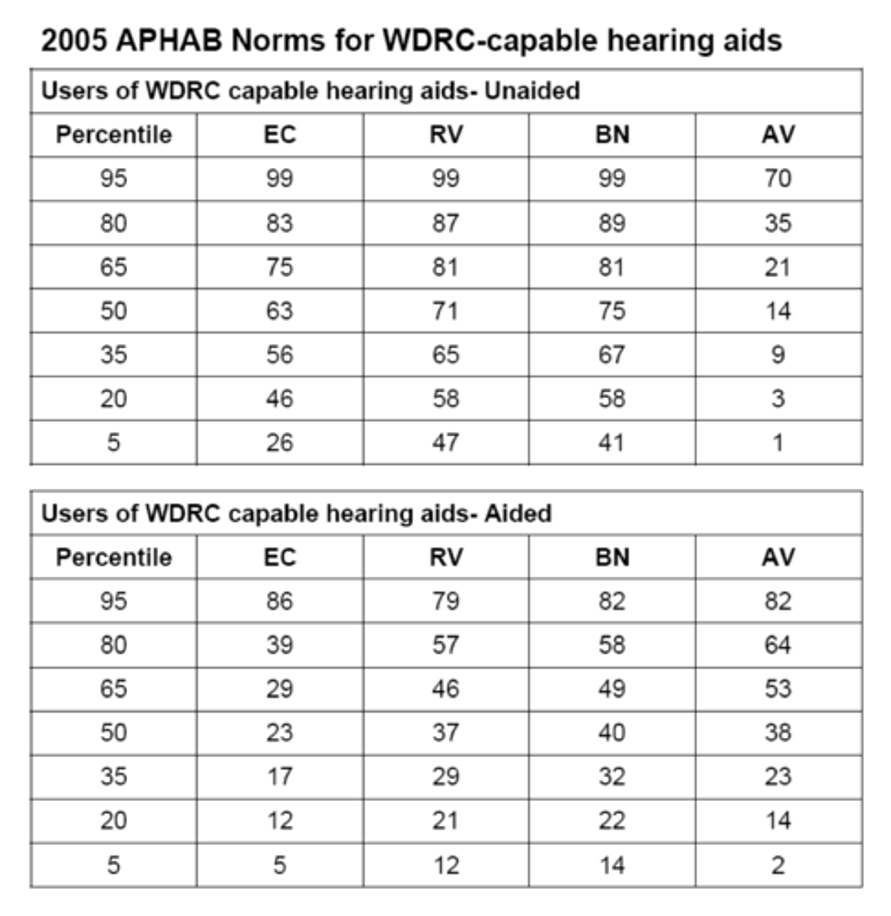
Appendix B. APHAB normative data for the four sub-scales for both unaided and aided findings.
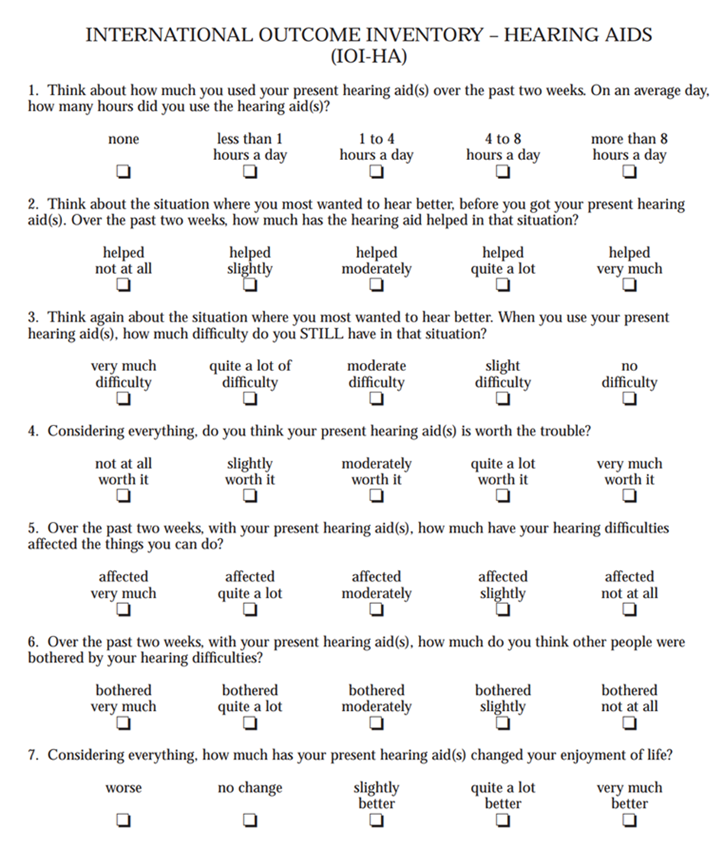
Appendix C. Standard form for administering the IOI-HA.
Citation
Taylor, B. & Mueller, H. G. (2023). Research QuickTakes Volume 6 (Pt. 2): hearing aid fitting toolbox - verification and validation. AudiologyOnline, Article 28708. Retrieved from https://www.audiologyonline.com