
How do audiologists decide which manufacturing brand they will use when dispensing hearing aids to patients? Based on ideology and methodology from the field of consumer behavior, this article offers insight into the decision-making processes used by clinical audiologists in today's field of practice. To begin, it is necessary to briefly review recent and relevant trends in this area.
In 2007, an estimated 2.5 million hearing aids were sold in the U.S. (Kirkwood, 2008). Audiologists and hearing instrument specialists both report that approximately 90% of those units were produced by hearing aid manufacturers under the labeling of 10 brand names: GN ReSound, Oticon, Phonak, Siemens, Starkey, Unitron, Widex, Beltone, Miracle-Ear, and Sonic Innovations (Johnson, 2007a). Consistent with this identification of major market stakeholders, Strom (2006) identified the six largest hearing aid manufacturers and labeled them as the "Big 6". Strom's Big 6 brand set included GN ReSound, Oticon, Phonak, Starkey, Siemens, and Widex.
Most audiologists have encountered these aforementioned dominant brand names. These brands have the largest exhibitor booths at national conferences, and their booths are often visited by audiologists. In addition, sales representatives from various brands are eager to visit with audiologists at their offices, and audiologists are also exposed to a multitude of brands as a result of patients visiting multiple hearing healthcare providers before and/or after the purchase of hearing aids. As a result, audiologists are oftentimes knowledgeable concerning many different brands and are able to fit and service a variety of hearing aid products.
Despite exposure to multiple hearing aid brands, anecdotal evidence and research data from surveys of audiologists indicate that the individual audiologist demonstrates a strong preference for a single brand when making his/her hearing aid purchase decisions. Recent data indicated 93.5% of 489 surveyed audiologists dispensed the vast majority of their hearing aids (i.e., 71.4% on average) from a single brand (Johnson, 2007a;Johnson et al., 2008). This estimate was based on a collective examination of the audiologists' brand purchasing behavior (i.e., repeatedly dispensing one brand more than 50% of the time), and self-report of a preference for one brand.
The average audiologist reports changing his/her preferred brand every 4.5 years. More specifically, less experienced audiologists report changing their individual preference more frequently (i.e., every 2 years) and older audiologists change it less frequently (i.e., every 6.5 years) (Johnson, 2007a). Although many presume that hearing aid brands are fairly equivalent in terms of quality, performance, reliability, and other factors, then why do audiologists refrain from dispensing a variety of manufacturers in a fairly equivalent manner? In actuality, the occurrence of individualized brand preferences suggests that audiologists likely do not perceive hearing aid brands equally.
One reason an audiologist may choose to primarily dispense one manufacturer is because of the associated financial incentives;however, the survey data reported in this article show audiologists do not indicate that financial incentives are of high importance when choosing a manufacturer. While some may be skeptical of this self-report data, it is actually more plausible than it first appears. Assuredly, the financial incentives of predominantly dispensing one brand are apparent for audiologists employed in a capitalistic setting. In addition, even very large, non-capitalistic federal entities, through the creation of purchase contracts, have only a few brands on contract and negotiate the lowest possible price points. An example of this is the U.S. Department of Veterans Affairs and its 647 audiologists (Beck, 2008), which dispense about 15% of all hearing aids in the U.S. (Kochkin, 2005). Therefore, the inherent nature of financial incentives associated with dispensing fewer brands allows other factors to become more important than financial incentives when making a brand preference decision.
This article will present data from a recent peer-reviewed publication that supports this very concept. First, it is important to understand how consumers in general develop an individualized preference among competing brand alternatives. Customer psychology and marketing studies assessing purchase decision modeling indicate that personal values (e.g., Rokeach, 1973;Henry, 1976;Vinson et al., 1977;Wagner et al.., 1991;Peter & Olson, 2005) and perceptual personal evaluations leading to attitudinal beliefs about brands (e.g., Fishbein, 1963;Fishbein & Azjen, 1975;Cooper, 1983;Lilien & Rangaswamy, 2004;Peter & Olsen, 2005) influence brand purchasing behavior.
Specifically, one model of consumer behavior, known as the value-attitude system (Vinson et al., 1977), acknowledges that brand preference choice is delineated by personal values (e.g., factors of varied importance) and/or perceptual personal evaluations of brands (e.g., brand attitudes). This model further subdivides personal values into categories of global values and domain-specific values. Global values refer to enduring and core beliefs on existence and modes of behavior, whereas domain-specific values refer to beliefs regarding particular topics within a given area of interest (e.g., hearing aid brands in the area of audiology).
Generally speaking, few people have studied audiologists' hearing aid dispensing preferences;conversely, end-consumer preferences have been studied often (as shown in Kochkin's MarkeTrak reports). In terms of hearing aids, however, the choice of which hearing aid brand to dispense typically is made by the individual audiologist rather than the patient purchasing the hearing aid. This is supported by the fact that the majority of patients are unaware of major brand names (Kochkin, 2002).
To date, the key determinants of how and why most audiologists demonstrate a preference for a hearing aid brand are relatively unknown. It is important to identify these factors not only to hearing aid manufacturers who have a commercial interest in their customers' and potential customers' brand preferences, but also to audiologists who make brand decisions. If audiologists analyzed both how and why hearing aid brand selection is made across the profession, it may ultimately result in a more conscious, systematic, evidenced-based approach to brand selection that could affect patient outcomes. Several research efforts have noted that provisions for patient hearing rehabilitation have the potential to be affected by brand dispensing. For example, brand-specific proprietary signal amplification strategies (e.g., variations on compression), brand-recommended and obtained insertion gain values (Hawkins & Cook, 2003), brand-recommended maximum possible output values (Mueller et al., 2008), and the percentage rate of product feature inclusion (e.g., directional processing) (Johnson, 2007b) have been shown to differ between hearing aid brands.
The Hearing Aid Brand Preference Decision
Within a framework similar to the value-attitude system of Vinson et al. (1977) discussed earlier, recent research has indicated that an audiologist's preference for a single hearing aid brand is, in large part, not delineated based on his/her personally held hearing aid domain-specific values (Johnson et al., 2008). That is, the rankings of the most important factors or values pertaining to a brand choice decision did not vary depending on the audiologist's preferred brand. Rather, it is hypothesized that the preference most likely arises from more peripherally held evaluations of hearing aid brands and their products.
It is likely then, that the audiologist's perceptual evaluation of which brand is the "best" is the determinant of a brand preference decision. Brands, of course, may be the "best" on a variety of brand attributes. Thus, data regarding peripherally held personal evaluations of hearing aid brands by audiologists for numerous brand attributes are needed to ascertain a better understanding of brand preference determinants. Kotler (1991) and Lilien and Rangaswamy (2004) recommend assessing the following brand attributes:
- performance,
- durability,
- reliability,
- serviceability,
- style,
- product image,
- delivery,
- installation (research and development),
- training and consulting,
- repair and maintenance,
- other services,
- service image, and
- perceived quality.
Relating Hearing Aid Domain-Specific Personal Values to Preference for a Particular Brand (Johnson et al., 2008)
In an attempt to better understand the personal values that determine a hearing aid brand preference, 343 audiologists individually rated the importance of 32 separate items. These ratings were completed on a standard 0 (No Importance) to 10 (Highest Importance) rating scale. Principle component factor analysis of these importance ratings indicated that audiologists consider seven factors when making a brand preference decision: brand aptitude (defined as performance competency), brand image, product cost, brand sales and speed of delivery, brand exposure, colleague recommendations, and brand contracts and incentives. These factors explained 57% of the variance in the ratings on the 32 items.
To find out if differences in the perceived importance of these factors delineated an audiologist's preference for a specific hearing aid brand, the 343 audiologists were divided into subgroups based on each individual's hearing aid brand preference and his/her mean importance rating on each factor. The importance ratings were then statistically compared across audiologists with respect to their individually preferred brand (out of seven brands total). Analysis of the data showed that the audiologists, despite their individually preferred brands, ranked the seven factors in the same order of importance when making their preference decisions (Figure 1). In other words, the audiologists who chose hearing aid brand A versus audiologists who chose hearing aid brand B both placed the most importance on the perceived aptitude, followed by image, and so on of the hearing aid brand.
Interpretation of these results suggests that hearing aid domain-specific personal values do not vary with respect to preference for a particular brand among a group of audiologists. One minor exception to this statement was evidenced by small yet statistically significant differences in the importance ratings of the Contracts and Incentives factor among three of the seven included brands. Despite the small-identified differences between three of the brands, the Contracts and Incentives factor was always the least important of the seven factors.
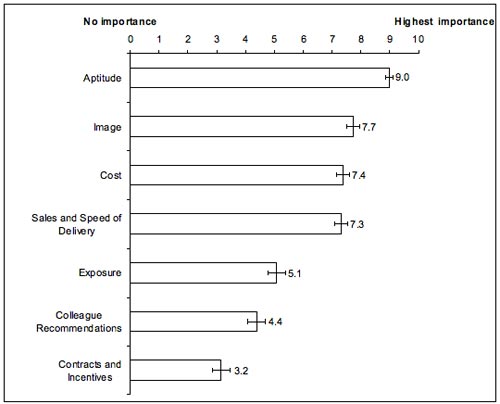
Figure 1. Mean importance rating placed on each of the seven factors accompanied by 95% confidence intervals.
Because the importance placed on the factors (i.e., hearing aid domain-specific values) did not relate to whether an audiologist had a preference for hearing aid brand A, brand B, etc., one might conclude audiologists believe that hearing aid manufacturers are all similar;however, the general premise of the value-attitude model of Vinson et al. (1977) indicates that this preliminary conclusion is likely to be inaccurate. Rather, these findings point to the next logical hypothesis that perceived differences in the aptitude and image of brands (i.e., the most important factors to the brand preference decision) and, possibly, other less important factors lead to a preference. Simply stated, audiologists likely believe some hearing aid brands are better or worse than other brands based on a wide variety of attributes (e.g., performance, quality, reliability, integrity, innovation, etc.). It is expected, therefore, that an examination of these perceptions is needed to better understand the underlying reasons for an audiologist's brand preference.
Future Reseach: Perceptual Personal Evaluations of Brands and the Development of Brand Attitudes
Assessing perceptual personal evaluations and brand attitudes may help to determine whether hearing aid manufacturers have tangible or intangible strengths and weaknesses regarding comparable, but distinct, product lines and features (Lilien & Rangaswamy, 2004;Peter & Olson, 2005;Keller, 2003). The reason for identifying these strengths and weaknesses, real and/or perceived, is their impact on consumer purchasing. Accordingly, these strengths and weaknesses of products and manufacturers are utilized by companies to continually segment, target, and position the products of a brand to consumers (e.g., audiologists) in order to maximize the market share of a brand (Lilien & Rangaswamy, 2004). Likewise, it may be envisioned that consumers (e.g., audiologists), can also use such data in order to analyze their own group preferences, and in doing so, to help make those preferences more conscious and data-driven.
Since perceptions held by consumers regarding competitive brand sets are often assessed using perceptual mapping techniques that employ multidimensional scaling (MDS) statistics (Lilien & Rangaswamy, 2004), this methodology may be useful in future research of audiologists' brand preference decisions. Psychometricians first developed MDS statistical methods to create perceptual maps because they wanted to know how to quantify perceptions occurring on multiple dimensions. In audiology, researchers have used multidimensional scaling methods to examine sound quality preferences for speech and music processed through hearing aids and cochlear implants (Gabrielsson & Sjögren, 1979;Punch et al., 1980;Versfeld et al., 1999;McDermott & Sucher, 2006).
To create a perceptual map of brands, consumers are surveyed on a variety of attributes among competing brand alternatives. Assessment may be performed using a standardized 1-9 rating scale or another similar rating scale (Lilien & Rangaswamy, 2004). At the continuum endpoints, a 1 represents the poorest measurement, and a 9 represents the best measurement of a surveyed attribute. For example, if an audiologist rated a manufacturer's aptitude to develop products of high quality and reliability as the most important factor in a hearing aid brand preference decision, a rating of 9 would represent superior product workmanship, and a rating of 1 would indicate the brand has inferior product workmanship.
A factor analysis is completed on the data to extrapolate correlated attributes and form a smaller subset of orthogonal (independent) underlying factors that account for the maximum amount of variance among the surveyed attributes. The data is then subjected to MDS analyses. These analyses create maps, plotted in Euclidean space, which are graphical representations of perceived similarities or dissimilarities between a set of competing brand alternatives. An example of a two-dimensional perceptual map, referred to as a positioning map in marketing research, displaying the relationship between brands of cars and car-relevant attributes is shown in Figure 2 to illustrate how brands can be positioned in the minds of consumers. This same type of map could be used in future research to understand how hearing aid brands are positioned in the minds of audiologists.
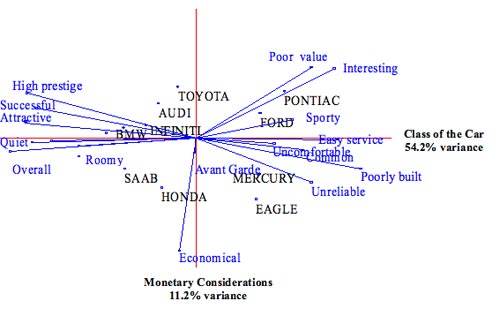
Figure 2. Hypothetical perceptual map of car brands in relation to car-relevant brand attributes.
Vectors, shown by the blue line segments, often indicate the magnitude and direction of surveyed attributes in Euclidean space. Brands with higher ratings on an attribute vector are further away from the origin of the graph on the same left or right hemisphere of the graph as the attribute label. Attributes at right angles to one another are considered uncorrelated, and attributes 180 degrees apart are considered negatively correlated. Those at angles of 45 degrees or less are considered to have a higher correlation as the degree of separation decreases. The main axes of the map, the ordinate and abscissa, are a special set of vectors that suggest the best underlying attributes or dimensions of how respondents differentiate brands (Lilien & Rangaswamy, 2004).
One limitation of a perceptual map is its inability to convey consumer preferences. Accordingly, joint-space maps conveying preference are also typically constructed to simultaneously convey both consumers' perceptions and preferences. A joint-space map can overlay consumer preferences on the perceptual map to indicate the number of consumers that prefer certain attributes and brands. To create these maps, preference data should also be collected on a 1-9 rating scale with continuum endpoints representing the lowest preference and highest preference, respectively.
The creation of a joint-space map is vital to understanding the similarities and differences of competing brand alternatives, because perceptions and preferences are not always one and the same. A dispensing audiologist may perceive "X" in a product but he or she can prefer "Y". Unlike perceptions, preferences do not increase or decrease linearly with changes in magnitude of an attribute. In some cases, consumers have an ideal level of an attribute (e.g., temperature of a cup of coffee) above or below the point where a product becomes less preferred (Lilien & Rangaswamy, 2004). An example relevant to hearing aids may include compression time constants, where one can assess the duration of release time. Dispensing a hearing aid with a long release time (e.g., 1000 ms), as compared to 50 ms, for example, may be preferred by audiologists as long as the release time is not "too long" (e.g., 10000 ms).
Therefore, a joint-space map allows for a good indication of the number of consumers who prefer certain attributes and brands and is envisioned to assist in future research of audiologists' brand preferences. An example joint-space map is shown in Figure 3.
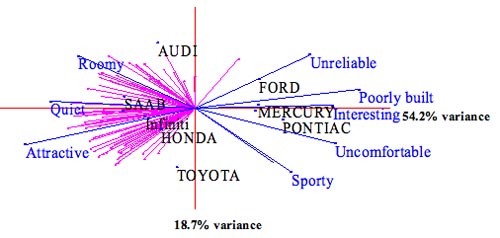
Figure 3. Hypothetical joint-space map showing car brands in relation to car-relevant brand attributes (blue-colored vector lines) and individual consumer preferences (pink-colored vector lines).
Summary
To date, research has identified the majority (i.e., 57%) of factors rated as important by audiologists when making a hearing aid brand preference decision. The seven factors are: brand aptitude, brand image, product cost, brand sales and speed of delivery, brand exposure, colleague recommendations, and brand contracts and incentives. Other "factors" assuredly exist that are of importance to a brand preference, but these factors have not yet been identified with formalized statistical methods. An examination of the mean rated importance of the seven known factors, regarded as domain-specific values with respect to the hearing aid brand preference of audiologists, indicated no clear pattern in the magnitude of the importance ratings which could differentiate brand preference. Accordingly, the domain-specific value component of the Vinson et al. (1977) model of consumer behavior is not considered useful in describing how individual audiologists arrive at their brand preference. Following the Vinson et al. (1977) model, the best indicator of an audiologist's preference is likely to be his/her perceptual personal evaluations of hearing aid brands and subsequently developed brand attitudes. One statistical technique that can be applied to analyze audioloigsts' brand attitudes is multidimensional scaling. The output of this technique is the creation of brand positioning and joint-space maps that may afford both audiologists and hearing aid manufacturers lucid visual references for differentiating competing hearing aid brand alternatives and conveying audiologists' preferences.
Acknowledgements
Figure 1 is taken from an article entitled, Statistically-Derived Factors of Varied Importance to Audiologists When Making a Hearing Aid Brand Preference Decision by Johnson et al (2008), which is scheduled to appear in a forthcoming issue of the Journal of the American Academy of Audiology. Used with the permission of the American Academy of Audiology.
Figures 2 and 3 were created by a software package entitled Marketing Engineering (Lilien & Rangaswamy, 2004) as part of an Advanced Consumer Behavior course in the Vanderbilt University Owen Graduate School of Business.
---------------------------------------------------------------------------------------
Earl E. Johnson, Ph.D., is an audiologist at the Mountain Home, TN Veterans Health Administration Medical Center. He is also an Assistant Professor at East Tennessee State University. Readers may contact Dr. Johnson at [email protected].
*The opinions expressed are those of the author and do not necessarily represent the official position of the U.S. Department of Veterans Affairs.
References
Beck, L. (2008). National office report. Presentation at the 2008 Association of Veterans Affairs Audiologists National Conference, Charlotte, NC.
Cooper, L. G. (1983). A review of multidimensional scaling in marketing research. Applied Psychological Measurement, 7(4), 427-450.
Fishbein, M. (1963). An investigation of relationships between beliefs about an object and the attitude toward that object. Human Relations, 16, 233-240.
Fishbein, M., & Ajzen, I. (1975). Belief, Attitude, Intention, and Behavior: An Introduction to Theory and Research. Reading, MA: Addison-Wesley Publishing.
Gabrielsson, A. and Sjögren, H. (1979). Perceived sound quality of sound-reproducing systems. Journal of the Acoustical Society of America, 65, 1019-1033.
Johnson, E.E. (2007a). Survey explores how dispensers use and choose their preferred hearing aid brands. The Hearing Journal, 6(3), 23-36.
Johnson, E.E. (2007b). Audiologists' dispensing rates of four common hearing aid product features: Contributors to variations in practice. Published dissertation, Vanderbilt University.
Johnson, E.E., Mueller, H.G. & Ricketts, T.A. (in press). Statistically-derived factors underlying audiologists' individually preferred hearing aid brand. Journal of the Academy of Audiology.
Keller, K.L. (2003). Strategic Brand Management: Building, Measuring, and Managing Brand Equity, 2nd edition. Upper Saddle River, NJ: Prentice-Hall, Inc.
Kirkwood, D. (2008). Bucking bad economic news, hearing aid sales rise by 5.4% on way to record year. The Hearing Journal, 60(12), 11-16.
Kochkin S. (2002). Factors impacting consumer choice of dispenser & hearing aid brand;Use of ALDs and computers. Hearing Review, 9(12), 14-23.
Kochkin S. (2005). MarkeTrak VII: Hearing loss population tops 31 million people. The Hearing Review. 12(7), 16-29.
Kotler, P. (1991). Marketing Management: Analysis, Planning, Implementation, and Control, 7th edition. Englewood Cliffs, NJ: Prentice Hall, Inc.
Lilien, G.L. & Rangaswamy, A. (2004). Marketing Engineering, 2nd edition. St. Victoria, BC Canada: Trafford Publishing.
McDermott, H.J. & Sucher, C.M. (2006). Perceptual dissimilarities among acoustic stimuli and ipsilateral electric stimuli. Hearing Research, 218, (1-2), 81-88.
Mueller, H.G., Bentler, R.A., & Wu, Y. (2008). Prescribing maximum hearing aid output: Differences among manufacturers found. The Hearing Journal, 61(3), 20-36.
Peter & Olson (2005). Consumer Behavior and Marketing Strategy, 7th edition. New York, NY: McGraw Hill.
Punch, J.L., Montgomery, A.A., Schwartz, D.M., Walden, B.E., Prosek, R.A., & Howard, M.T. (1980). Multidimensional scaling of quality judgments of speech signals processed by hearing aids. Journal of the Acoustical Society of America, 68(2), 458-466.
Rokeach M. (1973). The Nature of Human Value. New York, NY: Free Press.
Strom, K. (2006). The HR 2006 Dispenser Survey. Hearing Review, 13(6), 16-39.
Versfeld, N.J., Festen, J.M., & Houtgast, T. (1999). Preference judgments of artificial processed and hearing aid transduced speech. Journal of the Acoustical Society of America, 106(3 Pt 1), 1566-1578.
Vinson, D. E., Scott, J. E., & Lamont, L. M. (1977). The role of personal values in marketing and consumer behavior. Journal of Marketing, 41(2), 44-50.
Wagner, A. K. & Mazzon, J. A. (1991). Value segmentation: A model for the measurement of values and value systems. Journal of Consumer Research, 18(2), 208-218.