
Telemetry capabilities became commercially available in 1998 to measure the electrically evoked compound action potential (ECAP) from the auditory nerve in cochlear implant (CI) recipients. An initial body of research provided foundational information about how to use ECAP measures to assist with speech processor programming for one specific device (Nucleus 24M, Cochlear Ltd., Lane Cove, New South Wales, Australia) and one specific speech processing strategy (SPEAK; 250 pps/ch). Research conducted since that time has focused on refining the clinical use of ECAP threshold measures for speech processor programming with other devices, strategies, and stimulation rates. Now that ECAP measures are readily available in the clinical software for all three FDA-approved CI manufacturers, more clinicians are using these measures as part of routine clinical service delivery.
The purpose of this article is to provide: (1) an updated overview of how telemetry is used to measure the ECAP, (2) a summary of the two most common methods used to separate the neural response from stimulus artifact, and (3) a comprehensive review of research studies that demonstrate how ECAP measures can be used clinically to guide speech processor programming for various devices and processing strategies.
Overview of the ECAP and Telemetry
What is the ECAP?
The ECAP represents a synchronous response from electrically stimulated auditory nerve fibers and is essentially the electrical version of Wave I of the auditory brainstem response (ABR). The ECAP is recorded as a negative peak (N1) at about 0.2-0.4 ms following stimulus onset, followed by a much smaller positive peak or plateau (P2) occurring at about 0.6-0.8 ms (Abbas et al., 1999; Brown et al.,1998; Cullington, 2000). The amplitude of the ECAP can be as large as 1-2 mV, which is roughly larger in magnitude than the electrically evoked ABR (EABR; Brown et al., 1998). ECAP measures have become a popular alternative to clinical EABR testing due to ease of recording and reduced testing time. In contrast to the EABR, ECAP measures do not require surface recording electrodes, sleep/sedation, or additional averaging equipment. The ECAP is recorded via the intracochlear electrodes of the implant; therefore, the neural potential is larger than the EABR and thus fewer averages are needed, which significantly reduces testing time.
Because the ECAP is an early-latency evoked potential, there are challenges associated with separating it from stimulus artifact. The specific methods used in present-day clinical software vary among manufacturers. It is helpful to understand how each of these artifact reduction methods works in order to make informed decisions about optimizing stimulation and recording parameters for clinical ECAP measurements. The different methods are described in greater detail in the following sections (Abbas et al., 1999; Hughes, 2006).
The Forward-Masking Subtraction Method
The forward-masking subtraction method exploits refractory properties of the auditory nerve to isolate stimulus artifact. This method has been described in detail in several publications (e.g., Abbas et al., 1999; Brown et al., 1990, 1998, 2000; Dillier et al., 2002). In this method, four stimulus conditions are presented: (1) probe stimulus alone, (2) masker stimulus followed by the probe, (3) masker stimulus alone, and (4) zero-current pulse to elicit system artifact (see traces A-D, respectively, in Figure 1). For the sake of simplicity, the first two conditions are the most important for a basic understanding of how this method works. These conditions are highlighted by the gray box in Figure 1. In the probe-alone condition (Fig. 1A), the probe recruits auditory nerve fibers in the vicinity of the stimulated electrode. The measured waveform contains the neural response as well as stimulus artifact. In the masker-plus-probe condition (Fig. 1B), the masker stimulus recruits the same auditory nerve fibers as in condition A (if the stimuli are presented to the same electrode at the same level). The probe is then presented shortly after the masker (typically about 0.4 ms later) within the refractory period of those fibers. As a result, only stimulus artifact (no neural response) is presumably recorded for the probe stimulus in condition B. If the response to the probe in condition B (i.e., artifact only) is subtracted from the response to the probe in condition A (i.e., neural response and artifact), then the neural response to the probe can be isolated from the stimulus artifact. The last two stimulus conditions in the 4-step process (C:masker alone and D: system artifact) are collected, and subtractions are applied to remove additional artifacts and the neural response to the masker in condition B.
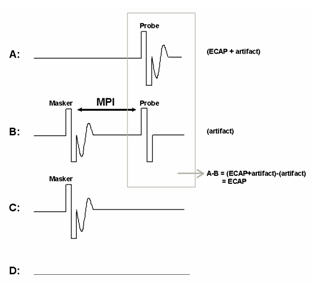
Figure 1. The forward-masking subtraction method. A: probe alone, B: masker followed by probe (MPI: masker-probe time interval), C: masker alone, D: zero-amplitude pulse to generate system artifact. The ECAP is resolved by applying the following subtraction: A-B+C-D.
One parameter that is unique to the subtraction method is the masker-probe interval (MPI; sometimes referred to as the masker advance or inter-pulse interval). This is the time between offset of the masker and onset of the probe in the masker-plus-probe condition. Ideally, the MPI should be sufficiently short to ensure that most auditory nerve fibers are fully within their refractory period (e.g., 300-500 msec). For routine clinical ECAP measures, the MPI is generally not changed unless the user is specifically measuring MPI effects (e.g., Brown & Abbas, 1990; Brown et al. 1990, 1998; Miller et al., 2000; Morsnowski et al., 2006; Shpak et al., 2004). Hughes (2006) provides a detailed discussion of stimulation and recording parameter changes as well as guidance on how to pick peaks and determine the ECAP threshold.
The Alternating Polarity Method
The alternating polarity method is similar to that used routinely for clinical ABR testing. With this method, responses are measured for negative-leading (cathodic) and positive-leading (anodic) biphasic pulses (see Fig. 2). As with acoustically evoked potentials, reversing the polarity of the stimulus results in reversing the polarity of the artifact. However, the polarity of the neural response remains the same. Upon averaging responses from both polarities, the majority of the stimulus artifact cancels out, leaving the neural response. One disadvantage to this method, however, is that ECAP amplitude and latency can be slightly different for cathodic versus anodic electrical stimulation (Miller et al., 1998). Thus, the averaged response amplitude and morphology may be different than that of either polarity alone. As a result, the averaged waveform for the alternating polarity method tends to be significantly smaller with a higher threshold than that obtained with the subtraction method (Hughes et al., 2003;Frijns et al., 2002).
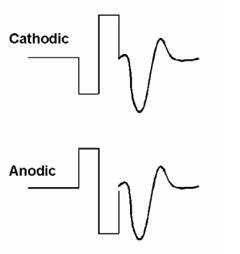
Figure 2. Example of the alternating polarity method to reduce stimulus artifact. The ECAP is resolved by averaging the two traces: (cathodic + anodic)/2.
Telemetry and Commercial Software
All newer CI systems are equipped with two-way telemetry capabilities that allow for quick and easy measurement of electrode impedance and the ECAP. Telemetry simply means data transmission via radio frequency from a source to a receiving station.
Neural Response Telemetry (NRT) is the ECAP telemetry software used with the last four generations of Cochlear Corporation (Lane Cove, New South Wales, Australia) devices (Nucleus 24M, Nucleus 24R, Nucleus 24RE "Freedom", and Nucleus CI512). NRT was first introduced in 1996 and FDA approved in 1998 as its own software application separate from the clinical programming software. Today, NRT has been integrated with the Nucleus Custom Sound clinical programming software (Custom Sound EP) so that ECAP threshold information can easily be used to aid in creating speech processor programs, or maps. NRT uses the forward-masking subtraction paradigm as the default artifact reduction method; however, alternating polarity is one of several other available options in the software.
Figure 3 shows a screen shot of the Advanced NRT feature within Custom Sound EP. The default screen setup shows a cascade of waveforms on the left, in this case, from an amplitude growth function. Waveforms from the highest stimulus level are at the top, with decreasing stimulus levels toward the bottom. The software has a built-in algorithm that marks the negative (N1) and positive (P2) peaks of the ECAP, calculates the peak-to-peak amplitude difference, and then plots that difference as a function of current level. This is called an amplitude growth function or an input-output function (right column, middle panel). The threshold (called T-NRT) is derived from a linear regression applied to the data points in the growth function. The T-NRT is the current level for an ECAP amplitude of zero, as predicted by the regression fit. In the example shown in Figure 3, the T-NRT is 189.8 CL (circled in red).
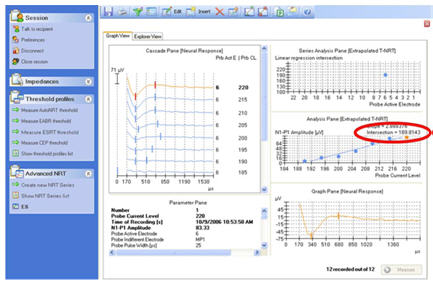
Figure 3. Screen shot of NRT. ECAP threshold of 189.8 CL (T-NRT) is circled in red.
Neural Response Imaging (NRI) is the ECAP telemetry feature for the last two generations of Advanced Bionics (AB; Sylmar, CA, USA) devices (Clarion CII, HiRes 90K). It was first introduced in 2001 and FDA approved in 2003 as an integrated part of the SoundWave clinical programming software. NRI uses alternating polarity for artifact reduction. Figure 4 shows a screen shot of NRI. A cascade view of the individual ECAP waveforms are shown in separate plots on the left side of the screen.
Like NRT, NRI has a built-in algorithm that marks the negative (yellow marker) and positive (green marker) peaks of the ECAP, calculates the peak-to-peak amplitude difference, and then plots that difference as a function of current level. The graph on the right shows the amplitude growth function with a linear regression fit (blue line). The filled circles represent the values used in the regression analysis. Open circles represent data points that are not included in the regression analysis (typically those with amplitudes less than 20 microvolts, because that is within the noise floor of this system). In the example shown in Figure 4, the ECAP threshold (termed tNRI) is 185 clinical units (CU; circled in red).
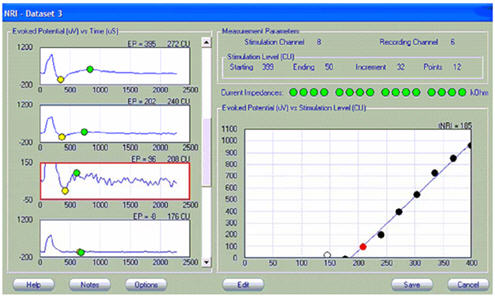
Figure 4. Screen shot of NRI. ECAP threshold of 185 CU (tNRI) is circled in red.
Auditory Nerve Response Telemetry (ART), is the ECAP telemetry feature for the newest Med-El (Innsbruck, Austria) CI/TI100 devices (Pulsar and Sonata). It was FDA approved in 2007 as an integrated part of the Maestro clinical programming software. Like NRI, ART uses alternating polarity for artifact reduction (default setting). Figure 5 shows a screen shot from ART. The top center panel shows a cascade view of the waveforms from a growth function, with the response from the highest current level at the top. As with NRT and NRI, ART has an automated algorithm that marks the negative (N) and positive (P) peaks of the ECAP, calculates the peak-to-peak amplitude difference, and then plots that difference as a function of current level. The bottom center panel shows the color-coded amplitude growth function and regression line. The ECAP threshold is indicated by the small symbol circled in red.
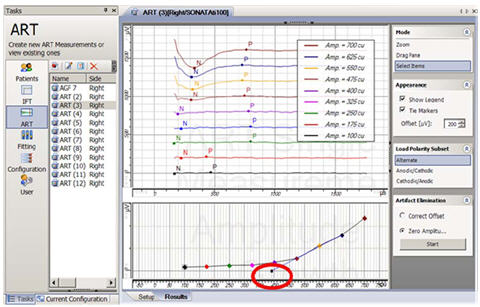
Figure 5. Screen shot of ART. ECAP threshold is circled in red.
Common Clinical Uses for ECAP Measures
Over the past decade there has been a steady increase in the number of studies addressing the clinical utility of ECAP measures. In general, ECAP measures are clinically useful for a number of applications, including:
- Objective verification of auditory nerve function in response to electrical stimulation
- Objective verification of electrode/device function
- Assistance in programming the speech processor for individuals who cannot provide reliable behavioral responses
- Verification or confirmation of the accuracy of questionable behavioral responses
Nucleus 24M, 250-pps SPEAK
- For children, ECAP thresholds generally fall between T- and C-level, thus they represent a level that should be audible but not uncomfortable (Di Nardo et al., 2003; Hughes et al., 2000).
- For adults, ECAP thresholds also generally fall between T- and C-level; however, for roughly 1/3 of this population ECAP thresholds may exceed C-level (Brown et al., 1998, 2000; Cafarelli Dees et al., 2005; Cullington, 2000; Smoorenburg et al., 2002; Franck & Norton, 2001).
- T-levels typically fall 22-29 CL below the ECAP threshold for children and adults
(Cafarelli Dees et al., 2005; Cullington, 2000; Hughes et al., 2000; Polak et al., 2005). C-levels typically fall 4-11 CL above the ECAP threshold for adults (Cafarelli Dees et al., 2005; Cullington, 2000; Hughes et al., 2000; Polak et al., 2005) and 21 CL above the ECAP threshold for children (Hughes et al., 2000). - In many cases, ECAP thresholds fall within approximately the same percentage of map dynamic range across electrodes within a subject (Hughes et al., 2000). For children, ECAP thresholds fall on average at 53% of the map dynamic range (Di Nardo et al., 2003; Hughes et al., 2000). For adults, ECAP thresholds fall closer to C-level: the average was at 91% of the MAP dynamic range (Brown et al., 2000; Di Nardo et al., 2003; Hughes et al.,2000).
- ECAP thresholds often follow a similar contour or shape to the map. When the contour of map levels across electrodes is different for T-levels versus C-levels within a subject, the ECAP will often mirror the shape of one of those functions, usually T-level (Hughes et al., 2001b). There are, however, cases in which the ECAP profile does not follow either the T- or C-level profile (e.g., Miller et al., 2008; Potts et al., 2007).
- Smoorenburg et al. (2002) showed that the tilt of the ECAP contour significantly correlates with the tilt of the T-level contour, but not with the C-level contour. This finding suggests that ECAP measures are better suited for predicting T-levels than C-levels. This conclusion was also supported by other studies (e.g., Franck & Norton, 2001).
- There is a moderate correlation between ECAP threshold and T-levels. Correlation coefficients vary across studies, ranging between r = 0.5 to 0.9 (Brown et al., 2000; Cullington, 2000; Di Nardo et al., 2003; Franck & Norton, 2001; Hughes et al., 2000; Polak et al., 2005; Smoorenburg et al., 2002; Thai-Van et al., 2001). The correlation between ECAP thresholds and C-levels varies more widely across studies, ranging from r = 0.1 to 0.9 (Brown et al., 2000; Cullington, 2000; Di Nardo et al., 2003; Franck & Norton, 2001; Hughes et al., 2000; Polak, et al., 2005; Smoorenburg et al., 2002; Thai-Van et al., 2001). These results suggest that ECAP measures alone are not reliable enough to set map levels directly.
- When ECAP thresholds for all electrodes are combined with a very limited amount of behavioral information, there is a significant correlation (r = 0.8 to 0.9) between measured and predicted T- and C-levels (Brown et al., 2000; Franck & Norton, 2001; Hughes et al., 2000). An example of the method used by Brown et al. (2000) and Hughes et al. (2000) is shown in Fig. 6.
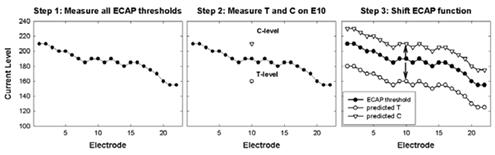
Figure 6.Example of ECAP-based method for predicting map levels (Brown et al., 2000; Hughes et al., 2000). Step 1: Measure ECAP thresholds on all electrodes. Step 2: Measure T- and C-levels on a single electrode (electrode 10 in this case). Step 3: Shift the ECAP function up to match up with the measured C-level on E10, and shift the ECAP function down to match up with the measured T-level on E10. The shifted ECAP profiles represent the predicted T- and C-levels.
Since that initial body of research was published, electrode designs have changed to emphasize perimodiolar position (e.g., addition of electrode positioning systems or pre-curved electrode arrays), the stimulation rate of speech processing strategies has increased, and NRI and ART (both using alternating polarity) were introduced for use with the AB and Med-El systems, respectively. Because all of these variables have an effect on behavioral threshold and/or ECAP measures, additional research has been conducted to further define the relation between ECAP thresholds and behavioral levels for these other variables (e.g., Alvarez et al., 2010; Botros & Psarros, 2010; Eisen & Franck, 2004; Han et al., 2005; Holstad et al.,2009; Jeon et al., 2010; Polak et al., 2005; Potts et al., 2007).
These further studies are important because perimodiolar electrode position has been shown to result in lower T- and/or C-levels when compared to traditional straight electrode arrays (Kreft et al., 2004; Parkinson et al., 2002; Saunders et al., 2002; Young & Grohne, 2001), which may (or may not) change the relation between behavioral levels and ECAP measures. In addition, behavioral thresholds and comfort levels tend to decrease with increased stimulation rate due to effects of temporal integration (e.g., Brown et al., 1999; Skinner et al., 2000). This will likely also affect the relation between behavioral levels and ECAP measures, because ECAP measures cannot be made using the faster stimulation rates that are used for behavioral levels. When the stimulation rate is increased, ECAP amplitude decreases (and thus the threshold increases) due to combined effects of refractory recovery time constants and neural adaptation. Thus we might expect that ECAP thresholds (obtained with traditional slow-rate stimuli) would be more likely to approximate or exceed C-level for these faster-rate strategies. Lastly, ECAP thresholds have been shown to differ when measured using alternating polarity versus a forward masking subtraction method (Eisen & Franck, 2004; Hughes et al., 2003).
Although research comparing ECAP thresholds to behavioral levels for different electrode designs, faster rates, and ECAP measurement techniques (e.g., NRI and ART) is still emerging, results from more recent studies found the following notable outcomes for the use of ECAP measures to assist with programming of newer CI technology.
Perimodiolar electrode positioning
- In general, ECAP thresholds, T-levels, and/or most-comfortable levels (M-levels) are lower for AB electrode arrays with a positioner than without (Donaldson et al., 2001; Eisen & Franck, 2004; Franck et al., 2001; Kreft et al., 2004; Young & Grohne, 2001).
- Results vary across studies as to whether there are significant differences in T-level, C-level, and/or ECAP threshold between the Nucleus 24M straight array and the perimodiolar Nucleus 24R(CS) Contour array. Some studies found significantly lower T- and C-levels in the Contour than in the straight array (Parkinson et al., 2002; Saunders et al., 2002), whereas other studies found no difference in the T-level, C-level, or ECAP threshold between the two device types (Hughes et al., 2001; Polak et al., 2005).
- Significant correlations exist between ECAP thresholds and both T-levels (r = 0.69) and C-levels (r = 0.76) for a 250-pps rate in the perimodiolar Nucleus Contour array (Polak et al., 2005). This result is similar to earlier findings reported for the Nucleus 24M straight array.
Advanced Bionics
- For the HiRes strategy, maps are typically created using speech bursts, which are delivered at a rate of approximately 3000 pps/channel across a group of four electrodes (bands) at a time (Akin et al., 2008). Correlations between single-electrode ECAP thresholds and banded M-levels range from 0.37-0.39 for basal E15, 0.55-0.83 for middle E11, 0.67-0.7 for middle E7, and 0.81-0.9 for apical E3 (Akin et al., 2008; Wolfe & Kasulis, 2008).
- Across all electrodes, there is a moderate correlation between ECAP thresholds and HiRes M-levels. Correlation coefficients across studies range from r = 0.56 to 0.74 (Eisen & Franck, 2004; Han et al., 2005; Jeon et al., 2010).
- The correlation between single-electrode ECAP thresholds and HiRes M-levels is stronger when M-levels are obtained with tone bursts (stimulation of individual electrodes) than with speech bursts (stimulation across a grouping of four adjacent electrodes): r = 0.56 for tone bursts vs. r = 0.39 for speech bursts (Jeon et al., 2010).
- The method used to determine the ECAP threshold affects the correlation between ECAP thresholds and behavioral levels. Han et al. (2005) reported a stronger correlation between ECAP thresholds and banded M-levels (speech bursts) for ECAP thresholds obtained using visual detection (r = 0.741) as opposed to the software default of linear regression (tNRI; r = 0.675).
- ECAP thresholds obtained with NRI tend to fall between T-level and M-level, but most commonly approximate or even exceed M-level for the high stimulation rates used with the Hi-Resolution (HiRes) processing strategy (Eisen & Franck, 2004; Han et al., 2005; Jeon et al., 2010).
- On average, single-electrode ECAP thresholds with NRI fall at 104% of M-level
obtained with speech bursts for pediatric HiRes users at initial stimulation. At 2-12 months post initial stimulation, ECAP thresholds fall at 110-115% of M-level for pediatric and adult HiRes users (Caner et al., 2007; Han et al., 2005). - Akin et al. (2006) reported intraoperative ECAP thresholds obtained with NRI are 203% of M-levels obtained at initial stimulation for HiRes-S (sequential) and 246% of M-levels for HiRes-P (paired).
- Like the results reported for 250-pps SPEAK, when ECAP thresholds are combined with a limited amount of behavioral information, there is a strong correlation between measured and predicted M-levels (r = 0.98; Eisen & Franck, 2004).
- ECAP thresholds with NRT tend to approximate or exceed C-level for faster rate processing strategies (e.g., 900-1800 pps ACE; Holstad et al., 2009; McKay et al., 2005; Potts et al., 2007).
- For faster-rate map levels, the correlation between ECAP thresholds and C-levels is stronger than the correlation between ECAP thresholds and T-levels (Botros & Psarros, 2010; Holstad et al., 2009; Potts et al., 2007).
- C-level profiles are generally flatter than T-level profiles (Botros & Psarros, 2010). In other words, there is less variability in C-levels across the array than there is for T-levels.
- As noted above, the method used to determine ECAP threshold affects the correlation between ECAP thresholds and behavioral levels. Like the findings from Han et al. (2005) for AB users, Potts et al. (2007) showed slightly better correlations between ECAP thresholds and C-levels when ECAP thresholds were obtained using visual detection (r = 0.69) as opposed to linear regression (T-NRT; r = 0.66) in adult recipients. In contrast to these findings, slightly better correlations were found using linear regression (TNRT) than with visual detection in pediatric recipients (Holstad et al., 2009).
- McKay et al. (2005) have published a helpful plot of equal-loudness curves that can easily be used for a first approximation of T- and C-levels for different rates of stimulation (see Figure 3, McKay et al., 2005).
- In general, as stimulation rate increases for behavioral levels, the correlation between ECAP thresholds and behavioral levels decreases (Botros & Psarros, 2010; Murray, 2001 as cited in McKay et al., 2005; Zimmerling & Hochmair, 2002).
- There is significant variability across electrodes and recipients in the relation between ECAP thresholds and T-/C-levels for faster stimulation rates (e.g., 900-1800 pps ACE); therefore, more complex prediction models are needed (Holstad et al., 2009; Potts et al., 2007). Botros and Psarros (2010) developed an ECAP-based fitting model that scales the ECAP profile as a function of level (i.e., predicts flatter functions at higher levels). Their scaled-ECAP model shows a better fit to behavioral T- and C-levels than a flat map (i.e., all T-/C-levels set equal to that of a single middle electrode), group mean data, and the model described above in Figure 6.
- There is a moderate correlation (r = 0.53) between ECAP thresholds and C-levels (obtained with a 50-msec, 1000-Hz pulse train) for Med-El Pulsar users (Alvarez et al., 2010).
- There is a stronger correlation between ECAP thresholds and C-levels for prelingually deafened users than for those postlingually deafened (Alvarez et al., 2010).
The results from these later studies suggest that ECAP thresholds can still be useful for programming with faster-rate strategies, various electrode array designs, and different types of artifact reduction methods or software (i.e., NRT vs. NRI or ART). However, as the stimulation rate of the speech processing strategy increases, ECAP thresholds are more likely to approximate or exceed the upper comfort level. Further, there is large variability in the relation between ECAP thresholds and map levels across the electrode array and across subjects. This means that ECAP thresholds alone, or those based on group norms, are not sufficient for predicting map levels on an individual basis.
Summary
ECAP measures are quickly and easily made in a clinical setting and are thus ideal for use with the pediatric population. ECAP thresholds can provide valuable objective information to assist with programming CI speech processors, regardless of device type or processing strategy used. The correlations between ECAP thresholds and behavioral levels are generally not strong enough to recommend using ECAP measures as a sole means to program the processor. However, ECAP thresholds can be especially useful when coupled with other objective measures such as the electrically evoked stapedial reflex threshold (Gordon et al., 2004a, 2004b; Polak et al., 2005; Wolfe & Kasulis, 2008) and/or limited behavioral information.
Further, ECAP thresholds represent a level at which the stimulus should be audible enough to begin conditioning a child to respond behaviorally. As research continues to emerge, more sophisticated models are being developed that provide more accurate ECAP-based predictors of behavioral map levels.
References
Abbas, P. J., Brown, C. J., Shallop, J. K., Firszt, J. B., Hughes, M. L., Hong, S. H., & Staller, S. J. (1999). Summary of results using the Nucleus CI24M implant to record the electrically evoked compound action potential. Ear and Hearing, 20, 45-59.
Akin, I., Kuran, G., Saka, C., & Vural, M. (2006). Preliminary results on correlation between neural response imaging and 'most comfortable levels' in cochlear implantation. The Journal of Laryngology & Otology, 120, 261-265.
Akin, I., Mutlu, M., Kuran, G., Dincer, H., Arnold, L. & Boyle, P. (2008). One-year results of the banded Neural Response Imaging study. Otology & Neurotology, 29, 635-638.
Alvarez, I., de la Torre, A., Sainz, M., Roldán, C., Schoesser, H., & Spitzer, P. (2010). Using evoked compound action potentials to assess activation of electrodes and predict C-levels in the Tempo+ cochlear implant speech processor. Ear and Hearing, 31, 134-145.
Botros, A. & Psarros, C. (2010). Neural Response Telemetry reconsidered: I. The relevance of ECAP threshold profiles and scaled profiles to cochlear implant fitting. Ear and Hearing, 31, 367-379.
Brown, C. J. & Abbas, P. J. (1990). Electrically evoked whole-nerve action potentials. II. Parametric data from the cat. Journal of the Acoustical Society of America, 88, 2205-2210.
Brown, C. J., Abbas, P. J., & Gantz, B. (1990). Electrically evoked whole-nerve action potentials: Data from human cochlear implant users. Journal of the Acoustical Society of America, 88 (3), 1385-1391.
Brown, C. J., Abbas, P. J., & Gantz, B. (1998). Preliminary experience with Neural Response Telemetry in the Nucleus CI24M cochlear implant. The American Journal of Otology, 19, 320-327.
Brown, C. J., Hughes, M. L., Lopez, S. M., & Abbas, P. J. (1999). Relationship between EABR thresholds and levels used to program the Clarion speech processor. Annals of Otology, Rhinology & Laryngology, 108 (Suppl. 177), 50-57.
Brown, C. J., Hughes, M. L., Luk, B., Abbas, P. J., Wolaver, A., & Gervais, J. (2000). The relationship between EAP and EABR thresholds and levels used to program the Nucleus 24 speech processor: Data from adults. Ear and Hearing, 21, 151-163.
Cafarelli Dees, D., Dillier, N., Lai, W. K., et al. (2005). Normative findings of electrically evoked compound action potential measurements using the Neural Response Telemetry of the Nucleus CI24M cochlear implant system. Audiology & Neurotology, 10, 105-116.
Caner, G., Olgun, L., Gültekin, G., Balaban, M. (2007). Optimizing fitting in children using objective measures such as neural response imaging and electrically evoked stapedius reflex threshold. Otology & Neurotology, 28, 637-640.
Cullington, H. (2000). Preliminary neural response telemetry results. British Journal of Audiology, 34, 131-140.
Di Nardo, W., Ippolito, S., Quaranta, N., Cadoni, G., & Galli, J. (2003). Correlation between NRT measurement and behavioural levels in patients with the Nucleus 24 cochlear implant. Acta Otorhinolaryngologica Italica, 23, 352-355.
Dillier, N., Lai, W. K., Almqvist, B., Frohne, C., Müller-Deile, J., Stecker, M., & von Wallenberg, E. (2002). Meaurement of the electrically evoked compound action potential via a neural response telemetry system. Annals of Otology, Rhinology & Laryngology, 111 (5), 407-414.
Donaldson, G. S., Peters, M. D., Ellis, M. R., Friedman, B. J., Levine, S. C., & Rimell, F L. (2001). Effects of the Clarion electrode positioning system on auditory thresholds and comfortable loudness levels in pediatric patients with cochlear implants. Archives Otolaryngology Head and Neck Surgery, 127, 956-960.
Eisen & Franck, (2004). Electrically evoked compound action potential amplitude growth functions and HiResolution programming levels in pediatric CII implant subjects. Ear and Hearing, 25, 528-538.
Franck, K. H. (2002). A model of a Nucleus 24 cochlear implant fitting protocol based on the electrically evoked whole nerve action potential. Ear and Hearing, 23, 67S-71S.
Franck, K. H. & Norton, S. J. (2001). Estimation of psychophyical levels using the electrically evoked compound action potential measured with the neural response telemetry capabilities of Cochlear Corporation's CI24M device. Ear and Hearing, 22,289-299.
Franck, K., Shah, U., Hayman, C., Peterson, J., & Marsh, R. (2001). Effects of electrode design on mapping levels in children. Poster presented at the 8th Symposium on Cochlear Implants in Children, February 28-March 3, 2001, Los Angeles, CA.
Frijns, J. H. M, Briaire, J. J., de Laat, J. A. P. M., & Grote, J. J. (2002). Initial evaluation of the Clarion CII cochlear implant: Speech perception and neural response imaging. Ear and Hearing, 23, 184-197.
Gordon, K. A., Papsin, B. C., & Harrison, R. V. (2004a). Toward a battery of behavioral and objective measures to achieve optimal cochlear implant stimulation levels in children. Ear and Hearing, 25, 447-463.
Gordon, K. A., Papsin, B. C., & Harrison, R. V. (2004b). Programming cochlear implant stimulation levels in infants and children with a combination of objective measures. International Journal of Audiology, 43, S28-S32.
Han, D.-M., Chen, X.-Q., Zhao, X.-T., Kong, Y. Li, Y.-X., Liu, S., Liu, B., & Mo, L.-Y. (2005). Comparisons between Neural Response Imaging thresholds, electrically evoked auditory reflex thresholds and most comfortable loudness levels in CII Bionic Ear users with HiResolution sound processing strategies. Acta Oto-Laryngologica, 125, 732-735.
Holstad, B., Sonneveldt, V. G., Fears, B. T., Davidson, L. S., Aaron, R. J., Richter, M., Matusofsky, M., Brenner, C. A., Strube, M. J., & Skinner, M. W. (2009). Relation of electrically evoked compound action potential thresholds to behavioral T- and Clevels in children with cochlear implants. Ear and Hearing, 30, 115-127.
Hughes, M. L. (2006). Fundamentals of clinical ECAP measures in cochlear implants Part 2: Measurement techniques and tips. Audiology Online, November 6, 2006, Article 1717.
Hughes, M. L., Abbas, P. J., Brown, C. J., Etler, C., Behrens, A., & Dunn, S. (2003). "Comparison of two methods used to measure the ECAP in subjects implanted with the Clarion CII device." Paper presented at the Third International Symposium and Workshops on Objective Measures in Cochlear Implants, Ann Arbor, MI, June 26-28, 2003.
Hughes, M. L., Abbas, P. J., Brown, C. J., Seyle, K., & South, H. (2001a). Assessing spatial spread in straight and modiolar hugging electrode arrays. Poster presented at the 8th Symposium on Cochlear Implants in Children, February 28-March 3, 2001, Los Angeles, CA.
Hughes, M. L., Brown, C. J., Abbas, P. J., Wolaver, A. A., & Gervais, J. P. (2000). Comparison of EAP thresholds with MAP levels in the Nucleus 24 cochlear implant: Data from children. Ear and Hearing, 21, 164-174.
Hughes, M. L., Vander Werff, K. R., Brown, C. J., Abbas, P. J., Kelsay, D. M. R., Teagle, H. F. B., & Lowder, M. W. (2001b). A longitudinal study of electrode impedance, the electrically evoked compound action potential, and behavioral measures in Nucleus 24 cochlear implant users. Ear and Hearing, 22, 471-486.
Jeon, E. K., Brown, C. J., Etler, C. P., O'Brien, S., Chiou, L.-K., & Abbas, P. J. (2010). Comparison of electrically evoked compound action potential thresholds and loudness estimates for the stimuli used to program the Advanced Bionics cochlear implant. Journal of the American Academy of Audiology, 21, 16-27.
Kreft, H. A., Donaldson, G. S., & Nelson, D. A. (2004). Effects of pulse rate on threshold and dynamic range in Clarion cochlear implant users. Journal of the Acoustical Society of America, 115, 1885-1888.
McKay, C. M., Fewster, L., & Dawson, P. (2005). A different approach to using Neural Response Telemetry for automated cochlear implant processor programming. Ear and Hearing, 26, 38S-44S.
Miller, C. A., Abbas, P. J., & Brown, C. J. (2000). An improved method of reducing stimulus artifact in the electrically evoked whole-nerve potential. Ear and Hearing, 21, 280-290.
Miller, C. A., Abbas, P. J., Rubinstein, J. T., Robinson, B. K., Matsuoka, A. J., & Woodworth, G. (1998). Electrically evoked compound action potentials of guinea pig and cat: Responses to monopolar, monophasic stimulation. Hearing Research, 119, 142-154.
Miller, C. A., Brown, C. J., Abbas, P. J., & Chi, S.-L. (2008). The clinical application of potentials evoked from the peripheral auditory system. Hearing Research, 242, 184-197.
Morsnowski, A., Charasse, B., Collet, L., Killian, M., & Muller-Deile, J. (2006). Measuring the refractoriness of the electrically stimulated auditory nerve. Audiology & Neurotology, 11, 389-402.
Parkinson, A. J., Arcaroli, J., Staller, S. J., Arndt, P. L., Cosgriff, A., & Ebinger, K. (2002). The Nucleus 24 Contour cochlear implant system: Adult clinical trial results. Ear and Hearing, 23, 41S-48S.
Polak, M., Hodges, A., & Balkany, T. (2005). ECAP, ESR and subjective levels for two different Nucleus 24 electrode arrays. Otology & Neurotology, 26, 639-645.
Potts, L. G., Skinner, M. W., Gotter, B. D., Strube, M. J., & Brenner, C. A. (2007). Relation between Neural Response Telemetry thresholds, T- and C-levels, and loudness judgments in 12 adult Nucleus 24 cochlear implant recipients. Ear and Hearing, 28, 495-511.
Saunders, E., Cohen, L. Aschendorff, A., Shapiro, W., Knight, M., Stecker, M., Richter, B., Waltzman, S., Tykocinski, M., Roland, T., Laszig, R., & Cowan, R. (2002). Threshold, comfortable level, and impedance changes as a function of electrodemodiolar distance. Ear and Hearing, 23, 28S-40S.
Shallop, J. K., Facer, G. W., & Peterson, A. (1999). Neural response telemetry with the CI24M cochlear implant. The Laryngoscope, 109, 1755-1759.
Shpak, T., Berlin, M., & Luntz, M. (2004). Objective measurements of auditory nerve recovery function in Nucleus CI 24 implantees in relation to subjective preference of stimulation rate. Acta Otolarygologica, 124, 582-586.
Skinner, M. W., Holden, L. K., Holden, T. A., & Demorest, M. E. (2000). Effect of stimulation rate on cochlear implant recipients' thresholds and maximum acceptable loudness levels. Journal of the American Academy of Audiology, 11, 203-213.
Smoorenburg, G. F., Willeboer, C., & van Dijk, J. E. (2002). Speech perception in Nucleus CI24M cochlear implant users with processor settings based on electrically evoked compound action potential thresholds. Audiology & Neurotology, 7, 335-347.
Thai-Van, H., Chanal, J.-M., Coudert, C., Veuillet, E., Truy, E., & Collet L. (2001). Relationship between NRT measurements and behavioral levels in children with the Nucleus 24 cochlear implant may change over time: preliminary report. International Journal of Pediatric Otorhinolaryngology, 58, 153-162.
Wolfe, J. & Kasulis, H. (2008). Relationships among objective measures and speech perception in adult users of the HiResolution Bionic Ear. Cochlear Implants International, 9(2), 70-81.
Young, N. M. & Grohne, K. M. (2001). Comparison of pediatric Clarion recipients with and without the electrode positioner. Otology & Neurotology, 22, 195-199.
Zimmerling, M. J. & Hochmair, E. S. (2002). EAP recordings in Ineraid patients -correlations with psychophysical measures and possible implications for patient fitting. Ear and Hearing, 23, 81-91.