
Learning Objectives
After this course, participants will be able to:
- List at least 4 items that can be logged via Data Logging.
- Identify at least two ways of using information in the Data Log to enhance patient counseling regarding amplification.
- Identify at least two ways of using information in the Data Log to make programming adjustments for the patient.
Introduction
The term data logging can be traced back to sailors hundreds of years ago. Men at sea devised a method to measure the speed of their vessel. They would cast a big wooden block, which they called a log, over the stern of their vessel. The log was attached to a rope with knots in it every 47 feet. By timing how fast the knots would pass through their hands, they were able to determine the speed of the vessel. They would take this data, and record it into a log book.
Data Logging - Hearing Aid Applications
Data logging allows for the collection and analysis of hearing aid data as it pertains to user habits, device integrity, environmental classification and feature engagement. The purpose of the Data Log encompasses a few different things. It can provide objective information regarding how hearing aids are being used and the different listening environments users are exposed to on a daily basis. The data also provides a great way for identifying topics for counseling and ways to customize the programming of the hearing aids to best meet the needs of each lifestyle. The Data Log will provide you with objective information; your patient will give you subjective information. You're getting information from both sides to make sure that it all looks similar. If there are any discrepancies, you can address them and customize the hearing experience for your patient. Data Logging is another tool that you can use to personalize the experience for the patient, and help patients to hear better in the situations in which they want to hear.
Today, I'm going to focus on how Data Logging can be used for counseling, fine tuning, and troubleshooting. I will also provide case studies to illustrate how Data Logging can be used in the real world.
When counseling patients, we can use Data Logging for many things. For example, we can use it to highlight the sophistication of the technology. As hearing care professionals, we know hearing aids are not simply amplifiers; they are intelligent products that process, filter and refine sounds and noises. The evidence recorded in the Data Log is beneficial to show the patient everything that the hearing aid is doing for them, so they can gain an appreciation of their devices' complexity. This information can also be used show the value of the cost hearing aids, and the patient's need for advanced technology. We can respond to the commonly asked question, "Why are hearing aids so expensive?" by showing patients all of the background processing that their hearing aids are doing on a daily basis. Additionally, Data Logging can reveal a lot about the user's habits; you can use that data to counsel patients on how to improve their listening environments. It may be that they don't know how to optimize their hearing aids for specific environments; you can instruct them on the best settings for those situations.
Counseling can be divided into two different sections: pre-fitting and post-fitting. During the pre-fitting session, we can emphasize how intelligent these products are, and how they can improve listening situations for our patients. For example, in 2016, Starkey launched their Synergy Platform, which is a tiny little chip that has more processing power than the Apollo 11 rocket. Sharing this story with our patients will illustrate the power of these devices, and will help instill patient confidence during the trial period. With information gathered from the Data Log, we can make appropriate adjustments to the hearing aids to optimize the patient's daily listening environments. The Data Log will also be useful to facilitate collaboration during the adjustment period, taking into account the patient's subjective feedback as compared to the recorded objective information.
At the post-fitting, when the patient comes in for their follow-up appointment, you can use information gathered from Data Log to analyze their habits. Are they wearing their hearing aids all day? If not, why not? Do they experience any type of discomfort? Is it helping, or not? Are they using all the programs available? Do they need more programs? You can also use Data Log to reinstruct them on hearing aid features. Maybe they have multiple memories and they don't know how to access them. Do they know how to operate volume control? Perhaps they need a Surflink wireless accessory to help out with those difficult listening environments. Data Log information can also be used to discuss whether the patient requires more advanced technology. For instance, you may have a patient who is debating between getting an i.e., product versus an i2400 product, and they decide to start off with that i.e., product. You can use the Data Log from their trial period to show them the results from the i.e.,, as compared to what a more advanced product, like the i2400, can offer them.
In addition to counseling, Data Log is useful for fine tuning and troubleshooting (e.g., adding programs and memories, adding different features or wireless accessories, making adjustments to feature or signal processing characteristics of the hearing aid).
Data Log - Inspire Software
Within Starkey's Inspire Software, the Data Log screen is divided into three different sections: Summary View, Self Learning, and LifeScape Analyzer. We will review each of these sections, and along the way, we will examine some case studies to illustrate possible patient scenarios.
Summary View
Upon logging into the Inspire software, the navigation bar is broken into three categories: Pre-Fitting, Get Started and Fitting. Data Logging is under the Fitting section. Within the Data Log section, if you click on Summary View, it will take you to the screen as shown in Figure 1.
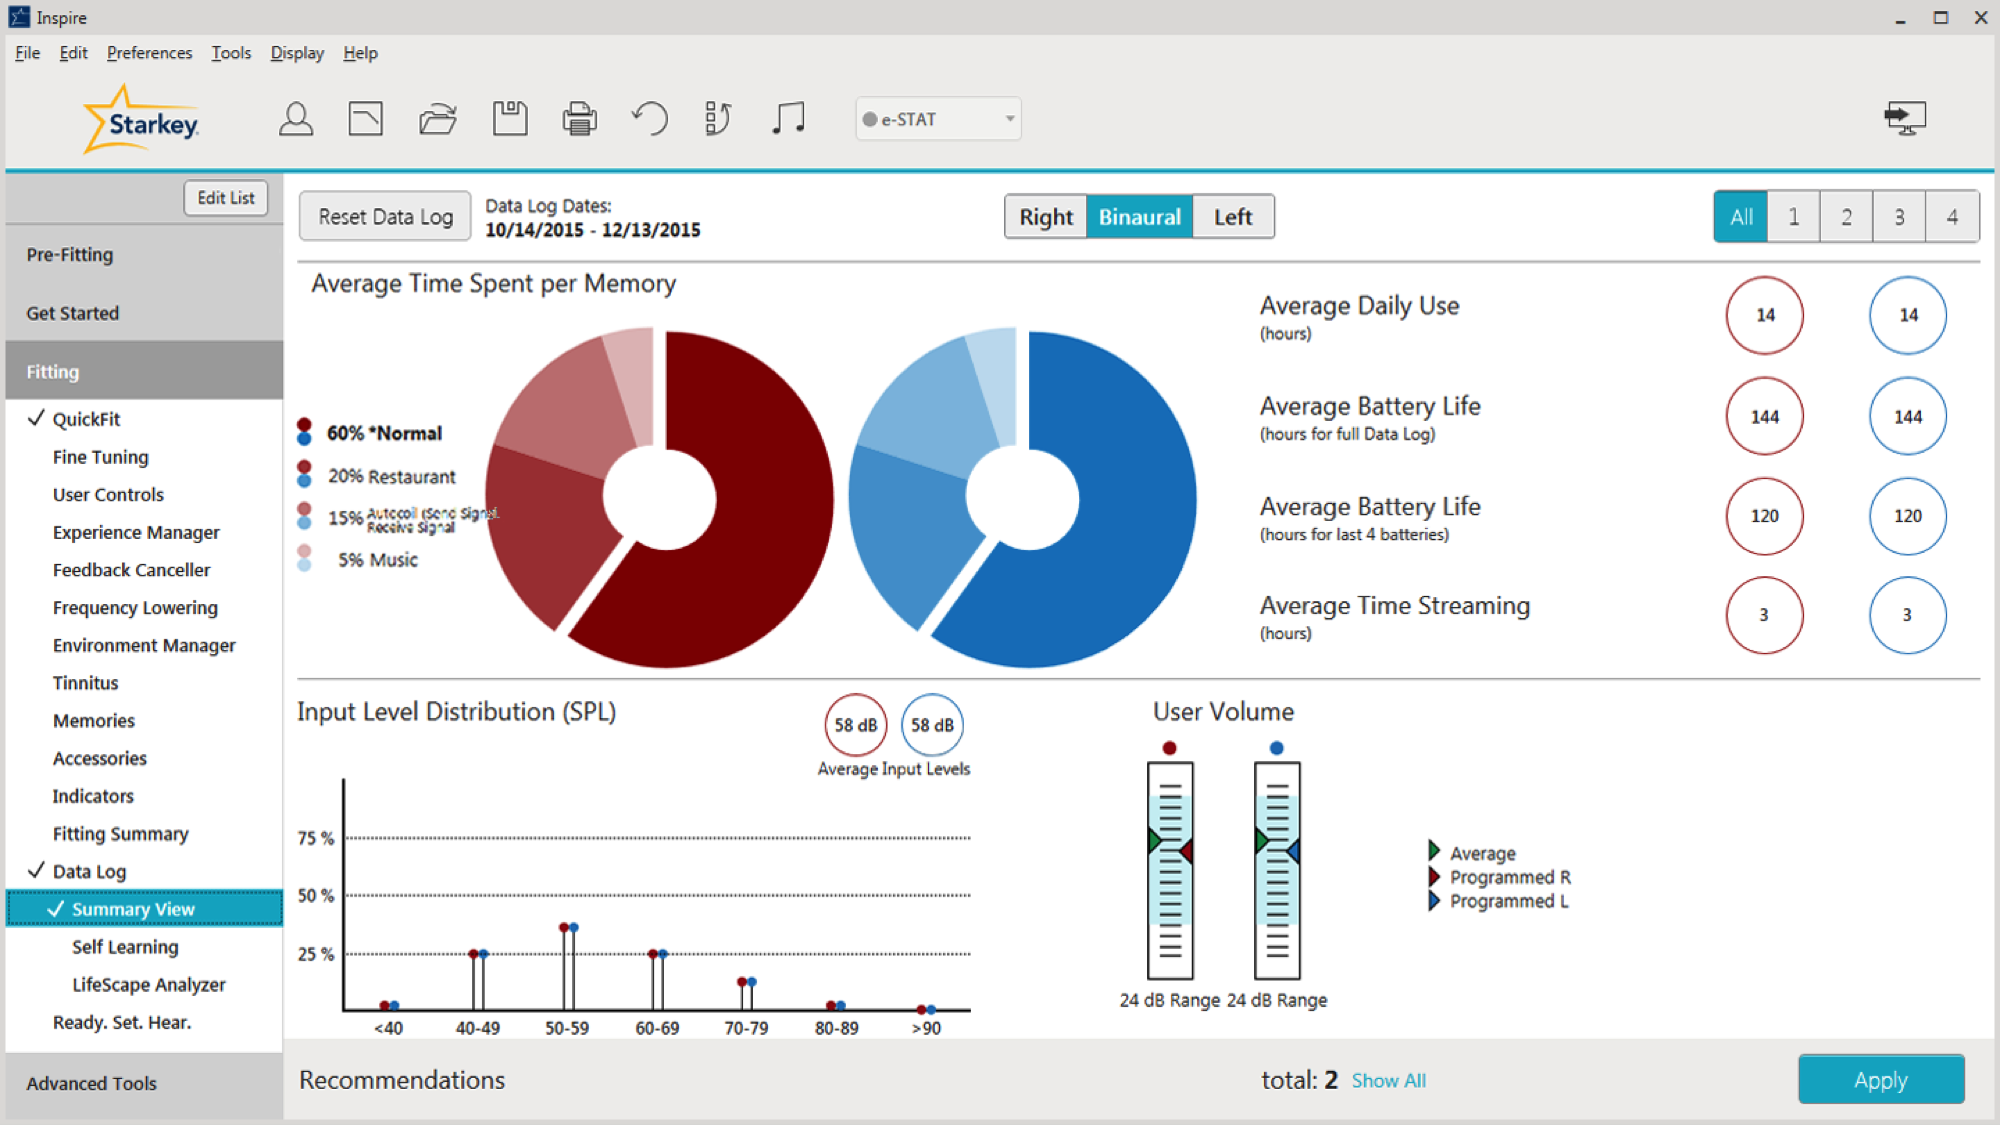
Figure 1. Summary View screen preview.
Average Time Spent Per Memory
In Figure 2, we can see a breakdown of the average time that the patient spends in each program. According to the pie graph in Figure 2, they spend about 60% of their time in Normal memory, 20% of the time in a Restaurant Program, 15% of the time in a Phone Program, and 5% of the time in their Music Program.
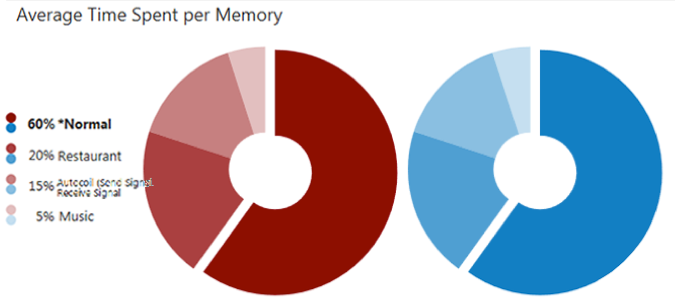
Figure 2. Average time spent per memory.
Let's say you have a patient who spends about 20% of their time in their Normal Program, and 65% of their time in their Crowd Program. They come into your office and say they're doing well, but they spend a lot of time outside. They have noticed that they're having a little bit more difficulty in wind, and they'd like you to make an adjustment for wind. Knowing that they use Crowd Memory 65% of the time, we can ask them further questions to clarify their needs. Ask them if they are using Crowd Memory more when they are outside, or if they are using Normal Memory. This can help us target the appropriate program that needs to be adjusted for wind.
Case Study: Patient is Only Using Memory 1. In this case, the Data Log shows the patient is only using Memory 1, although he has other programs available. First, we can talk to the patient and makes sure he understands the difference between the programs. It may be that he doesn't know the appropriate situations in which to use those programs. He may need re-instruction on how to switch memories via the the user controls on his hearing aids, or using the remote control or wireless accessory. It may be that he is fine with only one program, and we can disable the other two programs if they are not necessary.
Looking back to the Summary screen, in the upper right-hand corner, you have the ability to toggle between memories (Figure 3). If you click "All", you will see a cumulative picture of what all the programs are doing, on average (e.g., how much the person is turning up his hearing aid). If you want to get specific on a per memory basis, you can click on one, two, three or four, and you'll get information on that specific program/memory. You're going to see the biggest change as you toggle between the Memories in your Input Level Distribution and User Volume.
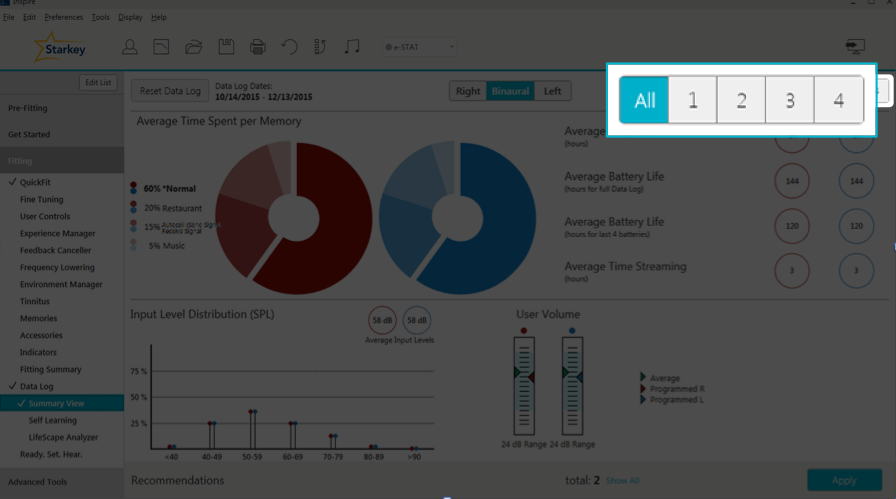
Figure 3. Toggling between memories.
Average Daily Use
Also on the Summary screen, you can see the patient's Average Daily Use (how many hours per day your patient is using their hearing aids). There are many different ways you can use this data for troubleshooting, fine tuning and counseling.
Case Study: Hearing Aids Only Used a Few Hours Per Day. In this case study, the Data Log shows that the hearing aids are only being used a couple of hours each day. When counseling the patient, find out why they are not wearing their hearing aids all day. Are the hearing aids performing poorly? Are they not meeting the user's needs? Does the patient have realistic expectations? Do they think that they're only supposed to wear their hearing aids as needed in difficult listening environments? Has the patient experienced a change in lifestyle with new communication demands and the hearing aids need to be reprogrammed? Maybe the patient has been ill and unable to wear his hearing aids. Maybe there are comfort issues keeping the patient from wearing their hearing aids (e.g., they are too loud and we need to turn them down or turn on the Automatic Experience Manager). Perhaps the patient is experiencing physical discomfort or pain (e.g., the ear molds are too loose, or they're too tight and causing soreness). Or, they might simply be having trouble getting their hearing aids in and out of their ears. Knowing the average daily use is a good discussion starter in counseling a patient and working through the reasons why they only wear their devices for a few hours per day.
Case Study: The Data Log shows significantly less usage than verbally reported. Our patient tells us they're wearing their hearing aids eight hours a day, but the data log shows only three hours a day. Why is there a discrepancy? It may be that they didn't realize they were using a dead battery. Another possibility is that they are trying to please you and their family members by appearing compliant when in reality, they are not. In this case, it might be that their hearing aids are set too loud in most environments. Again, you can turn the volume down, or set their Auto Experience Manager at a level one and turn on the automatic portion of it so it slowly turns up to hit your targets.
Case Study: Data Log shows significantly more use than verbally reported. The patient reports using their hearing aids 12 hours per day, but the data log shows 24 hours of use. Your first guess may be to ask the patient if they are opening the battery door at night. That would be my first guess as well, and my first question to the patient. Perhaps we need to re-instruct them on how to open and close that battery door.
Average Battery Life
Average battery life can be tracked using two different metrics: hours for full Data Log and hours for the last four batteries (Figure 4). When looking at the hours for full Data Log, that averages the battery life of all the batteries used since the last reset of the Data Log. For example, your patient hasn't been in for a year and they're coming in for their yearly follow-up appointment. They are wearing their 312s and they change their batteries once a week. In that case, the average battery life hours for full Data Log is going to tell you the average battery life for approximately 52 batteries.
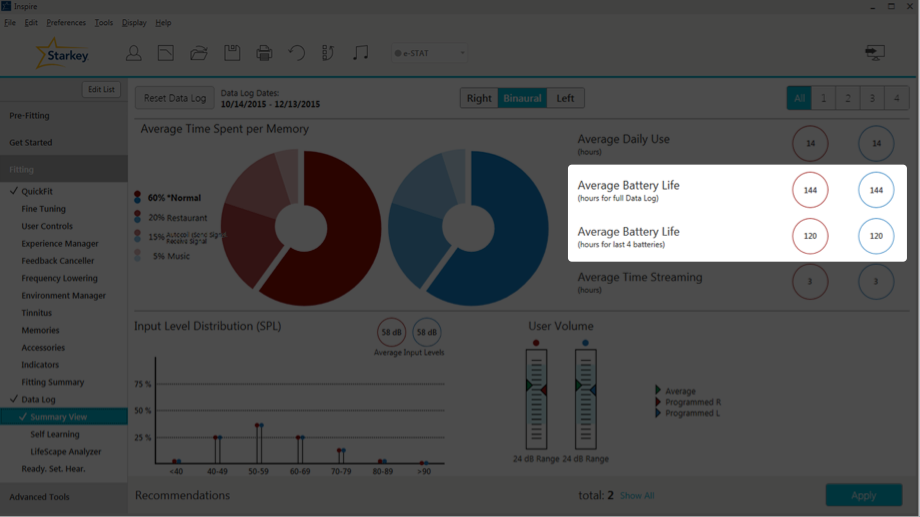
Figure 4. Average battery life.
As one might expect, the average battery life hours for last four batteries gives you the average battery life for the last four batteries. Looking again at Figure 4, for this user, there is a discrepancy between the two different types of battery life. We have 144 hours for full Data Log, and 120 for the last four batteries. That's a 24-hour difference or two to three days of patient wear time. You might want to question what is going on. It might be that your patient recently bought a Surflink wireless accessory (e.g., Surflink Media 2) and they're streaming six or seven hours a day, causing the average battery life for the last four batteries to be significantly lower. Maybe they had a bad battery pack that is causing power drainage. We also need to consider that there might be some type of malfunction in the hearing aid circuit that requires further investigation.
For the most accurate analysis of battery life, we recommend having the patient wait for the low battery indicator in each instrument prior to changing the battery. In the real world, we typically instruct our patients that when one battery indicates low battery, they should change both. I used to tell patients that they would get about a week on a set of batteries, and to change them on the same day each week as part of their routine (e.g., every Sunday before church, every Friday before playing cards with friends). However, if your patient reports that they're not getting as much life out of their batteries as before, that's when I would recommend resetting the Data Log and having them wait for that low battery indicator before changing the batteries. I'd also recommend that they wait for each hearing aid's battery indicator light to activate before changing the battery, and not changing both batteries at the same time. That way if there's a discrepancy between hearing aids, you'd be able to see that as well.
Average Time Streaming
When looking at the Summary Screen, the Average Time Streaming is located directly under Average Battery Life (Figure 5). In the case of this particular patient, they spend three hours a day streaming. With regard to the Muse products, the Average Time Streaming indicates how much time in total they spend streaming from all their Surflink wireless accessories combined; if they have more than one wireless accessory, the usage is averaged out between all of the devices. If the patient uses Halo products, the data log will show the average time streaming per day from their phone, their iPad, their iPod, and other wireless devices. This is great information for troubleshooting, especially for patients complaining about short battery life. If you can see the in the data log that they're streaming seven or eight hours a day, mystery solved. Streaming consumes more battery power than basic hearing aid functions. If your clients are spending a lot of time in their streaming programs, you can use that to facilitate counseling and ask how they're doing with their streaming (e.g., if they like the sound quality of streaming, if they need any adjustments). We can make adjustments to their Stream Boost Memory as needed.
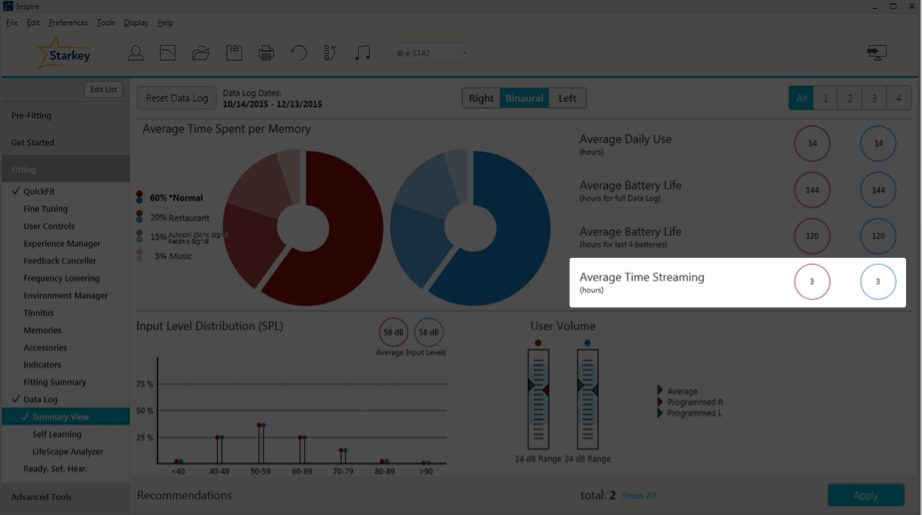
Figure 5. Average time streaming.
Input Level Distribution
At the very bottom left of the Summary View page, is the Input Level Distribution (Figure 6). The Input Level Distribution identifies the sound that's coming into the hearing aid microphones and how loud it is. An Input Level Distribution under 50 dB SPL is indicative of an environment that has little or no speech. When you see levels over 80 dB SPL, that can lead to a discussion about using hearing protection in noisy environments. On average, you want to see about 60 dB SPL, because that's about conversational level. On the graph in Figure 6, the average input level is 58 dB, with a nice rounding between 40 and 79 dB SPL, which is good.
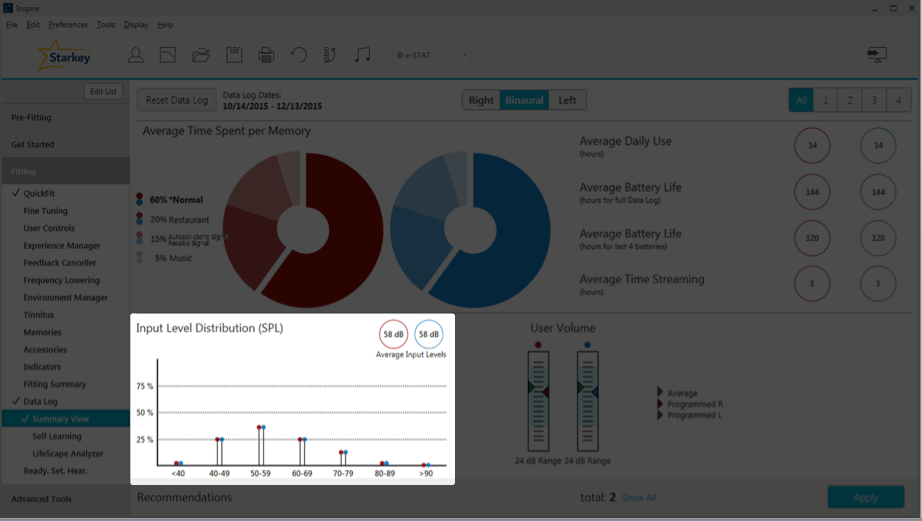
Figure 6. Input level distribution.
Case Study: Data Log shows patient is in a quiet environment (40-49 dB SPL) most of the time, with some spikes to 80-89 dB SPL. The majority of the time, this retired older patient is at home alone, reading, cooking and cleaning. However, on the weekend she's a social butterfly, and she will be in louder situations that spike to the upper 80s. She sometimes complains that she still has trouble in noise. We can use that as a counseling tool to inform her about auditory rehab. In other words, counsel her about adding some background noise when she is at home alone. That way, she can get used to having that noise and her brain can make that adjustment. To optimize hearing for people with hearing loss, aural rehabilitation is needed in addition to hearing aids.
Case Study: Data Log shows that the average input is over 80 dB SPL. With this patient, we probably want to talk about the need for hearing protection in loud situations. They already have hearing loss; if they're in these loud environments all the time, we need to do something to protect their hearing. We also might want to ask them about loudness discomfort. Are the situations getting too loud for you? Ask them about any annoyances they might be experiencing in these environments. Starkey does recommend putting UCLs into the patient's NOA Audiogram because we will take that into account when we're fitting the patient's hearing aids and creating the targets for ESTAT. When you have a patient who is commonly in these loud environments, it will help with that loudness discomfort aspect of it.
User Volume
Within the Data Log, when you look at User Volume (Figure 7), if you hover over any of these bars, it's going to show you the average change from the program settings. In this case, the average value is 2 dB louder than the programmed value. In other words, your patient is turning up their hearing aids by 2 dB every time, on average. Underneath the user volume bars, you can also see the volume range for this patient's hearing aids (24 dB). As you may already know, in the software under User Controls, you can control that volume range for your patients. If they have a fluctuating hearing loss, you can give them a larger volume range; or, if you don't want them to have a very large range for volume changes, you can give them something as low as a 2 dB volume range.
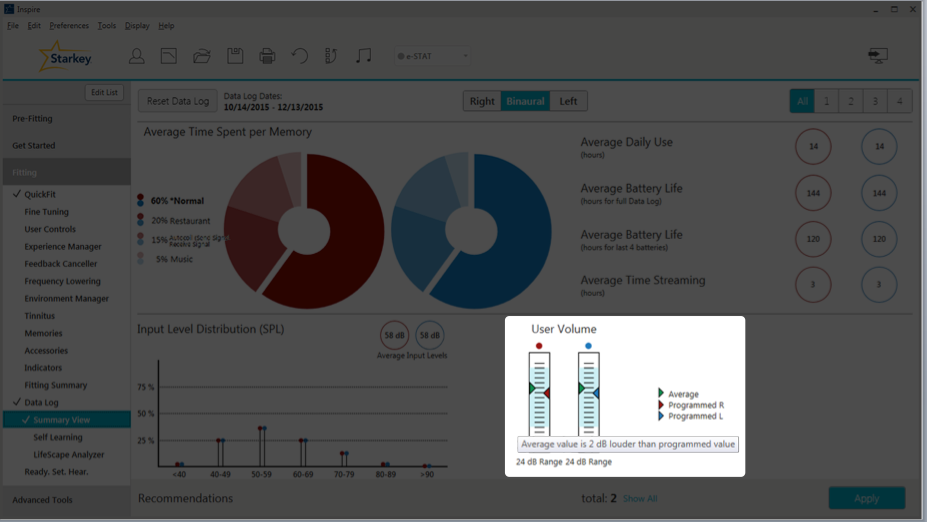
Figure 7. User volume.
If you have enabled the Tinnitus Stimulus for your patient, and they have a user control to change that level of that Tinnitus Stimulus, next to User Volume you will see the Tinnitus Level (Figure 8). If you hover your cursor over the bar, you will see the volume range of that Tinnitus Stimulus, how much they can turn it up and turn it down. If they're making any changes, it will show up here as well.
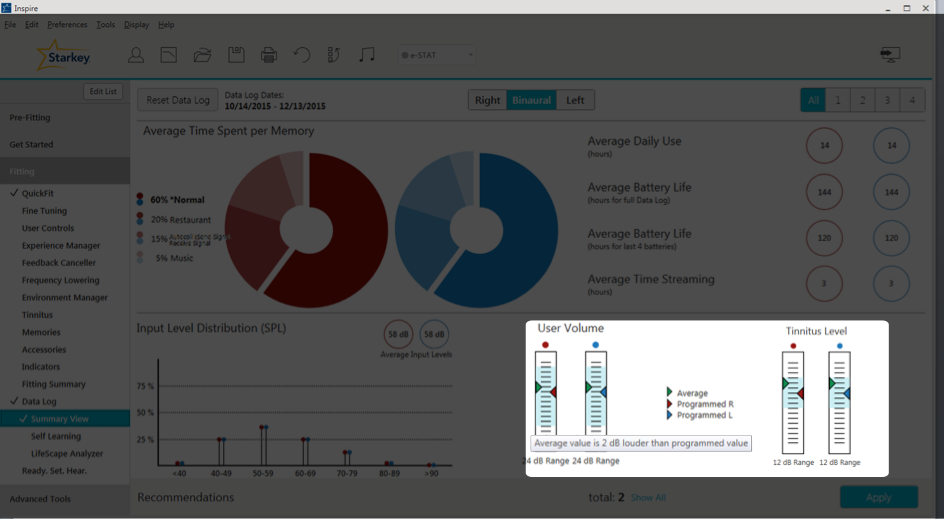
Figure 8. User volume and tinnitus level.
Self Learning
The next section within the Data Log in the Inspire software is Self Learning. Self Learning is a gradual and automatic way that the hearing aids learn your patient's volume control preferences in each active memory, based on the patient's volume adjustments. Over time, the hearing aids will automatically make those changes for the user. When we released the Z Series, we added the Automatic Experience Manager. Both the Self Learning and Automatic Experience Manager are useful tools for different situations. Self Learning is based on the patient's usage habits; the hearing aids will learn what they need to do. For patients who are new users, you can use that Automatic Experience Manager and set them at a level one or two, and gradually turn them up to target.
If you do enable Self Learning with normal memory, it takes about 12 hours before that adjustment is made. If the patient goes home and turns the hearing aids up, and if over 12 hours we notice that they're always listening to their hearing aids 2 dB louder than where you have it programmed, the hearing aid will automatically make that adjustment. In all other memories (i.e., everything besides their Star Normal Program), there is a two-hour learning window. Data for Self Learning is only available when the Volume Self Control is enabled. You also do have the ability to reset that Self Learning, so if it has made adjustments and you don't want to go back to that programmed value where you had it in the beginning, you have the option to do that.
On the Self Learning screen (Figure 9), the black line represents our programmed gains. We can see that for Memory 1 (Normal), Memory 3 (Crowd), and Memory 4 (Car) it indicates "N/A," meaning the patient hasn't been making many volume changes in those settings. However, in Memory 2, their Meeting Memory, we can see they've been turning it down by about 2 dB. At this point, the hearing aid has automatically turned the gain down for that program by 2 dB. Now if the patient would prefer to go back to the programmed settings that you had entered at the previous session, you can click that button labeled "Reset to Programmed User Volume" and it will reset it back to where it was.
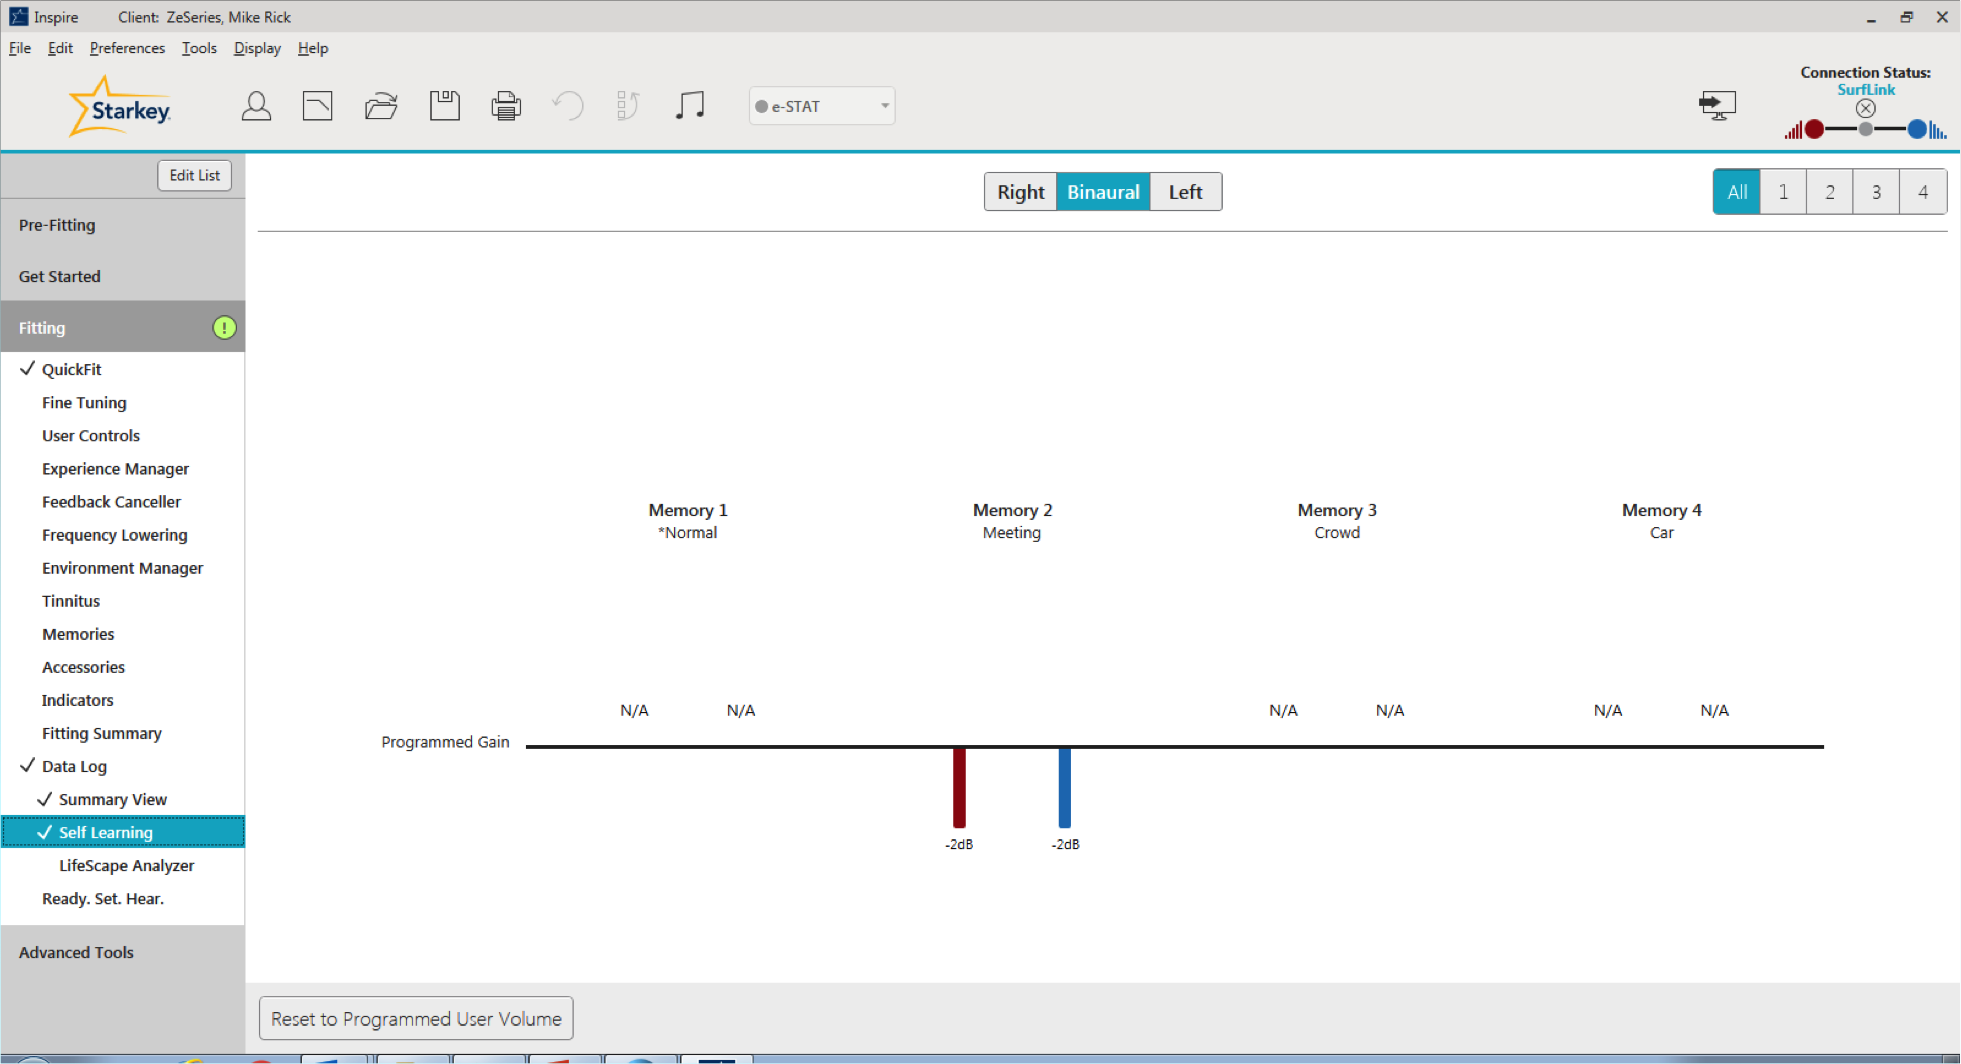
Figure 9. Self Learning screen.
LifeScape Analyzer
The final option that you can select within the Data Log is the LifeScape Analyzer (Figure 10). This screen contains a lot of information that examines in detail what the hearing aid is doing. Note that on the right-hand side, you still have the ability to toggle between your memories. All of the information on the LifeScape Analyzer page is going to be on a per memory basis (there is not an all cumulative view for this page). On the top left-hand side, you have Time Spent per Sound Class. This indicates how the hearing aid classifies the patient's sound environments, and how much time they spend in each sound class. I'd like to point out that these percentages will not add up to 100% because we do have classifications of multiple sound classes at the same time.
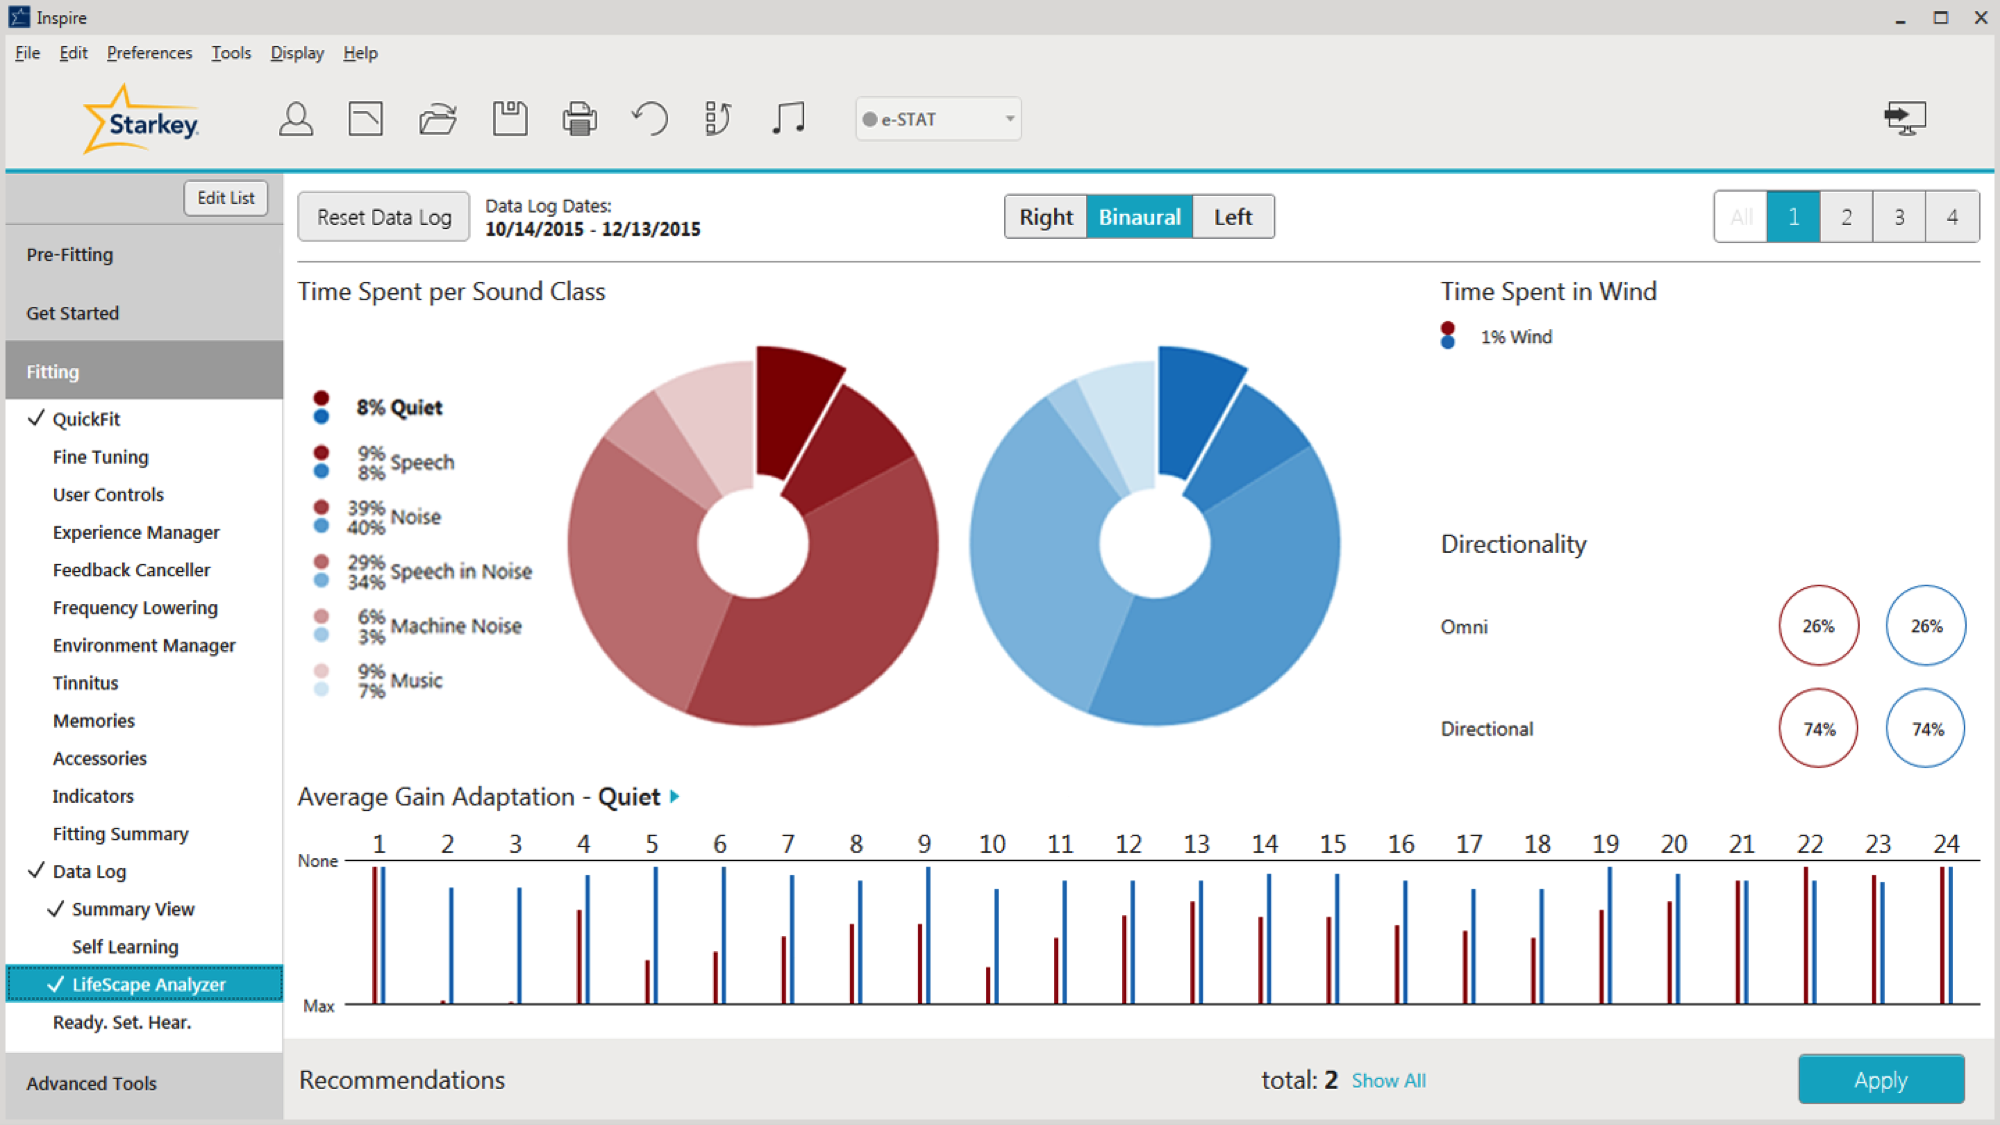
Figure 10. LifeScape Analyzer.
Sound Classification
Prior to the Synergy launch, we were able to classify sounds into six individual categories: Wind, Quiet, Speech, Speech in Noise, Machine Noise, and Noise. With this new release, we have expanded our sound classification strategy to include a seventh category for music, to address the unique attributes of music signals. We have also added a new degree of sophistication: Wind can now classify and adapt in parallel with all other sound classes (except for Quiet). This is an important step forward because wind can occur with other sound classes, and the ability to provide dual classification in windy environments will lead to more noise control and greater comfort for our patients than ever before. Acuity LifeScape Analyzer's seven sound classes can handle multiple environments simultaneously, allowing us to deliver our most sophisticated and accurate classification and automatic adaptation system to date. The end result is better signal management and sound quality in all environments.
When we compare our previous generation sound classification strategy with the improvements provided by Synergy and Acuity OS, we’we have improved our time-averaged sound classification accuracy to 90%. Greater accuracy equates to more appropriate signal processing and happier patients. Our ultimate goal is for our patients to be hearing well, happy with our product, and making referrals to families and friends.
Directionality
Next on the LifeScape Analyzer page, you can view how much time your patient spends in either Omnidirectional mode (surround sound) or Directional mode (everything else). It is displayed as a percentage of time, and it will add up to 100%. The different polar patterns that are possible are Omnidirectional, Cardioid, Supercardioid, Hypercardioid, Bidirectional.
Case Study: A patient reports having difficulty hearing a friend she meets for lunch twice a month. She is wearing Halo 2 i2400 RICs. The Data Log does not reveal a significant percentage of time spent in Noise or Speech in Noise as a result of the infrequency of her lunch outings. The percentage of time directional microphone mode is applied is low.
How can we help this patient? We could add a memory with a fixed directional configuration. If she already has a memory with that fixed directional configuration, we can encourage greater use of it. Since she is wearing a Halo 2, we can review Comfort Boost on her TruLink app for her smart phone (Comfort Boost is noise suppression on demand). We can also review the TruLink app and how she can create her own TruLink memory for that particular situation. She can even geo-tag the location, it so as soon as she walks into the restaurant, it automatically switches into the program that will be optimized for her to hear her friend.
Average Gain Adaptation
Average Gain Adaptation is based on one sound class and how the hearing aids make adjustments for that sound class (Figure 11). However, it should be noted that multiple algorithms can run at the same time, so you can have gain adaptation that’s taking both algorithms into account. Adaptation occurs on a per channel basis. This is beneficial because we are able to make adaptations to optimize speech specifically for each channel, and not make large gain adaptations across the board. For example, if wind is present, most gain adaptation (gain reduction) will occur in the low frequencies and allow the rest of the frequencies to remain intact. That's a better solution instead of turning everything down because of noise. With the i2400 level technology, there are 24 channels of gain adaptation; with the i2000, there are 20 channels of gain adaptation; and with the i.e.,, there are 16 channels of gain adaptation.
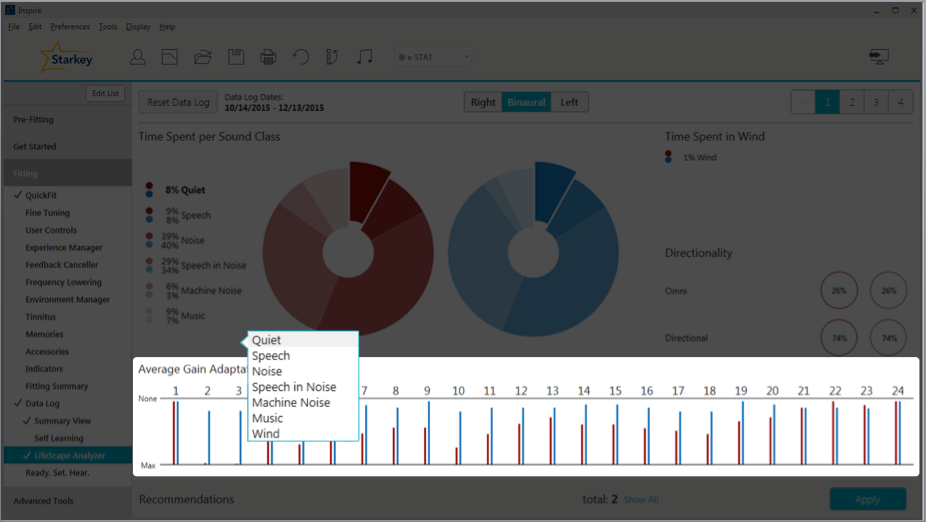
Figure 11. Average gain adaptation.
With regard to our Quiet Sound Classification and Average Gain Adaptation, the gain adaptation occurs for low-level noises, like a computer fan or a refrigerator motor. All of these soft sounds will be classified as quiet if they fall at or below the default kneepoint in each channel. The adaptation utilizes the Quiet noise algorithm (also known as our Expansion algorithm). In Figure 12, we've zoomed in on channels one through four. If you hover your cursor over one of the gain adaptation channels/bars, you are able to see how much adaptation is being made. For example, for channel two, the frequency is about 500 Hz and we're making about 4 dB gain reduction when we are in the Quiet sound classification environment.
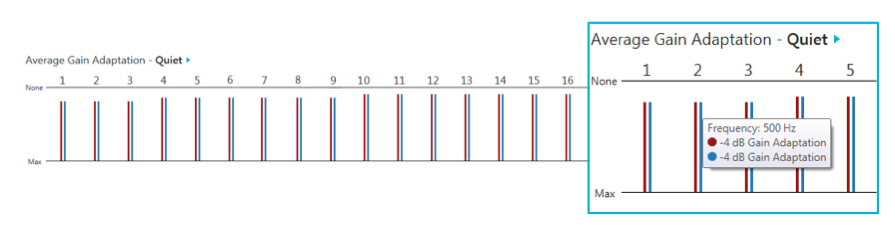
Figure 12. Average gain adaptation, quiet.
Case Study: The patient reports being bothered by computer fan noise while working from home. If the patient only works from home once a week, it's probably not going to classify that computer fan noise as well as being Quiet. They're not going to be in Quiet that much. If the patient works from home most of the time (4-5 days/week), the hearing aids are probably going to pick up on this noise. If not, we can look at the Data Log to see how active that Quiet sound classification is. If we see that is classified as Quiet, it's not making a lot of Average Gain Adaptation for Quiet environments, within the Environment Manager we can make that Quiet/Expansion algorithm stronger or more aggressive. If we already see that it's active and we are making a large gain adaptation for our quiet environments, that can also signify that we need to go into our Gain Settings and possibly make some adjustments to our Soft Gain.
If you do have a patient whose Quiet adaptation is inactive, we can go to the Environment Manager to a section called Comfort (Figure 13). When we click on Details by Comfort, we can go to the Quiet algorithm and make adjustments. In the i2400 technology levels, the default is going to be a level three, which is a strong expansion; or we can turn it up to a level four, which is maximum expansion. Let's say you have a reverse situation, where your patient misses hearing all those soft noises that they used to hear, like the refrigerator. You can turn your Quiet / Expansion algorithm down so that they hear more of those soft sounds. The amount of adjustment you can make to the Quiet algorithm will increase as the level of technology of the product increases. For example, in your i1600s, the choices are On and Off; with the i2400, there are more levels of adjustment.
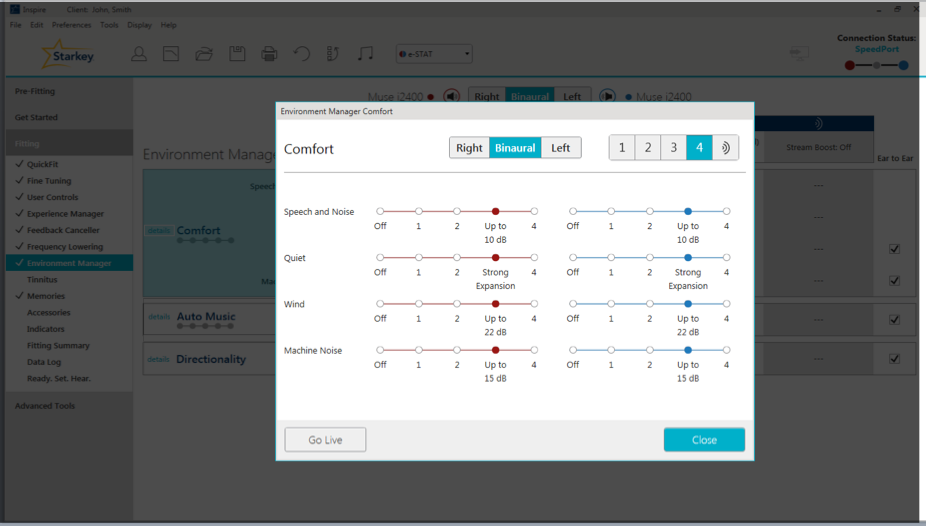
Figure 13. Environment Manager, Comfort Section.
Speech, Noise, and Speech in Noise. When are referring to these three different sound classifications:
- Speech is designed to identify the presence of a modulated speech signal
- Noise is going to be a steady-state signal
- Speech in Noise is designed to identify the presence of a modulated speech signal in the presence of steady-state noise
We are going to classify the sound based on these three categories:
- Signal to Noise Ratio (SNR) - used to determine whether a sound is Speech, Noise or Speech in Noise
- Overall loudness of the environment
- The best way to optimize comfort and ease of listening for your patient
The Average Gain Adaptation for Speech is going to occur when the Signal to Noise Ratio is greater than 5 dB. We want Speech to be the most optimized signal so that our patients can hear conversations well. We're not going to make any adaptation for Speech because that's what our ESTAT targets for: to optimize Speech. We don't need to make any gain reduction for Speech because we want to hear Speech.
With Speech in Noise and Noise, we're going to determine the loudness of the environment and either make more gain adaptations (in louder environments) or fewer gain adaptations (for softer environments). We can accomplish this by using our Speech in Noise algorithm, also known as Acuity Voice. The purpose of our Speech in Noise algorithm is to reduce listening effort and cognitive fatigue of the user. It's going to significantly improve speech clarity even in the noisiest environments by applying variable noise adaptation in all channels between each pause in speech. There will also be noise adaptation between pauses in syllables, words, sentences, and so forth. In the i2400 levels, you can get up to 20 dB of noise reduction.
Case Study: A Muse i.e., user is having a difficult time understanding her grandchildren at the park and at family parties. The Data Log shows that Speech in Noise and Noise are being classified over 55% of the time. For this patient, we can create a fixed directional program so that she can get more advanced help in those environments (if she doesn't have one already). We can also engage Directionality Plus. With i.e., users, the only noise algorithm option to choose in the Comfort Manager is On or Off. The i.e., does have the Directionality Plus (as do the i2000 and the i2400). You can use that to help her out in these environments. We could also talk to her about possibly using a wireless accessory, like a remote microphone. It can be clipped to one of her grandchildren's clothing, or she can carry it around at family parties. We can also use this situation to counsel the patient on the advantages of upgrading to a product with more advanced levels of noise reduction. For example, the default setting for the i2400s is 10 dB of noise suppression. However, we can go up to 20 dB of noise suppression if necessary; with the i2400, we do have the ability to make that Speech in Noise algorithm more aggressive. With the i2000s, the options are Zero, One and Two.
Machine Noise. Our Machine Noise program is a steady state signal, and is designed to facilitate comfort in the presence of overwhelming noise or in more complex listening environments. The input into the hearing aid has to be greater than 50 dB in order for it to be classified as Machine Noise. Softer sounds such as computer fan noise or humidifier noise will not be classified as Machine Noise because they're too soft. Machine Noises are louder noises, like vacuum cleaners, lawn mowers and blenders.
If you need to make adjustments for Machine Noise for your patient, within the Environment Manager, go to the Comfort section, and at the very bottom, the last algorithm is going to be the Machine Noise algorithm (Figure 14).
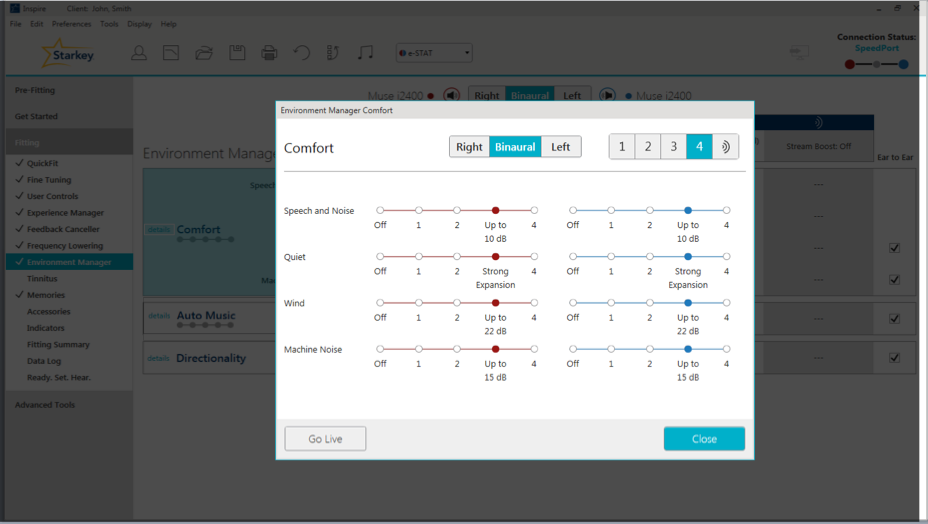
Figure 14. Machine Noise adjustments.
Wind. Wind adaptation occurs as a result of turbulence over the hearing aid microphone. The Wind Noise algorithm can achieve up to 30 dB of wind suppression in our i2400 technology products. All of this adaptation occurs in channels 1-3. If you recall, I stated previously that adaptation is going to be on a per channel basis, because Wind mainly affects low frequencies. Therefore, we're going to have the most adaptation in channels 1-3. In order to make adjustments to the Wind Noise algorithm, again go to the Environment Manager, and within the Comfort section, click on Details, and you will be able to make adjustments to the Wind program (Figure 15).
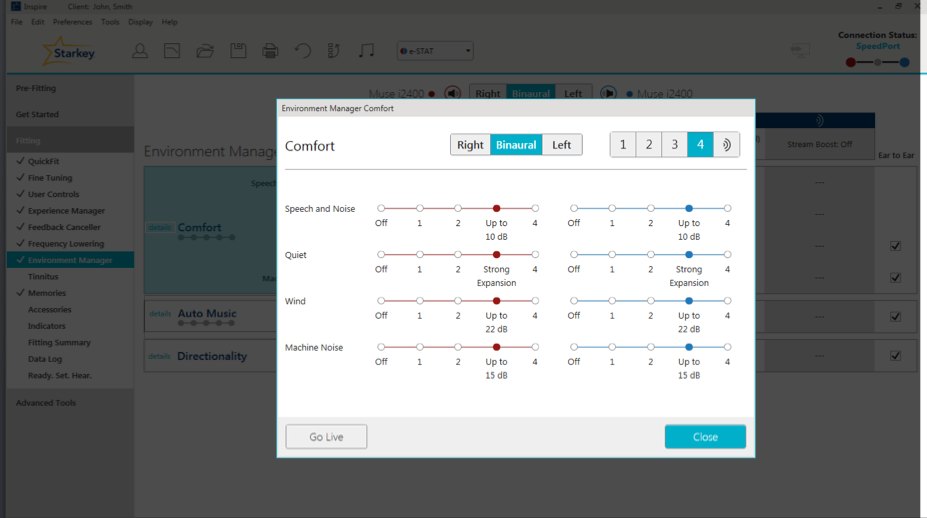
Figure 15. Wind Noise adjustments.
Case Study: Patient reports more exposure to wind noise than what is recorded for Wind Noise in the Data Log. In this case, the patient plays golf regularly. We can consider creating an outdoor program for this patient, to address that golf course environment more precisely. Our different memories are optimized for the environments as indicated in the name of the program. We do use a lot of research in order to create the optimal adaptations for those environments. For example, the outdoor program will max out that Wind Noise algorithm for the patient automatically. If you have a patient who does not want multiple memories, you can go into your Environment Manager and turn up that Wind Noise algorithm, if that is possible considering the level of technology they are wearing.
Music. Technically speaking, there is no gain adaptation for Music. We do have a music algorithm designed to make background music more robust or less prominent in the absence or presence of Speech. Our current term for this algorithm is Music Adaptation, however we are going to have a software release soon to unveil a more accurate name for this algorithm: Auto Music.
If a patient would like background music to be more robust or less prominent, this can be adjusted within the Environment Manager (Figure 16). Underneath Comfort, you will see Auto Music, and instructions are provided to show how to make appropriate adjustments. If the patient would like Music to be less prominent, you would turn it toward Off; if they want it to be more robust, you'd move it toward Level 4.
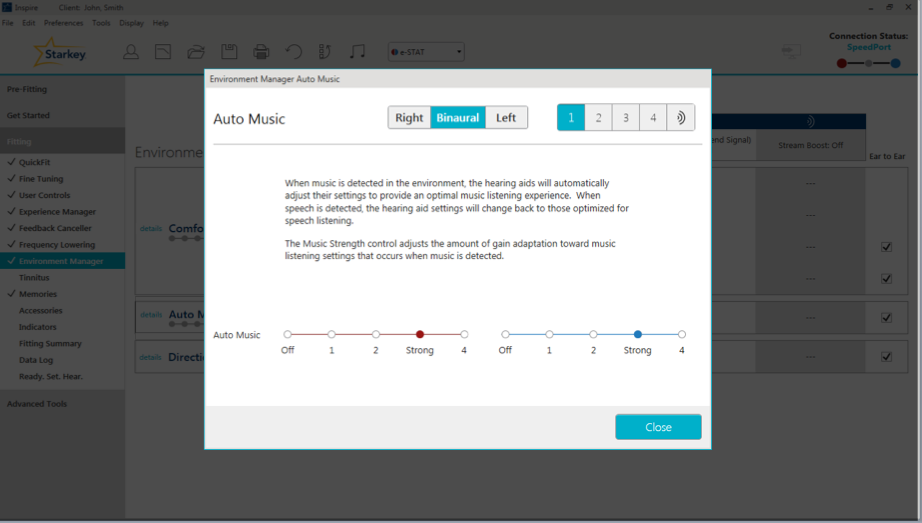
Figure 16. Auto Music.
Recommendations
In the Summary View page toward the bottom, click "Show All" to see the Recommendations based on that data that has been collected in the Data Log (Figure 17). One of our Recommendations for this particular patient is to increase overall gain in memory one, as the patient has been turning it up by 2 dB. It's also going to remind you to run the Feedback Canceler to have better feedback prevention. You can either manually make these recommended changes, or click on the "Apply" button to make all the changes automatically.
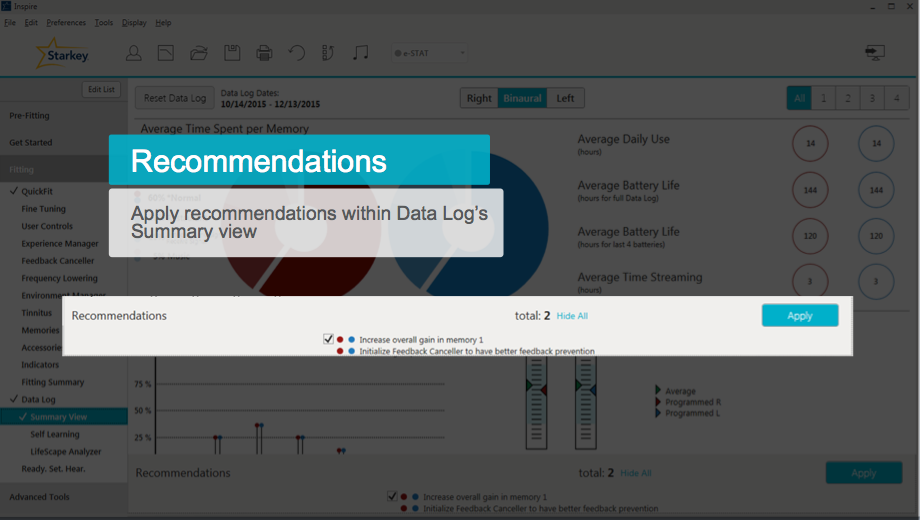
Figure 17. Recommendations.
Resetting the Data Log
Each time you see a patient, it is important to remember to reset the Data Log. This is especially true if you're making any programming changes, and even more important if you're changing any of the Noise algorithms. If you neglect to reset the Data Log, the old data can interfere with the new data. Hypothetically, let's say you've adjusted the patient's Wind or Machine Noise to be more aggressive, but you forget to reset the Data Log. When they come back in, and you look at their Data Log and do not see much change, it will be hard to discern whether the hearing aids aren't making any changes, or if the old data is interfering with the new data. Remember, that Log is cumulative until reset. However, it is automatically reset during the first fit AutoPath sequence, and also after a Firmware Update. To manually reset the Data Log, on the upper left-hand corner of the Summary Screen, you will see the button labeled Reset Data Log (Figure 18). Simply click the button and the Log will be reset.
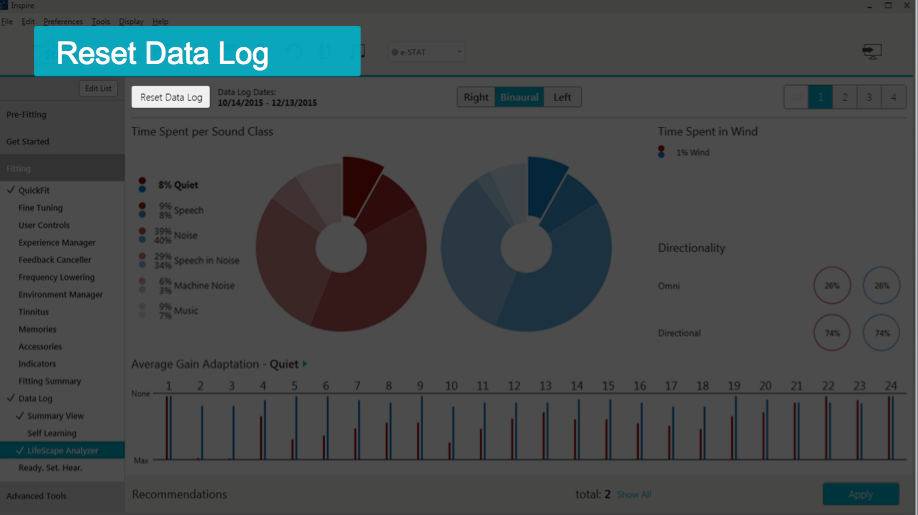
Figure 18. Resetting the Data Log.
More Case Studies
Trouble Hearing on the Phone
In this case, a patient reports trouble hearing on the phone. She mainly uses a landline phone. She has an Autocoil memory (left send signal). Data Log shows the Autocoil is engaged 0% of the time.
The Autocoil left send signal means that the user must hold the phone up to their left ear; the signal is then sent to their right ear so they are hearing the conversation in both ears. This patient is having trouble. One question to begin with is to ask on which side of her head she holds the phone. We want to make sure she's not holding it on the right side; if so, it's not going to engage that Autocoil. We also want to check to see if the landline has a strong enough telecoil; we may need to give her a magnet to attach to it. We may also want to reinstruct her on how to engage that telecoil. If the patient is using a cell phone, most smartphones have something called Hearing Aid Mode, which will engage the telecoil. Sometimes the telecoils in cell phones aren't strong enough; in that case, we do have flat magnets at Starkey that you can put on the user's cell phone to help better engage the telecoil.
Case Study: Data Log shows that a patient uses the "Crowd" program 80% of the time, but the classification results show he is in quiet 85% of the time.
Does the patient know which program he's using? Maybe he's putting his hearing aids in and accidentally pressing his user controls, causing him to go into Memory Two. Does he know what program he's supposed to use all of the time? Maybe he's confused about that. He may not know how to change his memory, so once he gets into that program, he's stuck. It might be that there is something he likes about the Crowd program, even when he's quieter. This is a great way to open up a dialog between you and the patient.
Case Study: The patient is fit with Muse i2400 RICs, with one memory and no user controls engaged. She reports having a difficult time hearing in meetings, lectures, and church. Data Log shows that Speech in Noise is being classified a significant percentage of the time. She has arthritis in both hands.
Consider increasing the Acuity Voice setting based on the information in the Data Log. She is in the i2400s, so we can turn up that Speech in Noise algorithm for her. We can also engage Directionality Plus; or if she has an accessory, we can even turn on Noise Control Boost which is going to give her more noise control suppression. We can talk about adding a SurfLink remote control so that she can access different memories, since she doesn't have one yet. We can add a fixed directional memory and then give her the SurfLink Remote control. Nice big buttons will help with her arthritis. We can also talk about getting her a SurfLink Remote microphone to use. She can have the speaker at church or in lectures clip it onto their shirt. In meetings, she can lay it flat on the table in front of her and it'll give her a better Omni-directional sound quality of the people speaking. If she's still in her trial period, it might not be a bad idea to think about changing her over to the Halo 2 RICs because then she can use the TruLink app if she's interested.
Final Thoughts and Helpful Tips
Troubleshooting
If there is a discrepancy between the Data Log on the left and right side, it could be that the patient is not wearing both hearing aids at one time. Maybe they're experiencing some type of discomfort. Maybe they had an ear infection and couldn't wear one. It could be that one hearing aid battery was dead, leading to the asymmetry. When was the last time that Data Log was reset? Maybe it has been a long time, and all of a sudden you have old information interfering with new. Perhaps one hearing aid needed repair and the Data Log wasn't reset when both hearing aids were brought into the software together again.
Considerations with Halo 2 Data Logging
The Data Log only shows information regarding the hearing aid memories (the ones that you create in Inspire). You will not get any information in the Data Log regarding the TruLink memories, because those are stored on the patient's iPhone and not in the hearing aids. Another thing to note with the Halo 2 Data Logging, you will not see average battery life for these products.
Professional Support Tools
Help is available if you have questions. Within the Inspire software at the top in the Main Tool Bar, click Help, and the first item in the drop-down menu is Help for Inspire. That link will redirect you to our Online Manual. On the left side of the Online Manual is a navigation bar where you can search for topics. When you click Data Log or search Data Log, there are multiple pages that will cover everything presented in today's session, as well as information about Data Logging for older products.
For more information about Environment Manager or LifeScape Analyzer, there are other AudiologyOnline courses that you can find on the Starkey Expo Page on AudiologyOnline.
Citation
Kuvadia, S. (2017, June). Data logging - Hearing aid behavior in the real world. AudiologyOnline, Article 20258. Retrieved from www.audiologyonline.com