 From the Desk of Gus Mueller
Verification or validation? Terms that mean pretty much the same to most people, usually mean somewhat different things in the world of fitting hearing aids. Simple definitions that I like, which nicely differentiate the two terms, go like this: Verification—Did we build the system right? Validation—Did we build the right system? Building the system (the hearing aid fitting) right relates to using a validated prescriptive approach to determine gain and output, which is then, verified by real-ear SPL measures. Knowing if we built the right system (validation), however, only can be determined by collecting real-world outcome data.
We typically assess the real-world success of hearing aid fittings through the use of retrospective interviews, patient diaries or more structured self-assessment inventories. While these assessment tools are reasonably successful, they often lack the contextual preciseness needed for a valid assessment, and also are subject to recall bias—patients often are asked how they performed in a given listening situation that occurred days or weeks earlier. An approach that has been shown to overcome some of these limitations is ecological momentary assessment, or EMA, where repeated samples are collected from the respondents concurrently or shortly after a given experience. This assessment technique has been used for several years in other disciplines, and occasionally in hearing aid research, but is now being studied more closely. One of the leading researchers in this area is our guest author for this month’s 20Q.
Yu-Hsiang Wu, MD, PhD, is Assistant Professor, Department of Communication Sciences and Disorders, at the University of Iowa. In additional to his many research efforts, he is also actively involved in the teaching and mentoring of both AuD and PhD students.
You’re probably familiar with Dr. Wu’s research, book chapters and numerous journal publications over the past few years, covering a large range of hearing aid related issues such as pre-fitting testing, directional processing, digital noise reduction, audio-visual effects, listening effort and hearing aid real-world outcomes. Related to the latter topic, he recently has been investigating the use of EMA, and is sharing some of his preliminary findings with us this month.
As described by Wu, at this point, related to hearing aid fittings, EMA is primarily a research tool. But with the continued advancements in real-time connectivity among smart phones, hearing aids and dispensing audiologists, EMA might be closer to clinical prime time than we think!
Gus Mueller, PhD
Contributing Editor
June 2017
Browse the complete collection of 20Q with Gus Mueller CEU articles at www.audiologyonline.com/20Q
20Q: EMA Methodology - Research Findings and Clinical Potential
Learning Outcomes
After this course, readers will be able to:
- Participants will be able to define EMA and explain its relevance to audiology practice and research.
- Participants will be able to describe the benefits of using EMA methodology to study real-world hearing aid outcomes, and its advantages over retrospective assessments and laboratory measures.
- Participants will be able to summarize key findings from studies of the accuracy, reliability, and validity of data obtained via EMA methodology.
- Participants will be able to list some disadvantages and/or limitations of using current EMA methods and means for clinical decision-making.

Yu-Hsiang Wu
1. You’ve lost me already - what is "EMA"?
EMA stands for Ecological Momentary Assessment. It is a methodology involving repeated assessments/surveys to collect data describing respondents’ current or very recent (i.e., momentary) experiences and related contexts in their natural (i.e., ecological) environments (Shiffman, Stone, & Hufford, 2008). EMA is also known as experience sampling or ambulatory assessment. EMA is very useful in audiology.
2. Can you give a practical example of EMA methodology?
Imagine that you go to a restaurant. After you finish your meal, you are very satisfied with the food. You immediately go to Facebook and write about your experience (“The food here is fantastic!”) and leave some contextual information (e.g., photo of the food and your friends). You do this immediately so you do not forget exactly where you were and what you ordered that was so satisfying. If you do this again and again at the same or different restaurants, you are using the EMA methodology: You are repeatedly reporting your experiences and related contexts.
3. Okay - why do we use EMA in audiology?
Well, for both researchers and clinical audiologists, it is important to determine if a given intervention, such as a new hearing aid technology or fitting strategy, delivers greater benefit to listeners with hearing impairment than other interventions. The intervention benefits—or the outcomes—are often measured in a laboratory or clinic setting using methods such as speech recognition tests, often including competing background noise. Laboratory-type outcome measures have been widely used because they can assess outcomes in controlled environments. However, we have repeatedly found that laboratory results are not generalizable to the real world. Therefore, measuring outcomes in the real world is very important. Further, some domains of intervention outcome (e.g., satisfaction) cannot be assessed in laboratories. EMA is a great way to let us know what is happening on an everyday basis in the real world.
4. Don’t we already have tools to measure real-world outcomes, such as self-assessment questionnaires?
I assume you are referring to scales such as the COSI, APHAB, IOI-HA, and so on. To make it clear, I consider questionnaires of this type to be retrospective self-reports, as they typically ask patients to recall what has happened previously and summarize their experiences/feelings to answer the questions. Yes, retrospective self-reports have gained much attention in audiology research in past decades. This is because the nature of self-reports is consistent with the trend toward patient-driven healthcare system, and outcomes measured in the real world have better ecological validity.
Retrospective self-reports, however, have several disadvantages. For example, they are subject to recall bias. Because retrospective self-reports are typically administered at least several weeks after intervention, such as a hearing aid fitting, patients have to recall and summarize their listening experiences across a long period of time. Empirical research has shown that long-term recall could be inaccurate and unreliable (e.g., Bradburn, Rips, & Shevell, 1987). For patients who have lower cognitive abilities, accurately reporting real-world listening experiences in retrospective self-reports is even more difficult.
5. That makes sense. Are there other disadvantages?
Retrospective self-reports also suffer from poor contextual resolution. Let’s use the APHAB (Abbreviated Profile of Hearing Aid Benefit) as an example, as it’s one of the most popular structured outcome measures. The APHAB asks patients to report their experiences in several pre-defined situations. One of these situations is when the listener is in a crowd: “I can communicate with others when we are in a crowd.” A person’s ability to understand speech in a crowd may differ considerably over time. Some might consider a busy shopping mall a crowd. Others would think of watching a movie at a theatre as speech understanding in a crowd. Both of these situations are much different than watching a football game in a crowd at the neighborhood pub. So, when an individual summarizes his/her experience across all contexts to answer the APHAB crowd question, the answer may not be generalizable to any specific crowd situation.
6. No wonder my patients often say, “It depends” when they try to complete questionnaires. Can EMA address these issues?
In contrast to retrospective self-reports, EMA provides in-situ self-reports, as EMA involves repeatedly conducting assessments/surveys in the real world to collect real-time data. In each in-situ assessment, experiences are recorded almost immediately; as a result, EMA is considered to be less affected by recall bias. Also, because detailed contextual information can be collected in each survey, EMA has high contextual resolution.
7. That sounds fancy. Is EMA something new to audiology?
Not really. EMA has been implemented using low-tech paper-and-pencil journals in previous hearing aid outcome research (Preminger & Cunningham 2003; Walden, Surr, Cord, & Dyrlund, 2004; Cord, Walden, Surr, & Dittberner, 2007; Wu & Bentler, 2010). For example, Walden, Surr, Cord, & Dyrlund (2004) tried to explore the relationship between microphone preference (omnidirectional vs. directional) and listening environments. These researchers asked hearing aid users to repeatedly report their preferred microphone modes in paper-and-pencil journals in different real-world listening situations. Research participants also reported contextual information in terms of location of the listening activity (indoors/car/outdoors), location of the primary speech source (front/side/back), location of background noise (front/side/back/all around), size of the indoor space (small/average/large), and so on. In another study designed to examine the effect of visual cues on directional microphone benefit, Wu and Bentler (2010) expanded the survey used by Walden et al. (2004) to collect more information. Hearing aid users were asked to repeatedly report their degree of speech understanding in real-world listening situations. They also reported on contextual information in terms of the availability of visual cues (always/sometime/rarely) and relative loudness of noise compared to speech (much softer/somewhat softer/same/somewhat louder/much louder). Although the term EMA was not used by these researchers, these studies used the EMA methodology.
8. That paper-and-pencil EMA makes me think of a diary.
Indeed. A variant of low-tech EMA that has been used in audiology research is the daily diary (Palmer, Bentler, & Mueller, 2006; Bentler, Wu, Kettel, & Hurtig, 2008). For example, in order to evaluate the effectiveness of directional microphones in hearing aids, Palmer and colleagues (2006) asked research participants to complete diaries at the end of each day during the field trial to report their listening experiences. Although daily diaries do not ask respondents to record their immediate experiences, it could be considered a type of EMA due to the relatively short recall time frame compared to typical retrospective self-reports (Shiffman et al., 2008).
9. You said low-tech EMA. Is there high-tech EMA?
Yes. In recent years, EMA has been realized using portable computers (Galvez et al., 2012; Henry et al., 2012). With mobile technologies, EMA data can be collected more reliably and more complex surveys can be used. For example, Galvez et al. (2012) used personal digital assistants (PDA) to characterize listening difficulty encountered by hearing aid users. The PDA prompted the participants through an audible alert to complete a survey four times per day. The survey questions were presented adaptively, depending on if respondents indicated experiencing any listening difficulties since the last survey. Due to the recent advancement of smartphone technology, applications/software that allow researchers to implement the EMA methodology using smartphones in outcome research has been developed (Hasan, Lai, Chipara, & Wu, 2013). Smartphone-based EMA can collect self-reported information from respondents such as the degree of speech understanding and the characteristics of the environments, as well as record objective data such as sounds and location information (Figure 1).
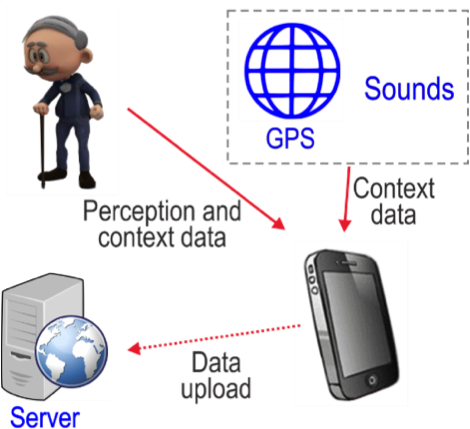
Figure 1. Smartphone-based EMA system.
10. The high-tech EMA sounds cool, but it still requires respondents to report many things, right? Can they make accurate reports?
Great question! Actually, we did a study to examine the extent to which individuals can accurately report their speech recognition performance and characterize their listening context (Wu, Stangl, Zhang, & Bentler, 2015). Specifically, we asked research participants to estimate their speech recognition performance in laboratory settings wherein the signal-to-noise ratio (SNR) was fixed or constantly varied across sentences. We found that the reported and measured speech recognition scores were highly correlated across all test conditions (Figure 2).
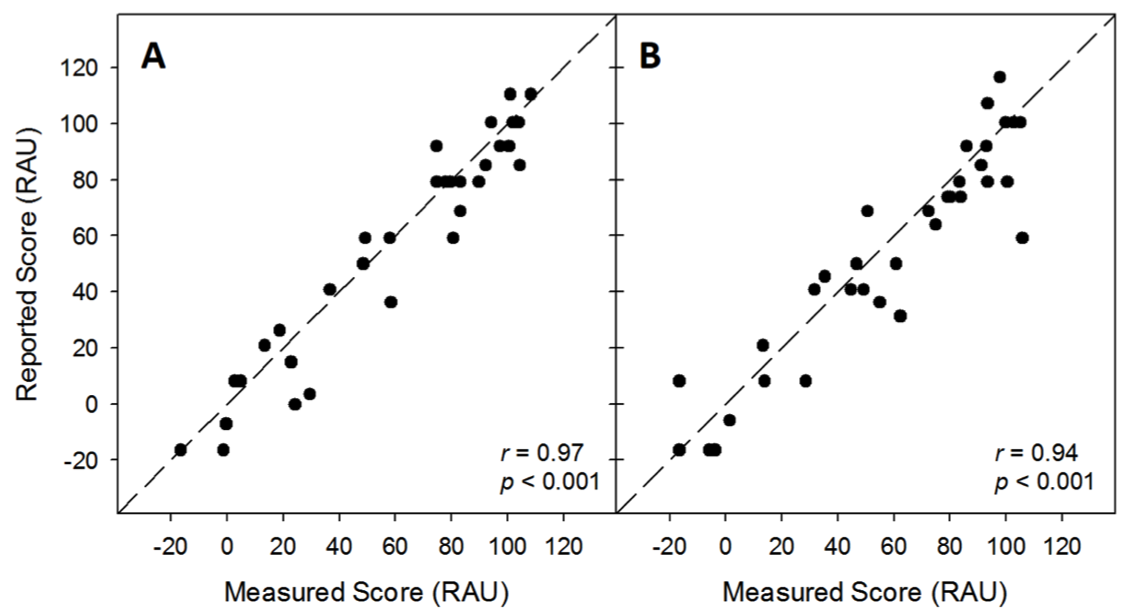
Figure 2. Self-reported speech understanding score as a function of measured score. Signal-to-noise ratio was fixed (2A) or constantly varied across sentences (2B). RAU: rationalized arcsine unit. Adapted from Wu et al., 2015.
We also conducted a field test wherein the participants were asked to report the listening context (e.g., noisiness level and noise location) of several semi-controlled, real-world conversations. The participants’ reports were compared to the context described by two research assistants and the background noise level measured using a sound level meter. The results revealed that most listening context properties reported by the participants were highly consistent with those described by the research assistants (74% to 95% consistency), except for noisiness rating (58%) (Figure 3A). Nevertheless, higher noisiness ratings were associated with higher background noise levels measured using the sound level meter (Figure 3B). These results indicated that listeners with hearing impairments could estimate the relative degree of speech understanding and describe listening context with reasonable accuracy.
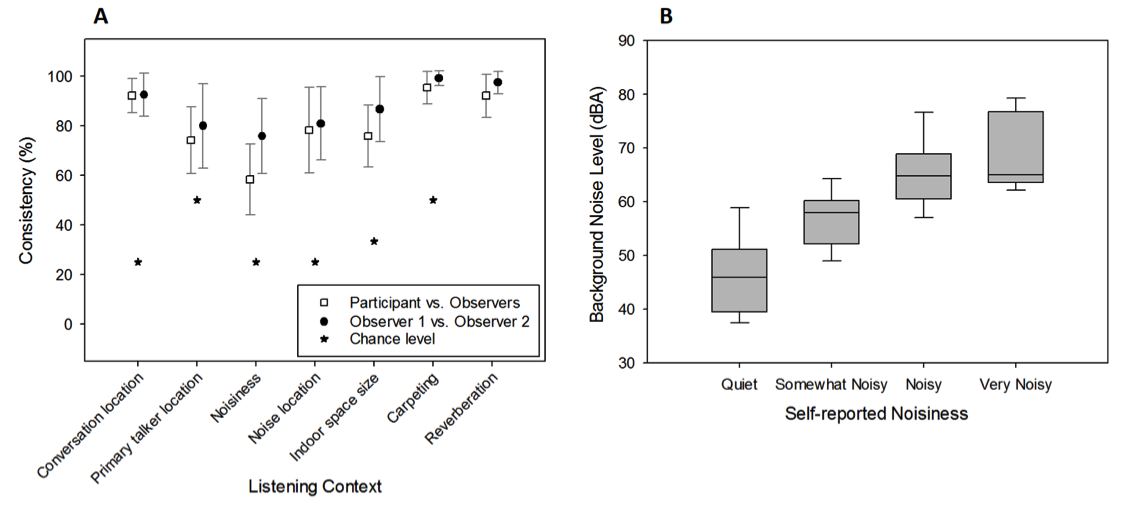
Figure 3. Consistency of reported listening context between research participants and observers and between the two observers (3A) and boxplot of background noise level measured using a sound level meter as a function of self-reported noisiness (3B). Adapted from Wu et al., 2015.
11. How about reliability - are the EMA data repeatable?
I knew you would ask this question. If we intend to use EMA, for example, to compare the outcomes of different hearing aids, the EMA data have to be repeatable. We have some unpublished data on the repeatability of EMA data. We asked research participants to conduct EMA in two separate one-week assessments. The interval between each one-week assessment was several weeks apart. In the EMA surveys, participants repeatedly reported their speech understanding (from 0% to 100%) and noisiness (“quiet,” “somewhat noisy,” “noisy,” and “very noisy”). Values 1 to 4 were assigned to the four noisiness ratings. We then averaged the results across surveys for each participant in each one-week assessment. If EMA data are repeatable, and if participants’ auditory environments are similar across the two assessments, the data collected from the first assessment should be correlated to the data obtained from the second assessment. Figure 4 shows the relationship between two assessments (left panel speech understanding; right panel noisiness). The correlations are significant, suggesting that, averaged across all surveys, the participants’ EMA reports were fairly consistent across the two assessments. These results indicate that EMA data are repeatable.
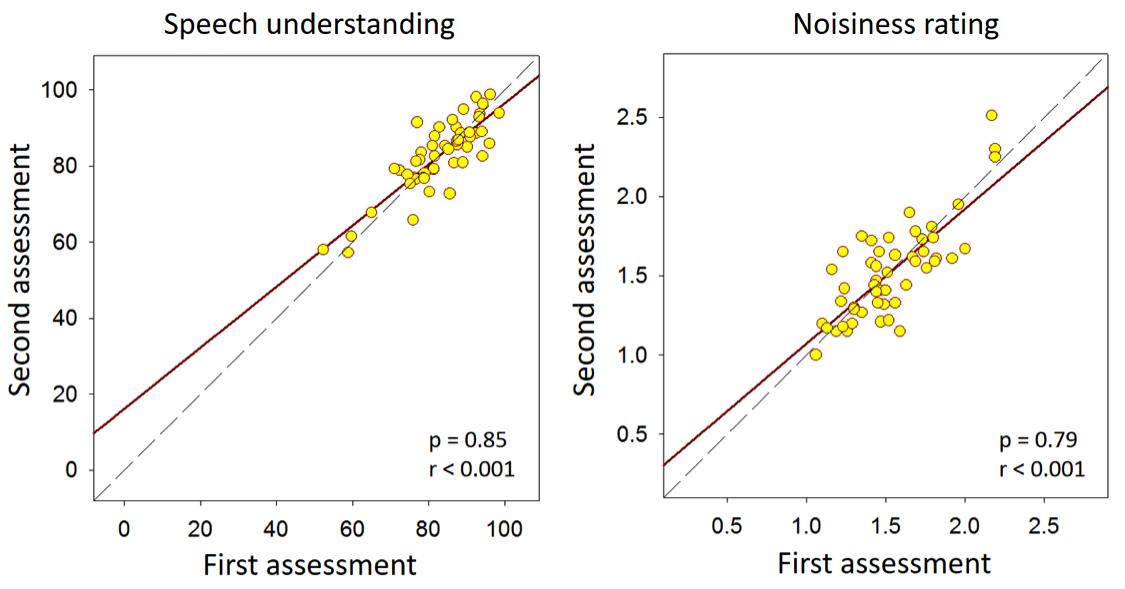
Figure 4. Relationship between EMA data averaged across surveys in speech understanding (left panel, in percent) and noisiness rating (right panel) obtained from the first and second assessments. Values 1 to 4 were assigned to noisiness ratings “quiet,” “somewhat noisy,” “noisy,” and “very noisy,” respectively.
12. Most importantly, does the methodology really measure what we want it to measure?
You are talking about the construct validity, which is the extent to which a measurement reflects what it is intended to measure. We did a study to examine the construct validity of EMA (Wu, Stangl, Zhang, & Bentler, 2015). The rationale of the study was that, for EMA to have high construct validity, the results generated by this methodology should be consistent with the established knowledge or theories in audiology. For example, because it is well established that audibility and visual cues play important roles in speech understanding, EMA data should show the same trends. That is, EMA should be able to demonstrate that better speech understanding is (a) associated with situations wherein the listeners are using hearing aids (better audibility) and the primary talker is in front of the listener (visual cues might be available), and (b) negatively associated with the degree of hearing loss (poorer audibility). To test this hypothesis, research participants repeatedly reported their degree of speech understanding, hearing aid use, and location of the speech source using paper-and-pencil journals for one week in their daily lives. They also carried noise dosimeters to measure the sound level. The results revealed several significant associations: participants who have better hearing reported better speech understanding, and better speech understanding was associated with the use of hearing aids, front-located speech (Figure 5A), and lower dosimeter sound level (Figure 5B). The pattern of the data aggregated across multiple EMA surveys conducted in a wide range of uncontrolled real-world environments was consistent with the established knowledge in audiology, supporting the construct validity of EMA.
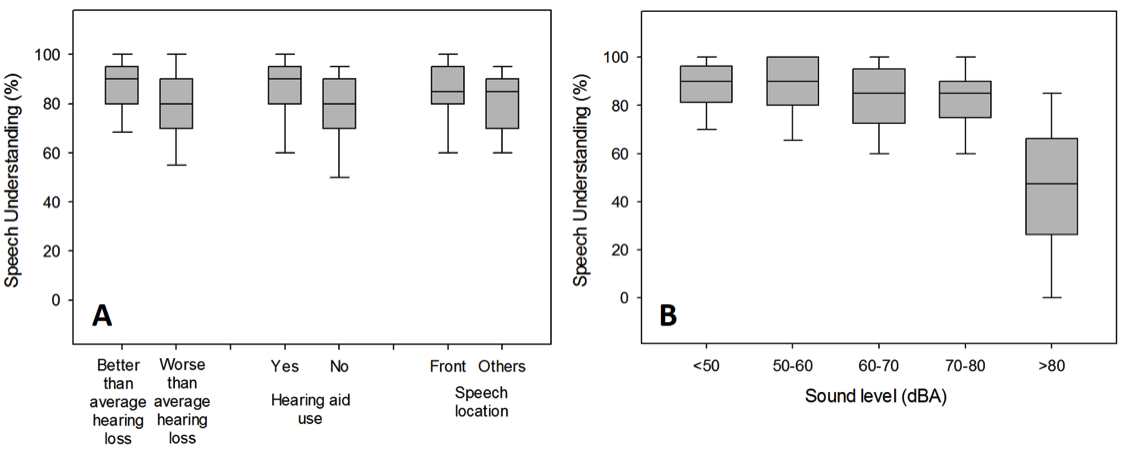
Figure 5. Box plot of self-reported speech understanding as a function of hearing threshold, hearing aid use, and primary talker location (5A), and as a function of sound level measured using dosimeters (5B). Adapted from Wu et al. (2015).
13. This all sounds good, but exactly how does the use of EMA fit into audiology?
As mentioned, EMA can be very useful. For example, we can use it to characterize auditory lifestyle by asking respondents to report their listening activities (e.g., conversation), locations (e.g., traffic), and nosiness levels in EMA surveys. We then can compute how frequently each variable occurred to characterize respondent’s “auditory lifestyle.” Figure 6 shows the distribution of listening activities (6A) and the noisiness of environments (6B) across seven subjects (Hasan, Chipara, Wu, & Aksan, 2014). These data suggest that the auditory lifestyle varies substantially across subjects. This information can be very useful in terms of patient counselling.
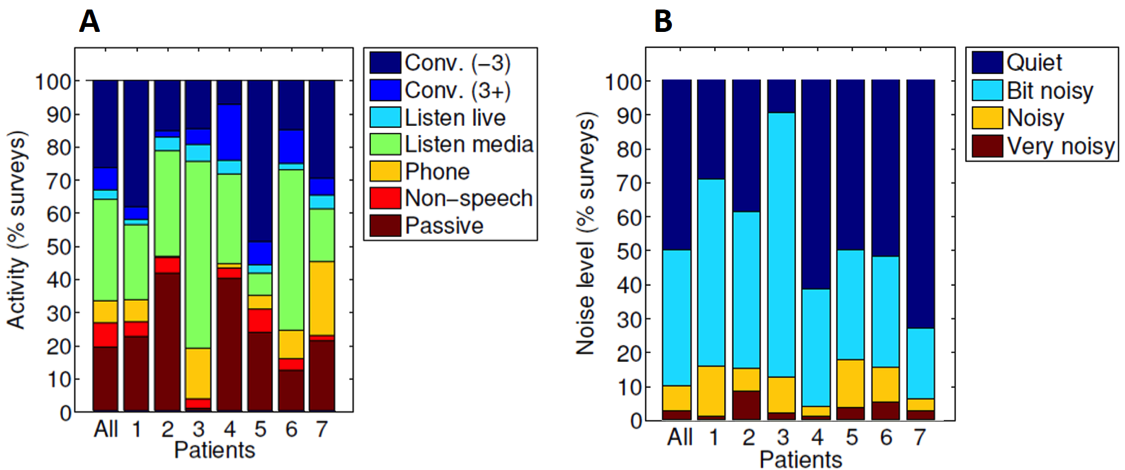
Figure 6. Distribution of listening activities (6A) and the noisiness of environments (6B) across seven patients. Conv (-3): conversation in a small group of 3 or fewer people; Conv (3+): conversation in a large group of more than 3 people; Non-speech: listening to non-speech signals; Passive: not actively listening; Home (-10): home with less than 10 people; Not home (-10): locations other than home with less than 10 people; Crowd (10+): a crowd of people with 10 or more people. Adapted from Hasan, Chipara, Wu, & Aksan (2014).
14. Could EMA be used to help a patient chose between hearing aid models, or different programing?
It could be, because we can use EMA to assess hearing aid outcome. Since EMA can collect a respondent’s perception about hearing aids and information about the listening context/environment, EMA is suitable for assessing hearing aid effect that is dependent on context. One example of a context-dependent hearing aid feature is noise reduction. Figure 7 shows hearing aid satisfaction collected using the EMA methodology from an unpublished study we conducted. In Figure 7A, the satisfaction ratings are averaged across all contexts. In this case, the satisfaction rating is quite similar regardless of if the noise reduction feature (directional microphone plus digital noise reduction algorithms) was enabled or not. However, if we plot satisfaction rating as a function of self-reported noisiness that was also collected in EMA surveys, the effect of the feature emerges (Figure 7B). That is, the effect of the noise reduction feature is minimal in quiet environments, while much larger in noisy situations. This is why I said that EMA has high contextual resolution. Therefore, if we can collect enough data from a patient, we can help this patient to select the most appropriate hearing aid models or features.
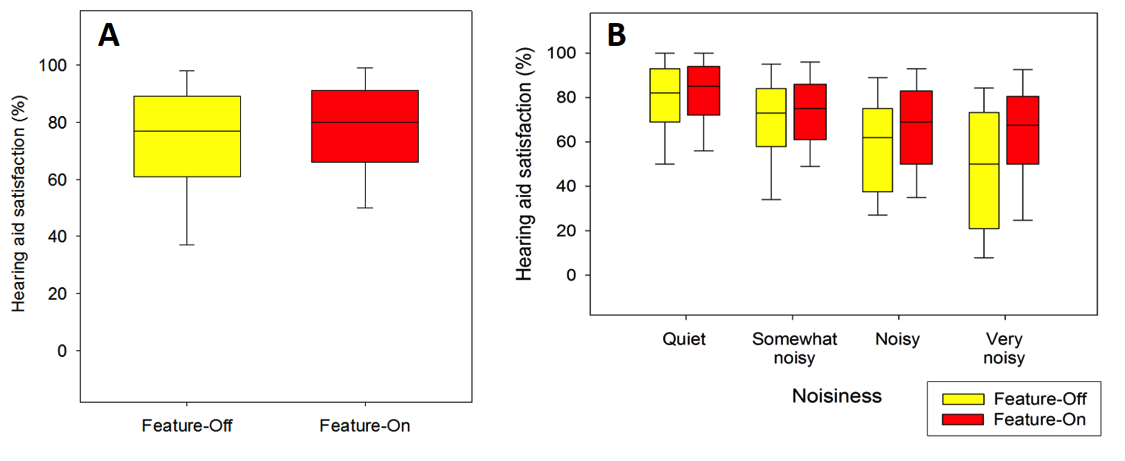
Figure 7. Hearing aid satisfaction reported in EMA surveys as a function of noise reduction features (7A) and as a function of self-reported noisiness (7B).
15. I suspect that EMA also can expand traditional hearing aid research?
Most certainly. With smartphone-based EMA, we can collect interesting data that have not been used in traditional audiology research before. One example is location data. In recent years, geo-tagging, which is an electronic tag that assigns a geographical location to a photograph or video, has become very popular. Geo-tagging has also been used in hearing aid adjustment. Particularly, if a hearing aid user has added a geotag to a very specific location, their hearing aids can adjust the sound settings to the listener’s predefined preferences in that environment. For example, a "Coffee Shop" memory would automatically activate as soon as a hearing aid user walked into the same coffee shop. The usefulness of this geotagging feature in hearing aids is based on the assumption that the acoustic characteristics of a given location are consistent across time. We have some data from an unpublished study we conducted to investigate if this assumption is true using smartphone-based EMA. Figure 8 shows the extent to which the noisiness rating (“quiet,” “somewhat noisy,” “noisy,” and “very noisy”) reported at a location can predict the noisiness rating of the “same location” across time. In the figure we manipulate the definition of “same location,” from infinite (all locations are the same location) to 10 meters (any two locations less than 10 m are the same location). As a shorter distance is used, the prediction accuracy increased systematically, suggesting that location contains some information about the acoustic environment. However, the prediction accuracy is not very high (~60%), indicating the large variation of listening environments.
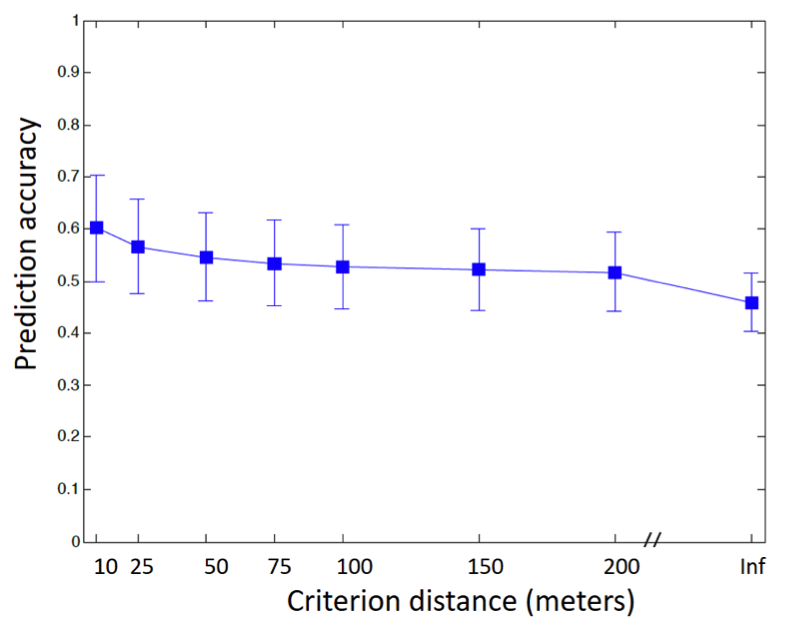
Figure 8. Prediction accuracy of self-reported noisiness rating as a function of the definition of “same” location.
16. Are there other technologies that can be used with EMA to make the results even more generalizable to the real world?
Yes. One technology that we have used with EMA is the Language Environment Analysis (LENA) system. Specifically, we conducted a study (Wu et al., in revision) to determine the relationship between speech level, noise level, and SNR, as well as the distribution of SNR, in real-world situations wherein older adults with hearing loss were listening to speech. In the study, each participant carried a LENA audio recorder, which is a miniature, light-weight, and easy-to-use digital audio recorder, for 5 to 6 weeks to record sounds. Participants also repeatedly completed EMA surveys several times per day to report the characteristics of their current listening activities. For EMA surveys where speech listening was indicated, the corresponding audio recording was examined and the SNR was estimated using a power subtraction technique (Smeds et al., 2015). Figure 9 shows the data collected from 894 speech listening situations. The figure indicates that as noise levels increased from 40 to 74 dBA, SNR systematically decreased from 20 to 0 dB. Most SNRs (62.9%) in the collected recordings were between 2 and 14 dB. Very noisy situations that had SNRs below 0 dB comprised 7.5% of the listening situations. This information could be useful for researchers aiming to design ecologically-valid assessment procedures to estimate real-world speech communicative function.
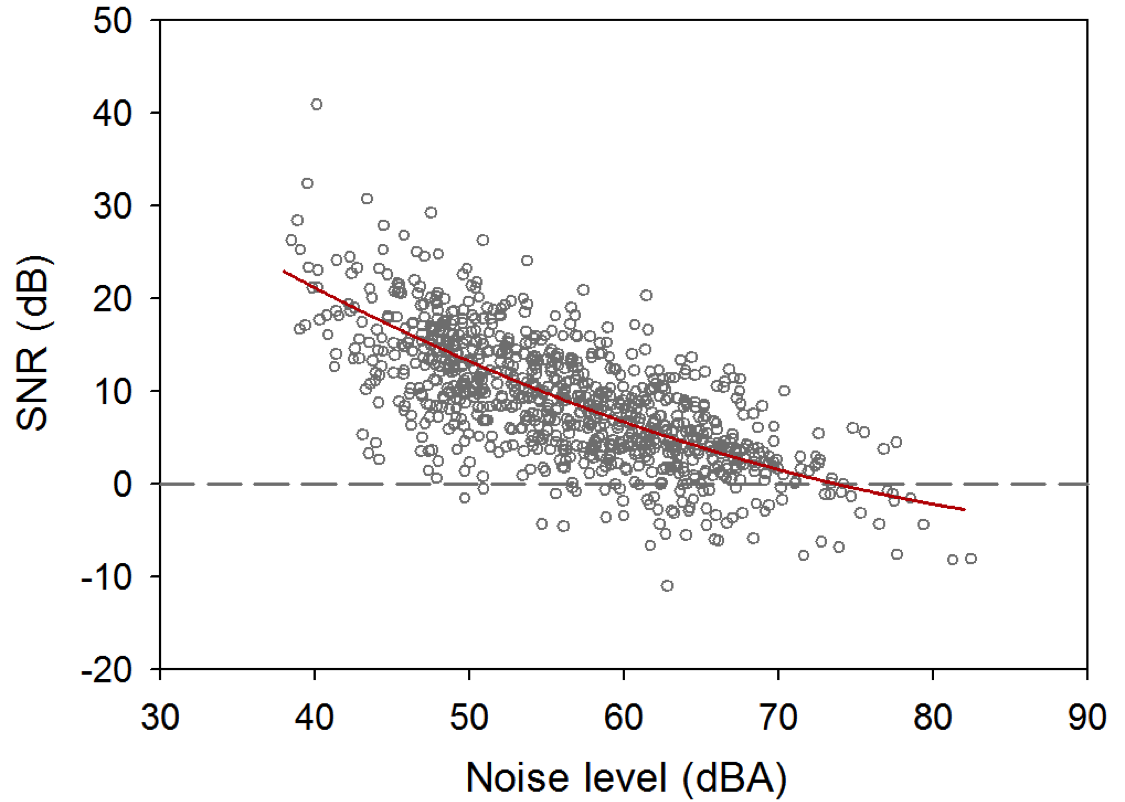
Figure 9. Signal-to-noise ratio (SNR) as a function noise level measured using LENA audio recorders.
17. LENA sounds interesting. Do you have more data about LENA?
Yes, we have used the LENA system to quantify the auditory lifestyles of older adults with hearing loss and examine if the use of hearing aids changes a user’s auditory lifestyles (Klein, Wu, Stangl, & Bentler, in press). New hearing aid users wore LENA audio recorders before and after hearing aid fitting. The sounds recorded by the recorders were automatically categorized according to time spent in different types of auditory environments (e.g., meaningful speech and TV/electronic) by the LENA algorithms (i.e., LENA PRO). The LENA algorithms also characterize the user’s auditory environment by providing the sound levels of different auditory categories. Overall, participants spent the greatest percentage of time in silence (approximately 40%) relative to other auditory environments. Participants spent approximately 12% and 26% of their time in speech and TV/electronic sound environments, respectively. No significant differences were found between mean percentage of time spent in each auditory environment in the unaided and aided conditions (Figure 10A). In contrast, median TV/electronic sound levels were on average 2.4 dB lower in the aided condition than in the unaided condition (Figure 10B). Although the TV/electronic level was significantly lower in the aided than unaided condition, our study results suggest that the use of hearing aids did not seem to substantially change users’ auditory lifestyles.
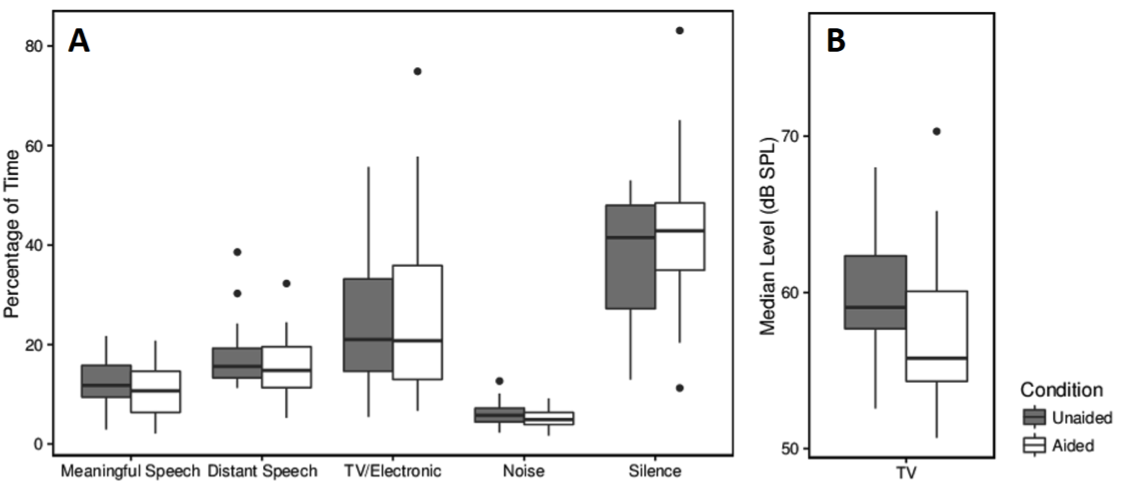
Figure 10. Percentage of time spent in each of the LENA auditory environments (9A) and median sound level of the TV/electronic environments (9B) in unaided and aided conditions. Adapted from Klein et al. (in press).
18. It seems that EMA can do a lot of things. Are there any cons?
Not too many, but we all know that data collected from the un-controlled real world are usually messy. Therefore, EMA requires a large amount of data points to achieve meaningful results. This will place a large burden on respondents (e.g., potentially our hearing aid patients) because they have to repeatedly answer EMA surveys. Patients may also find that the EMA surveys, as well as audio/GPS recordings, are intrusive. Therefore, the EMA methodology may produce subject selection bias. The burden for data analysis is high as well. To address the nested structures and autocorrelation characteristics of the EMA data, more complicated statistical analyses have to be used.
Despite these cons, EMA has several advantages. It can provide real-world, real-time data that describe the respondent’s experience. The data are less affected by recall bias and have high resolution in time and context. Finally, computer-based EMA can provide novel data such as GPS location.
19. Some current hearing aid technology with direct streaming takes an “acoustic snapshot” of a listening situation, and then the patient does a rating via their smartphone. Is this EMA?
The snapshot feature can be used to implement the EMA methodology. However, keep in mind that EMA involves repeated data collection, as a large amount of data is required to achieve meaningful results. The information from one or two snapshots could be totally biased and misleading. Therefore, unless a sufficient amount of data can be collected, I doubt if the information from the snapshot feature could be used to, for example, adjust hearing aids. The snapshot feature, however, could be useful in terms of facilitating the conversation between audiologists and patients. Of course this is just my opinion. These products are fairly new, and we need more research to support the usefulness of this feature.
20. So you’re saying I can’t really use EMA with my patients today?
Well, it certainly has been suggested that EMA data could be useful to help clinicians understand patients’ specific communication needs, optimize hearing aid fittings, and provide individualized aural rehabilitation training (Galvez et al., 2012). However, as I said earlier, the current format of EMA it is not suitable for clinical use due to its high levels of respondent load. Furthermore, systems or models that can convert raw EMA data to meaningful information for clinicians do not currently exist. More research is needed to optimize EMA for clinical use and to empirically determine the value of EMA in clinical settings. We hope that in the future EMA can help us understand what individuals with hearing loss are doing in the real world and what factors may affect their success with audiology intervention—and who knows, maybe a clinically-friendly version will be available soon.
Acknowledgements
The research described in this paper was supported by NIH/NIDCD R03DC012551 and the National Institute on Disability, Independent Living, and Rehabilitation Research (NIDILRR, grant number 90RE5020-01-00). NIDILRR is a Center within the Administration for Community Living (ACL), Department of Health and Human Services (HHS).
References
Bentler, R.A., Wu, Y.H., Kettel, J., & Hurtig, R. (2008). Digital noise reduction: outcomes from laboratory and field studies. Int J Audiol, 47, 447-460.
Bradburn, N.M., Rips, L.J., & Shevell, S.K. (1987). Answering autobiographical questions: the impact of memory and inference on surveys. Science, 236, 157-161.
Cord, M.T., Walden, B.E., Surr, R.K., & Dittberner, A.B. (2007). Field evaluation of an asymmetric directional microphone fitting. J Am Acad Audiol, 18, 245-256.
Galvez, G., Turbin, M.B., Thielman, E.J., Istvan, J.A., Andrews, J.A., & Henry, J.A. (2012). Feasibility of ecological momentary assessment of hearing difficulties encountered by hearing aid users. Ear Hear, 33, 497-507.
Hasan, S.S., Chipara, O., Wu, Y. H., & Aksan, N. (2014). Evaluating auditory contexts and their impacts on hearing aid outcomes with mobile phones. In Proceedings of the 8th International Conference on Pervasive Computing Technologies for Healthcare (pp. 126-133). ICST (Institute for Computer Sciences, Social-Informatics and Telecommunications Engineering).
Hasan, S.S., Lai, F., Chipara, O., & Wu, Y.H. (2013). AudioSense: Enabling real-time evaluation of hearing aid technology in-situ. In Proceedings of the 26th IEEE International Symposium on Computer-Based Medical Systems (pp. 167-172). IEEE.
Henry, J.A., Galvez, G., Turbin, M.B., Thielman, E.J., McMillan, G.P., & Istvan, J.A. (2012). Pilot study to evaluate ecological momentary assessment of tinnitus. Ear Hear, 33, 179-290.
Klein, K.E., Wu, Y.H., Stangl, E., & Bentler, R.A. (in press). Using a digital language processor to quantify the auditory environment and the effect of hearing aids for adults with hearing loss. J Am Acad Audiol.
Palmer, C., Bentler, R., & Mueller, H.G. (2006). Evaluation of a second-order directional microphone hearing aid: II. Self-report outcomes. J Am Acad Audiol, 17, 190-201.
Preminger, J.E., & Cunningham, D.R. (2003). Case-study analysis of various field study measures. J Am Acad Audiol, 14, 39-55.
Shiffman, S., Stone, A.A., & Hufford, M.R. (2008). Ecological Momentary Assessment. Annu Rev Clin Psycho, 4, 1-32.
Smeds, K., Wolters, F., & Rung, M. (2015). Estimation of signal-to-noise ratios in realistic sound scenarios. J Am Acad Audiol, 26, 183-196.
Walden, B.E., Surr, R.K., Cord, M.T., & Dyrlund, O. (2004). Predicting hearing aid microphone preference in everyday listening. J Am Acad Audiol, 15, 365-396.
Wu, Y.H., & Bentler, R.A. (2010). Impact of visual cues on directional benefit and preference: Part II--field tests. Ear Hear, 31, 35-46.
Wu, Y.H., Stangl, E., Chipara, O, Hasan, S.S., Welhaven, A., & Oleson, J. (in revision). Characteristics of real-world signal-to-noise ratios and speech listening situations of older adults with mild-to-moderate hearing loss. Ear and Hearing.
Wu, Y.H., Stangl, E., Zhang, X., & Bentler, R.A. (2015). Construct validity of the Ecological Momentary Assessment in audiology research. J Am Acad Audiol, 26, 872-884.
Citation
Wu, Y-H. (2017, June). 20Q: EMA methodology - research findings and clinical potential. AudiologyOnline, Article 20193. Retrieved from www.audiologyonline.com