Editor’s Note: This is an edited transcript of a live webinar on AudiologyOnline.
Sam Atcherson: Last week in our electrophysiology webinar series, we talked about middle latency responses (MLR), late latency responses (LLR) and P300. This week we will talk about cortical response applications for audiometric and audibility assessment. This is not a new concept. We are going to talk about where cortical response testing started and where we are currently. There are still a lot of questions in my mind about this, and, to be honest, I am just a few steps ahead of you.
I will start by reviewing some background information. We will talk about basic stimulus and recording parameters, some of which we may have no control over, depending on the equipment that we use. I will talk about at least two different systems that are available for recording; one is commercially available and one is not. Then we will get into some examples of how we can look at and analyze cortical auditory evoked potentials (CAEPs) for threshold estimation purposes and audibility.
Background and Introduction
Let’s get started. My academic lineage goes back to Hallowell Davis. My research mentor was Herbert Gold, who is at the University of Memphis, and his mentor was Albert Derbyshire, who he earned his Ph.D. at the University of Illinois Champaign. Al Derbyshire was a student of Hallowell Davis. In fact, it was Al Derbyshire who brought Hallowell Davis a paper on electroencephalograms (EEGs) recorded in a monkey. Hallowell Davis, Al Derbyshire and others spent years trying to hone some equipment to see if they could record the first human EEG in the United States; they were successful at doing so in 1934. I am honored to be part of this legacy that goes straight back to Hallowell Davis.
Davis’ first wife, Pauline Davis, was also involved in his laboratory. She published a paper in 1939 where she documented what was probably the first evoked potential, and she saw it within the EEG trace. This was long before averaging computers were even available.
Hallowell Davis developed a signal averaging computer in 1963; he was one of only a few to do this during this time period. From that, he started many studies related to auditory evoked potentials. He was one of the first to seek an objective audiometric test. We tend to think of things like auditory brainstem response (ABR) and auditory steady-state response (ASSR), but long before that, we were only looking at cortical potentials. Beginning in about 1965, Davis began investigating the use cortical potentials in infants and young children for threshold estimation. He pursued it relentlessly until the ABR came about and overshadowed cortical potentials in the United States. I believe cortical potentials are still used to some extent outside of the United States for threshold estimation purposes.
Pauline Davis (1939) first observed the P1, N1, and P2 responses in the EEG, although they certainly did not call it that then. They called it the vertex potential, and it was considered a nonspecific potential, because you could evoke it through flashes of light, through shocks and through auditory stimulation.
Once a signal averaging computer was available, a Davis, Mast, Yoshie and Zerlin (1966) began evaluating the vertex potential. This was one of the first published illustrations of what the vertex potential looked like. In 1966, Davis and his colleague, Zerlin, were looking at how they might use a cortical potential for threshold estimation. Certainly, when the stimulus intensity was high, the overall N1-P2 peak-to-peak amplitude was high and gradually got smaller until it disappeared. This testing has been around for a long time. It has disappeared somewhat from our clinical literature, but I believe it is beginning to re-emerge.
In current clinical practice, we see widespread use of the click and tone burst ABR. There are other measures used less frequently, such as electrocochleaography (ECochG), ASSR, MLR, P300, and CAEPs. We will be addressing the LLR or the CAEPs today. I found a survey (Martin, Champlin, & Chambers, 1998) regarding the types of evoked potentials that were routinely being performed in our field. The late evoked responses only accounted for 2% of the practices reported by about 200 participants at that time. I think that number will start to grow with the burgeoning interest in the HEARLab system, which I will discuss today.
Anatomy & Physiology
When we use the ECochG, we are mainly looking at gross cochlear potentials within the inner ear, including the auditory nerve. The ABR will sample some activity from the cochlea, especially if you see a cochlear microphonic. Then you have wave I, which is generated from the auditory nerve; wave II is likely generated from the proximal end of the auditory nerve; the remaining waves are generated from most of the fiber tracts and structures within the brainstem up through the inferior colliculus. The MLR, as you may know, undoubtedly has some generators around the inferior colliculus through the cortex. Finally, we have the CAEP. Because the word cortical is in its title, it is in all probability from the auditory cortex. That does not mean that the CAEP does not have other generators, such as the frontal cortex.
There is no one-to-one relationship between a wave that you see in an anatomical structure and the brain when you move beyond wave I and II. As we get further away from the auditory nerve, there can be multiple sources that contribute to a particular waveform. If a wave is missing from the morphology, why is it missing? It could be any number of different structures that have been affected. Evoked potentials typically change in their neural makeup from action potentials to postsynaptic potentials. The ABR is largely composed of action potentials, but once we get to the MLR, the LLR and the CAEP, we start to record more postsynaptic potentials.
When I was in my Ph.D. program for five-and-a-half years, I learned very quickly from my literature searches that there were many different names for the cortical response. To stay consistent and current with the term that the majority of people are using for threshold estimation or audibility using cortical potentials, we will use the term CAEPs. Be aware that if you see other names, they are generally talking about the same thing.
Secondly, the CAEP will contain characteristics of both exogenous and endogenous properties. Exogenous means the response is stimulus bound; any change in the stimulus could change the morphology of the waveform. Endogenous means that the response is internally generated. The state of attention is important. If you are fatigued, on medications or influenced by alcohol, your endogenous factors will come into play. The bottom line is that the patient’s state of attention needs to be such that they are awake or alert during these measures.
Characteristics of the CAEP
The particular potentials that we are looking at today will mainly be the P1, the N1 and the P2 (Figure 1), but these components are only a small part of many other components that are cortical in nature. The components occur between 50 and 250 milliseconds, and when you record these, you often cannot see the MLR or earlier waves. However, P1 is sometimes associated with Pb of the MLR.
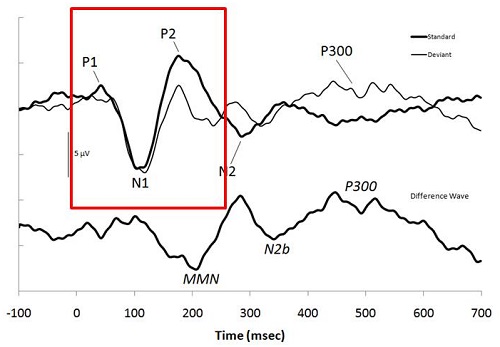
Figure 1. Example of a CAEP and the associated markers. Image from: Atcherson, S.R. & Stoody, T.M. (2012). Auditory electrophysiology. NY: Thieme, www.thieme.com. Reprinted with permission.
P1 will usually range from about 50 to 70 milliseconds. The reason I am not specifying an actual latency is because we will be considering pediatric patients as well. The younger the patient is, the longer the P1 latency, and you may or may not even have an N1 or P2. Again, the generators are usually within the auditory cortex, and there will likely be some association cortex contributions as well. We can certainly see some contributions from the frontal cortex and perhaps the reticular activating system. Since we are not talking about neurodiagnostics for this particular presentation, we will focus our interest on whether or not the response is there and if you can use it for threshold estimation.
We need to be very aware of the effect of maturation on this particular potential. Ponton et al. (2002) studied a wide age range of children. The earliest age was 5 to 6 years of age, spanning all the way to 19 to 20 years of age. The 5 to 6-year-olds had a very large positive-going wave, going down to a very large negative wave. The 12-year olds, by contrast, had a very small positive response, a beginning negative response going back up to positive and then negative again. This may be the emergence of P1 and P2.
What would we call this particular P-wave? Conventionally, if this was a young child, we would probably call it P1. What is happening is that N1 is beginning to develop with maturation. By the time you become a young adult, you can clearly see P1, N1, and P2. If you consider doing this across the of the lifespan, you need to keep in mind that young children will not have an adult-like CAEP until they are approximately 12 years of age.
Just to show that I was able to use this on my own equipment, I took a /ba/ stimulus, modeled after what Anu Sharma and her colleagues developed (2005). Figure 2 shows the recording from an 18-month-old girl. This was my oldest subject, who is now four years of age. You can see she has a very large positive-going response. We are going to call that P1. Then I asked one of the Au.D. students to be a subject and did the same thing with her. You can see she has a very different morphology than what you would expect for the 18-month-old. You can see that P1, N1 and P2 are labeled.
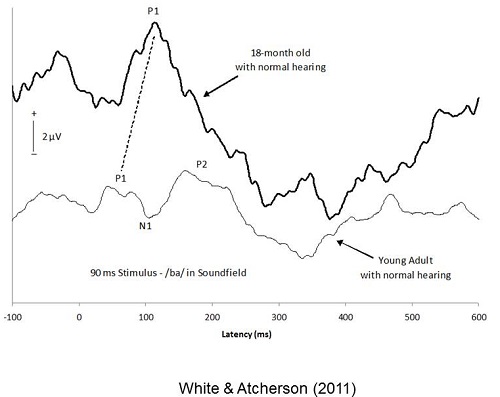
Figure 2. Comparison of CAEP in a toddler to a young adult (White & Atcherson, 2011). Image from Atcherson, S.R. & Stoody, T.M. (2012). Auditory electrophysiology. NY: Thieme, www.thieme.com. Reprinted with permission.
The CAEP changes over time because the brain is still developing. A study by Moore (2002) examined neurofilament immunostaining of cortical tissues. At 40 weeks’ gestation, it looks like there is not much there. At four-and-a-half months of age, it still looks like there is not much there. When we get to two years of age, we start to see some development, and by 11 years of age, we see dark staining of the dendrites of pyramidal neurons. This probably has a lot to do with the development of the CAEP.
Although it does not have much to do with what we are talking about today, I think it is reasonable to look at the research by Anu Sharma and colleagues from 2005. She was able to demonstrate that there is a P1 in a child who was wearing hearing aids and a child wearing a cochlear implant. This may have some clinical application for you, especially if you are trying to determine whether or not a child is receiving adequate acoustic stimulation. If P1 does not continue to get shorter and N1 and P2 do not develop, you may have an issue of auditory deprivation. It is our hope that if we have properly amplified a child and a cochlear implant has been adequately programmed, that their cortex will continue to mature.
The same paper by Sharma (2005) documents one case that I frequently present in my electrophysiology class. They recorded a CAEP at one month post-hearing-aid fitting. The P1 is clearly there. The cortex was active, but they did know if the hearing aid was providing adequate auditory stimulation. Two months later they repeated the measure, and the P1 did not shift in latency at all. They used this to make a clinically informed decision to move forward with a cochlear implant. The child received a cochlear implant and shortly after the cochlear implant hookup, they measured the CAEP again. The P1 was still there. Three months after initial hookup, the P1 started to shorten in latency. Twelve months after receiving a cochlear implant, P1 latency began to shorten again and fall within the normal statistical range. This normative range was developed after this measure was recorded in hundreds of children over the years. P1 latency is graphed on the Y-axis and the age of the child is plotted on the X-axis. This was remarkable. We must keep in mind that the CAEP does not tell you anything about the child's function. All it can suggest is that the cortex seems to be maturing because it is receiving adequate stimulation.
What can we do clinically with CAEPs? We can use it to identify cortical lesions in the absence of an imaging test, or if an imaging test is not showing a lesion, certainly the CAEP might. We can use it for cortical processing deficits, auditory neuropathy spectrum disorder, and possibly tinnitus. There is some interesting work being done looking at noise-induced hearing loss and whether that might affect cortical potentials. Today, we are going to focus on automatic threshold estimation, audibility assessment or detection and discrimination.
Targeted Clinical Uses
Sharma’s (2005) P1 findings are a biomarker of maturation, or lack thereof. One clinical use would be to determine unaided versus aided function. You can certainly look at the benefit of amplification and implant devices as Sharma’s paper suggested. There is some newer work looking at different signal processing features in hearing aids, such as frequency lowering. It is one thing to have good aided performance, but it is another thing for the hearing aid to do what you want it to do.
We can look at threshold estimation, which is called cortical evoked response audiometry. Most of the literature has focused on medico-legal cases, or adults with noise-induced hearing loss. I think we need to consider how we might use this for infants and young children if it is feasible. There is more work to be done in that area.
Finally, we can use CAEPs as an alternative response when the ABR is absent. If the ABR is absent, the cortical potential may not be; but if you record the cortical potential, you can look at the quality of the morphology. It seems to me that if you have auditory neuropathy spectrum disorder, your CAEP may look relatively normal if the case is mild, but if the case is severe, it may look disordered. This is just another tool that you might use to determine the next course of action for that child.
You can also record a cortical potential in individuals with severe degrees of hearing loss. I was quite surprised that I was able to record a cortical potential from myself. I was excited that I could measure any brain-related activity with a severe to profound hearing loss. Do not discount that fact.
Stimulus and Recording Parameters
As I said earlier, some of the evoked potential systems may not give you options to change the recording parameters. Figure 3 shows the parameters that are commonly listed in the literature. These do not change very much. The only time you would think about changing anything is when you are using a long stimulus; you might need a longer recording window. You can certainly experiment with the number of sweeps. If you are testing a very cooperative adult, you might be able to get a response in as few as 10 to 20 sweeps, but you may need record between 200 and 500.
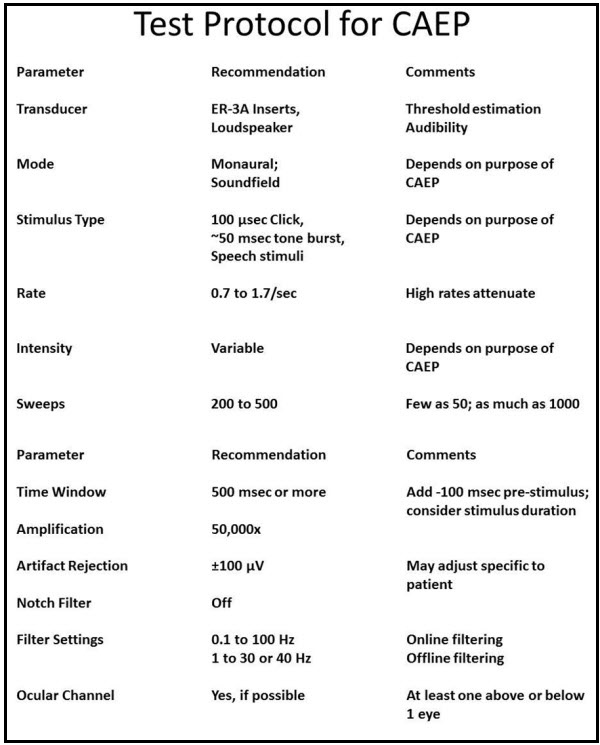
Figure 3. Sample test protocol for recording CAEPs.
Transducers
If you are going to use CAEPs for threshold estimation, it is probably best to use ER-3A inserts. If you are going to look at audibility using hearing aids and cochlear implants, particularly if you want to do pre/post assessments, the only option is to use a loudspeaker.
Mode
The mode of recording could be monaural or soundfield. If it is soundfield, how can we assess the two different ears? I am still trying to wrap my brain around that one, but it will depend on what you intend to use the CAEP for.
Stimulus Type
The beauty of CAEP is that you can use almost any stimuli, including a noise burst with a gap in it. Today, we will consider how we might use clicks, tone bursts, and speech stimuli.
Rate
The rate is going to be very slow. The HEARLab, I believe, presents four stimuli a second. When we think about ABR, it seems like that would take a long time, but the cortical potential is much larger, and you will not need as many stimuli. If you go too fast, you run the risk of attenuating the morphology of the response.
Intensity
The intensity of the stimulus will be variable. If you are looking for threshold, that is going to change. If you are going to do audibility assessments, you will used a fixed level. The HEARLab uses fixed levels of 55, 65, and 75 dB.
Recording Window
The time window will be large compared to earlier potentials that we have discussed. You need to have a window of at least 500 milliseconds, and if you have the option, consider adding a pre-stimulus baseline. That pre-stimulus baseline may be helpful when you are looking at absolute amplitudes of individual peak responses.
Amplification
Amplification will be about 50,000 times. The ABR is typically 100,000 times because it is a smaller response than the CAEP.
Artifact Rejections
The artifact rejections should be somewhere around plus or minus 100 microvolts. This is to help you with large motor movements, such as eye blinks. Sometimes you will not be able to reject artifact if it is less than that value. Some clinicians and researchers like to set that level specific to the patient. They can have the EEG running and ask the patient to blink their eyes in rapid succession. From that measurement, they can adjust the artifact rejection accordingly. That is ideal.
Filter settings
Notch filters are typically turned off. Filter settings will be set at about 0.1 to 100 Hz. I often use that setting for online filtering, which is when the system is averaging with the patient in the chair. However, after the patient has left and I start to analyze, I may drag that low-pass filter setting down so that it will effectively smooth out the response and make it a little bit easier to analyze. Some individuals will start out recording with that lower band-pass filter; that is acceptable as well.
Ocular Channel
I would advocate using an ocular channel if it is possible or available. The HEARLab is only a one-channel system; it does not even offer the option of an ocular channel. In some of the manufacturer materials, they have said that it did not seem to be clinically appropriate. Maybe they are thinking of infants. The last thing we want to do is upset an infant because we are scrubbing their cheek. If you can use it and you have access to it, then you might consider using it. The purpose is to monitor eye blinks that so that we can drive the artifact rejection to do its job.
Replication
A good rule of thumb is to do a minimum of two runs. If you are doing a threshold search, I would not advocate that you do two runs, except right around threshold. This way you are saving time.
Montage
The clinical montage is often found to be the active or non-inverting electrode at Cz or Fz. The inverting electrode is at the earlobe or mastoid, and the ground can depend on the montage you are using. If you are using only one channel with three electrodes, then you can probably put the ground on the earlobe, mastoid or on the forehead. If you are using two channels and you have an electrode on both ears, then the ground should go on the forehead. If you have the option, you can consider placing the ocular electrode to help with artifact rejection.
From what I see in the literature, there are many different configurations for the reference electrode. I would stick with what I have reviewed, but be aware that there may be some other sites that are used, such as the nape of the neck. I am also seeing linked earlobes versus stimulation-ear earlobe. My personal preference is not to use linked earlobes, because I feel like if you are going to use multiple electrodes on the scalp, then the linked earlobes might force a symmetry over the voltage on the scalp. If you are using only one active electrode on the head, linked earlobes might be okay.
New and Existing CAEP Systems
Let's focus systems that are currently available. I have access to the Intelligent Hearing Systems Smart EP system, and I also have access to the Biologic Navigator Pro system. I could certainly record CAEPs and use it for threshold estimation as well as audibility assessment. Both of these systems allow me to import custom stimuli, but I would have to develop my own normative data for that stimuli. There are other systems available where you may have those same options.
In my opinion, the best option in the United States is a system that has recently received FDA approval, and that is the HEARLab system from Frye Electronics. The HEARLab system was developed by Harvey Dillon and his colleagues at the National Acoustics Laboratory (NAL) in Australia. Dr. Dillon is one of the world's foremost authorities in hearing aid amplification and prescription measures. His interest in hearing aids naturally evolved into figuring out a way to use evoked potentials to provide accurate information for hearing aid fittings. My guess is that he was not particularly happy with the capabilities of ABR systems. Secondly, ABR systems only provide information about the cochlea, the auditory nerve and the brainstem, with absolutely no information about the cortex, which is where perception occurs. He worked with a team and developed the HEARLab system. There are a number of publications available about that in your handout. The HEARLab system provides only two modes: aided cortical assessment and cortical threshold estimation, or cortical tone assessment as they call it.
The HEARLab system uses Hotelling’s T2 statistical procedure to help quantify the likelihood that a response is present. You may be familiar with the FSP quantification technique used with ABR. The HEARLab procedure is similar, in that it will let you subjectively analyze waveforms as you are recording, but it will also give you a statistical measure of value, and that value may increase or decrease your confidence regarding the presence of a response.
This tool and the overall system have been evaluated systematically. It is reported that the HEARLab statistical procedure is probably as good as, if not better than, a live subjective reviewer. If you look at their materials, they will also tell you not to use that statistical tool in isolation. You should use your expertise. If you do not think a response is there, then you should probably trust your gut feeling on that. More information about the HEARLab system can be found at NAL’s Web site (https://hearlab.nal.gov.au/). Because the system was designed and commercialized by Frye electronics, you can also find information there.
Next is the cortical evoked response audiometry system (CERA). This is a research system used by Dr. Guy Lightfoot and his colleagues in the United Kingdom. It is a fantastic system, and Dr. Lightfoot has been advocating for years that we ought to develop a system that would allow clinicians to use cortical potentials. He has a number of good techniques to optimize the system.
The CERA system also uses a statistical procedure, which is a combination of cross-correlation. They will calculate the signal-to-noise ratio (SNR) and provide a p-value for the likelihood of response. Again, this particular system is not clinically available. However, Dr. Lightfoot’s Web site (https://corticalera.com) is brimming with good information.
CAEP Threshold Estimation
While I cannot spend time walking you through every facet of the HEARLab system, I can tell you about my experiences, in addition to other interesting findings that have been published in the literature. Lightfoot and Kennedy published a paper with several case studies in Ear and Hearing in 2006. Those case studies included several patterns of hearing loss. One that they demonstrated was a comparison of CAEP to an asymmetrical hearing loss that was not of a straightforward configuration. They started by evaluating 1000 and 2000 Hz. At 1000 Hz, they presented first at 100 dB HL, and then they dropped it down to 90 dB and then 80 dB. They noted no response at 80 or 90 dB. Dr. Lightfoot likes to use the midpoint between the two intensities that show a response and then no response, so 95 dB would likely be the threshold there. The behavioral threshold at 1000 Hz was 90 dB, so the CAEP was within 5 dB. This is an indication that the behavioral response is true. At 2000 Hz, they recorded a response at 60 dB and 50 dB, and then noted no response at 40 dB. The behavioral threshold at 2000 Hz was 45 dB, indicating no difference between the two measures. Based on this study, this method seems reliable.
Here are some examples of what we have seen in our clinic using the HEARLab system. I have to give 95% of the credit to my student, Raven Brasseux, who did this as her Au.D. capstone project. Figure 4 is an example of recordings at 500 and 1000 Hz in a patient with profound hearing loss. At 500 Hz, she started out recording at 80 dB and did not see anything. At 75 dB, she saw something and wondered if that was noise. She kept decreasing the intensity and did not see anything. She stopped at 75 dB and decided that was probably a response. The trick, though, was that she collected behavioral results prior to using the HEARLab system. She knew beforehand where the threshold should be. Apparently it matched.
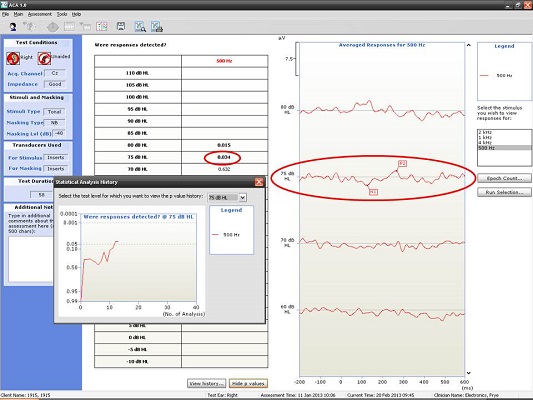
Figure 4. Responses recorded from a patient with profound hearing loss at 500 Hz at 75 dB HL. (Click on image for enlarged view)
The small gray box you see to the left of the recording window in Figure 4 is an example of how Hotelling’s T2 is used. The probability values are along the Y axis and the number of analyses are along the X axis. The goal is to reach a p value of 0.05 or smaller, which she did, so she terminated the recording. There was no response at 1000 Hz (Figure 5), and the Hotelling’s T2 never reached 0.05.
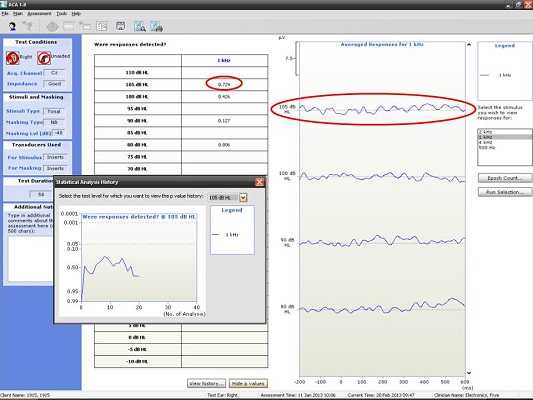
Figure 5. Responses recorded from a patient with profound hearing loss at 1000 Hz using the HEARLab system; no response was noted. (Click on image for enlarged view)
Next, I have an example of a recording at 500 and 4000 Hz from a patient with a moderate hearing loss. In Figure 6, you can see the cortical potential very clearly for 500 Hz at 45, 35, and 25 dB. Threshold is established at 15 dB, and there is no response at 10 dB. When we look at the p-value, it reached 0.05 very quickly and very early on. The first p-value analysis at the top is for 45 dB, and the bottom one is for 15 dB. They both reached a p-value of 0.05. Not only can you evaluate the tracings subjectively, as you should, but you also have access to a quantification technique that can help increase your confidence that a response is there.
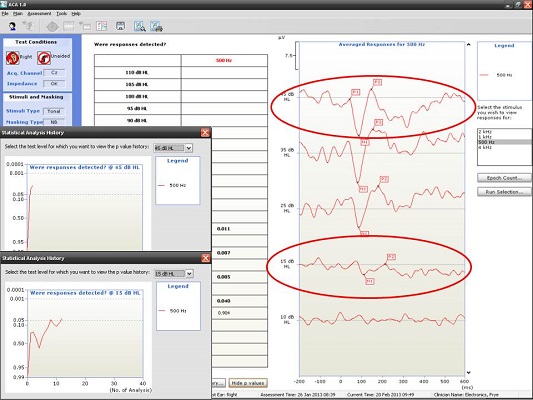
Figure 6. Responses recorded from a patient with moderate hearing loss at 500 Hz using the HEARLab system. (Click on image for enlarged view)
We made a comparison between the worst and best match of behavioral to CAEP thresholds. Figure 7 shows the worst match, where there was a difference of 20 to 25 dB. The HEARLab thresholds were far better than the behavioral thresholds, which is curious.
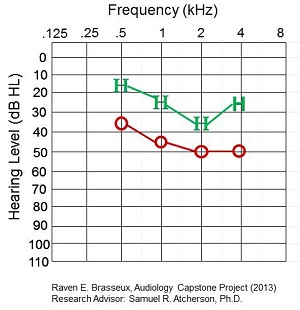
Figure 7. Worst match of behavioral to CAEP thresholds in a patient.
The best match is shown in Figure 8. Thresholds were within 0 to 5 dB for 1000, 2000, and 4000 Hz, and about 15 for 500 Hz.
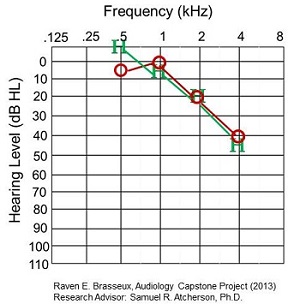
Figure 8. Best match of behavioral to CAEP thresholds in a patient.
Figure 9 shows you a graphical difference between the HEARLab threshold and behavioral thresholds. If the mark is in a positive region, it means that behavioral audiometry threshold was better than HEARLab. If it is in the negative region, it means the HEARLab threshold was better than behavioral audiometry. There does not seem to be a consistent trend, although more subjects in this study showed better HEARLab thresholds than behavioral audiometry. More work needs to be done in that area.
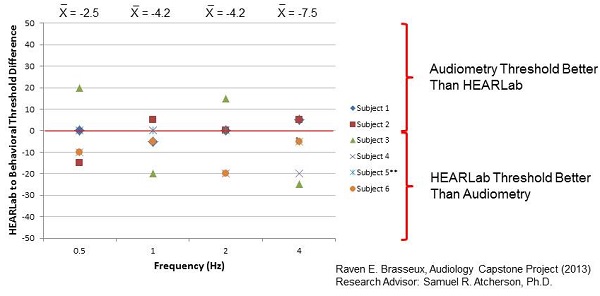
Figure 9. HEARLab to behavioral threshold difference for six subjects.
CAEP Audibility Assessment
The HEARLab is a wonderful tool. The three stimuli they use are a truncated version of “may,” “tay,” and “gay.” Each of these words were evaluated spectrally. The /m/ in may has energy predominantly in the low speech frequency range. The /g/ in gay tends to have spectral energy in the middle speech frequency range, and the /t/ in tay is going to have energy in the high speech frequency range. They validated this particular set of stimuli repeatedly.
Because we are evaluating cortical function, they thought that this might be a useful verification procedure for hearing aid fittings and possibly cochlear implant fittings. The fixed stimuli level will be 55, 65, and 75 dB SPL. The thought is that you might be able to do real-time programming on a cooperative child to see if they can at least hear soft speech sounds with their hearing aids. If they can hear soft speech sounds, can they hear it at 65 dB SPL? Can they hear it at 75 dB SPL? Do we need to make adjustments to the hearing aid fitting?
Figure 10 shows the CAEP response from a seven-year-old. At this age, there should be a P1 followed by some degree of negativity. Keep in mind that we have not reached normal adult maturational levels yet, but for ‘may’, ‘tay’, and ‘gay’ at the softest speech level (55 dB SPL), we were able to achieve a beautiful response. Although we did not approach the p-value of 0.05, I do not think anyone would argue to the contrary that those are valid responses (Figure 10).
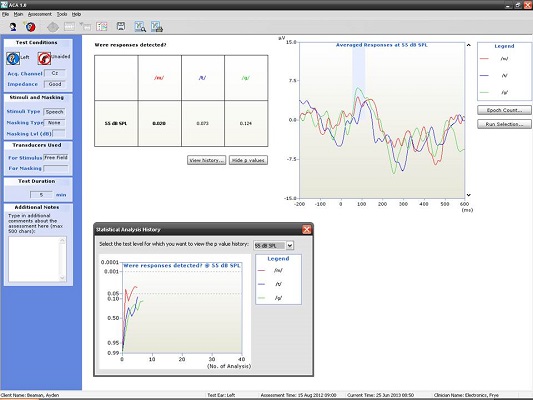
Figure 10. Averaged responses from a seven-year-old patient using truncated speech stimuli. (Click on image for enlarged view)
We know that we can do this on a seven-year old, but what about younger children? Figure 11 is a recording from a four-year-old child. We recorded a nice P1 response for all three of the speech stimuli at the softest speech level.

Figure 11. Averaged responses from a four-year-old patient using truncated speech stimuli. (Click on image for enlarged view)
If you are not impressed with that, let's look at a nine-month-old infant (Figure 12). We were able to get this recording at 55 dB SPL while the baby sat in her mother's lap. The great thing about this particular recording was that the baby had pressure equalization (PE) tubes at the time. There was probably a brief period of time where she was not responding as well as she could have, and those maturational behaviors like localization were just beginning to emerge. When we saw these responses at soft levels, it made mom and dad very happy to say the least.
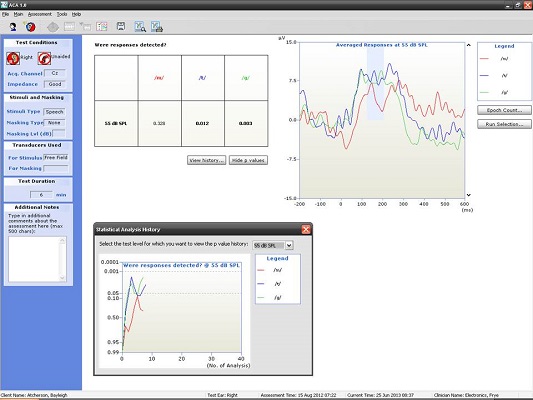
Figure 12. Averaged responses from a nine-month-old patient using truncated speech stimuli. (Click on image for enlarged view)
Where can we go with this? We are interested in exploring this possibility for bone-anchored implants. There is a paper out by Dillon and his colleagues (Munro, Purdy, Ahmed, Begum, & Dillon, 2011) where they simulated a conductive hearing loss. They put earplugs in the participants’ ear and did the audibility measures before and after placing the bone-anchored device on a headband. So these were not true bone-anchored system recipients, but rather a simulated experiment to see if the testing was effective, which it was.
We wanted to replicate this study for ourselves (Atcherson, Nicholson, Franklin, & Smith-Olinde, unpublished). When we placed the earplugs on an adult, we could not get a response to the three speech stimuli in the soundfield. With the earplugs in, we placed the bone-anchored processor on a softband on the patient’s mastoid, and we were able to get all of these responses back. I think the possibilities are endless.
Cochlear Implant Applications
You may be wondering if we can use this clinically for cochlear implant applications. One finding in the literature suggests that some cochlear implant users may produce a very large stimulus-related artifact. We are not entirely sure where that artifact is coming from, and there are techniques to remove it, but is very time intensive. Until we can figure out how to control this, we need to be a bit more reserved about this. I do think a time will come when we will be able to do this.
My responses are shown in Figure 13. We decided to record with the highest level to see what we would get. It looks like it could be a P1, N1, P2 response, but it seems unusually large with a sharp, tri-phasic response. As I sat next to my student to analyze this response, I remember thinking if it was truly cortical or if it was something else. It does look like P2 is present and possibly N1, but N1 is riding on some kind of electrical artifact. This particular setup was with the stimulus to the left cochlear implant with the reference electrode on the left ear.

Figure 13. CAEP recorded by stimulating Dr. Atcherson’s left cochlear implant with the reference electrode located on the left ear. (Click on image for enlarged view)
I thought we might change the reference electrode to the right ear to get it away from the cochlear implant and re-test (Figure 14). Note that the cortical response looks much cleaner with a lower amplitude than the previous waveform (Figure 14). This is a serious issue of which we need to be aware. The p-values reached well beyond 0.05 very quickly in both tracings, but the first one was not a valid response, so you need to be careful to not be misled.
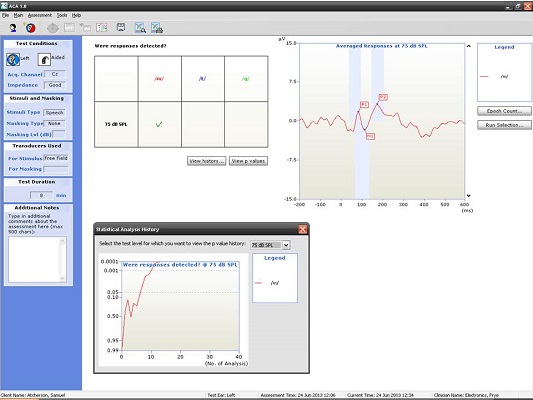
Figure 14. CAEP recorded by stimulating Dr. Atcherson’s left cochlear implant with the reference electrode located on the right ear. (Click on image for enlarged view)
However, when we looked at my right ear, we had an even bigger stimulus artifact than the left ear when the reference electrode was placed contralaterally. It did not matter for the right ear whether we had the reference electrode on the right ear lobe, which was the implant we were evaluating, or the left; a large artifact was still present (Figure 15).

Figure 15. CAEP recorded by stimulating Dr. Atcherson’s right cochlear implant with the reference electrode located on the left ear. (Click on image for enlarged view)
The publication by Atcherson, Damji, & Upson (2011) is one of several that examines stimulus-related artifact. With a slow stimulation rate, you get stimulus-related artifact and you get the cortical potential. If you use a faster stimulation rate, it habituates the cortical potential and leaves only the stimulus-related artifact. If you subtract one from the other, you end up with the CAEP. Unfortunately, the HEARLab system will not allow you to do any kind of post-processing that would enable you to change the stimulation rate with the same stimulus.
Summary
Most commercial systems at the very least will allow you to record CAEPs, and optimized systems with objective statistical tools can improve detection. Know and understand the various stimulus and recording parameters and their associated effects (i.e. maturation and attention) on the patient response.
There are many potential clinical uses for the CAEP, but more research is required. This should not discourage clinical use. I would like to encourage you to consider trying this out. This is in our future, and I do not think it is going away. Stay tuned to the literature because there is promising research being published. If you are interested in this topic and would like to stay on top of it, I recommend you read the articles listed at the back of your handout. They will range from maturation issues to audibility issues to medico-legal issues, as well as HEARLab information. Within each of those articles, you will find more articles that can enrich your knowledge.
I would like to acknowledge a few people. The first two are students of mine, Raven Brasseux, whose information I shared with you today, and Sarah Kennett, who is currently working with me as a Ph.D. student. Other colleagues of mine here in the department or at Arkansas Children's Hospital include Nannette Nicholson, Cliff Franklin, Patti Martin, and Laura Smith-Olinde.
Questions and Answers
Could you please explain the effect of linking earlobes using jumpers or other linking electrodes on CAEP recordings?
Some clinicians use a jumper to have an electrode setup where there is one electrode on each earlobe that go into the same common reference port on the electrode box. That jumper number may vary depending on which manufacturer it comes from. If you do not have a jumper that will allow you to electrically link into the same reference port, you might need to talk to your manufacturer. Perhaps the linking will allow you not to have to unhook one ear and hook the other up for clinical efficiency. There should be no overall effect on the recording itself, however.
Approximately how long does it take to record a CAEP?
If you are using your own clinical system and presenting a minimum of 20 stimulus presentations, you might be able to get a solid waveform in a couple of minutes. Every waveform should be replicated, so that will double your time.
If you are using the CAEP for threshold purposes, you will start building on from there. From my readings, it seems that the CAEP procedure may not be any longer than the ABR for threshold estimation. You should optimize your system and become familiar with it prior to routine clinical testing so that you know what you are doing and can be quick about it.
What are the CAEP findings in those with single-sided deafness or with a unilateral cochlear implant?
It is clear from the literature that if you have a unilateral hearing loss and you were to record monaural CAEPs, the CAEP on the deaf side will look very different from the normal ear on the other side. What you might consider doing, however, is putting a little masking noise in the normal ear so that you do not have any crossover. It is seems to be the case that, even with severe to profound hearing loss, you can still get a cortical potential.
Does attention affect the sensitivity of CAEP and auditory threshold estimation?
Absolutely. The patient needs to be awake and alert, but then you immediately start thinking how you can accomplish this with infants. The HEARLab developers have a number of different recommendations for how to work with infants. An infant, for example, would be sitting on a parent’s lap and may be watching something softly on TV or they may be able to play with an iPad or something like that. You would give them anything to minimize activity. The bottom line is that have to be awake. If they are sleeping, you run into the risk of having alpha rhythms, which means that the cortex seems to deactivate and you end up with large, rhythmic, cyclic-looking EEGs that can obscure the cortical potential.
What do CAEPs look like when recorded from individuals diagnosed with auditory neuropathy spectrum disorder (ANSD)?
I do have examples, not included today, of adults with auditory neuropathy. In a normal case, you can clearly see P1, N1, and P2. A significant case of ANSD had a virtually indistinguishable, unidentifiable CAEP. Some individuals with moderate to severe ANSD had what looked like smaller amplitudes and longer latencies. I cannot tell you one particular configuration that applies to all individuals with ANSD because it varies from person to person. I would be very interested in seeing what HEARLab can do with some of those individuals.
You showed a case where there was no response at 80 dB, but there was a response at 75 dB. Can you clarify how that is?
That was my student’s project. If there is not a response at a higher intensity level, but there is a response at a lower intensity level, you need to investigate that. In that situation, I would have gone back up to 80 dB and then repeated 75 dB to see what I got. Nevertheless, my student went in with the mindset that she already knew what the behavioral results were, and she wanted to find threshold with CAEP to see how well-correlated they were. For that particular project, the focus was on correlation as opposed to detection. I thank you for bringing that up. That is certainly a flaw in that particular study, and I would not advocate that you delete waveforms; you should replicate all waveforms in a clinical setting. You need to continue investigating things when they do not make sense.
Dr. James Hall (moderator): That was an excellent presentation Sam, and it raised all kinds of interesting possibilities. I think that the research on the auditory cortical responses has been ongoing almost since Hallowell Davis conducted his first study in 1939. I know I am an optimist, and I agree with you that we are entering a new era, because there are systems that are clinically feasible and user-friendly for recording cortical responses. There are features, such as the statistical confirmation of a response, that are now being utilized in clinical settings. I am hoping that within the next four to five years that the major manufacturers begin to incorporate some of the research findings into clinical equipment, such as speech stimuli and statistical correlation of the waveforms on more than just two channels.
References
Atcherson, S.R., & Stoody, T.M. (2012). Auditory electrophysiology. NY: Thieme, www.thieme.com.
Davis H., Mast T., Yoshie N., & Zerlin S. (1966). The slow response of the human cortex to auditory stimuli: recovery process. Electroencephalography and Clinical Neurophysiology, 21, 105-113.
Davis, H., & Zerlin, S. (1966). Acoustic relations of the human vertex potential. Journal of the Acoustical Society of America, 39, 109-116.
Davis, P. A. (1939). Effects of acoustic stimuli on the waking human brain. Journal of Neurophysiology, 2, 494-499.
Lightfoot, G., & Kennedy, V. (2006). Cortical electric response audiometry hearing threshold estimation: accuracy, speed, and the effects of stimulus presentation features. Ear and Hearing, 27(5), 443-456.
Martin, F. N., Champlin, C. A., & Chambers, J. A. (1998). Seventh survey of audiometric practices in the United States. Journal of the American Academy of Audiology, 9, 95-104.
Moore, J. K. (2002). Maturation of human auditory cortex: implications for speech perception. Annals of Otorhinolaryngology, 111, 7-10.
Munro, K.J., Purdy, S.C., Ahmed, S., Begum, R., & Dillon, H. (2011). Obligatory cortical auditory evoked potential waveform detection and differentiation using a commercially available clinical system: HEARLab™. Ear and Hearing, 32(6),782-786. doi: 10.1097/AUD.0b013e318220377e
Ponton, C. W., Eggermont, J. J., Khosla, D., Kwong, B., & Don, M. (2002). Maturation of human central auditory system activity: separating auditory evoked potentials by dipole source modeling. Clinical Neurophysiology, 113(3), 407-420.
Sharma, A., Martin, K., Roland, P., Bauer, P., Sweeney, M. H., Gilley, P., & Dorman, M. (2005). P1 latency as a biomarker for central auditory development in children with hearing impairment. Journal of the American Academy of Audiology, 16(8), 564-573.
Cite this content as:
Atcherson, S.R. (2013, October). Cortical response applications for audiometric and audibility assessment. AudiologyOnline, Article 12165. Retrieved from: https://www.audiologyonline.com